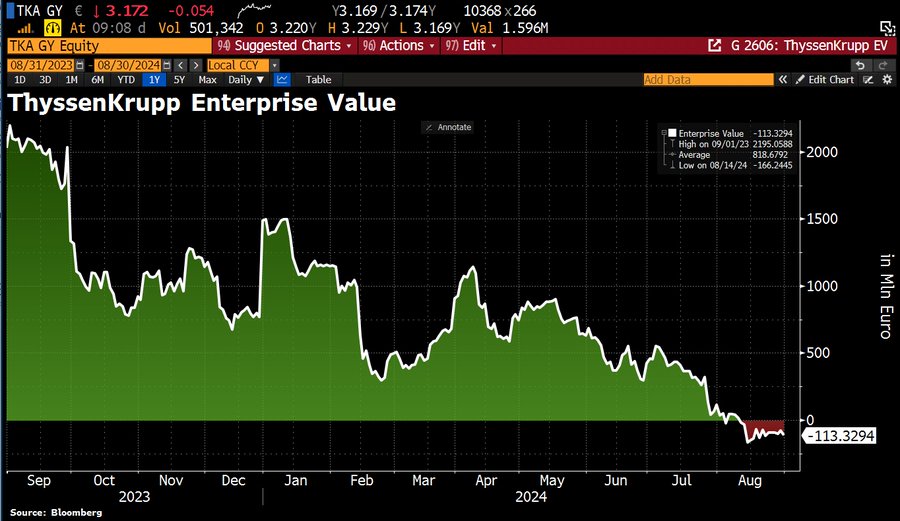
I read “The Arms of Krupp” by William Manchester. A great book about the rise of ThyssenKrupp during World War II. It is one of the world’s largest steel producers, but it now has NEGATIVE ENTERPRISE VALUE.
The cause? Germany is up the creek without an economic paddle after years of gross mismanagement by Angela Merkel and her party. Mass immigration in Germany and a slowdown in the global economy aren’t helping.
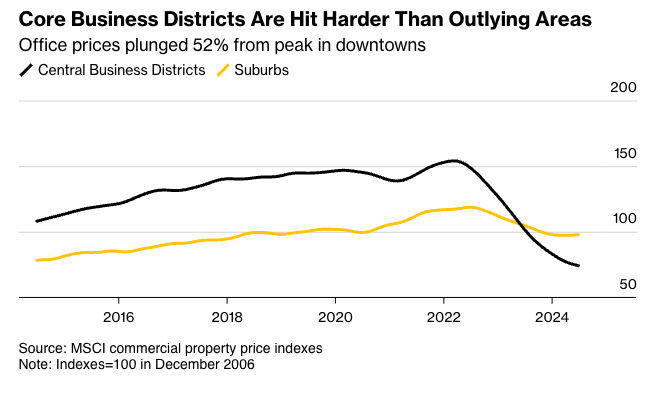
Commercial real estate market challenges are more severe for older office towers in downtown metro areas than those outside city centers. The mismatch between funding needs and available credit in a high-interest-rate environment has also intensified the strain on building owners, as elevated tower vacancy rates persist across many markets due to the ongoing trend of remote work becoming the norm.
Aging business districts from Los Angeles to Chicago to Boston of zombie towers with high vacancy rates that have no use in today’s economy.
Big landlords, including Brookfield, Blackstone, and Starwood Capital Group, have walked away from older downtown towers in recent quarters.
The latest data from MSCI shows office values in metro areas have crashed 52% from their highs. Some of the worst declines have occurred in San Francisco, Manhattan, Washington, and Boston.
Source: Bloomberg
Between 2019 and 2023, about $557 billion of value evaporated from US offices due to a multi-year slide in demand, with older towers quickly falling out of favor with companies, according to an estimate by economists at Columbia and New York universities. CBRE Group noted that only 2% of towers in the US are considered top-tier, with rents 84% higher than the rest of the market.
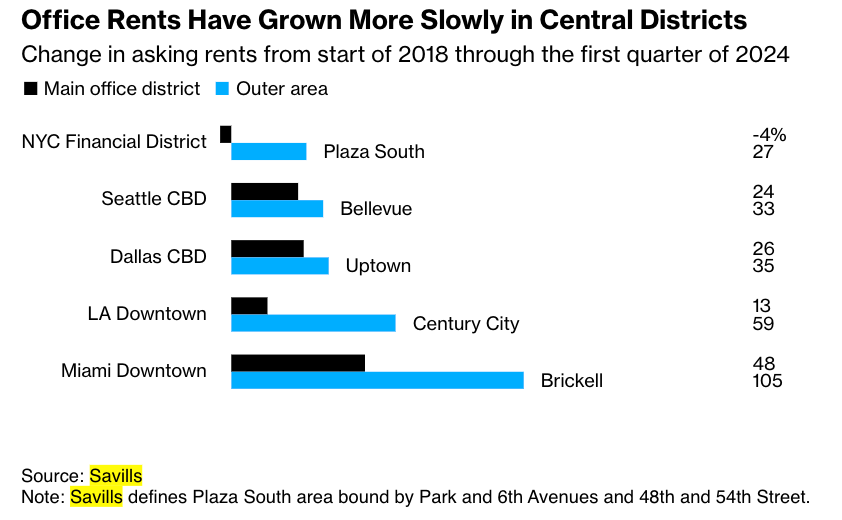
Data from brokerage Savills shows office rents in business districts have grown slower than rents for similar buildings outside metro areas.
Source: Bloomberg
The move to new towers highlights how, for decades, the bubbles in legacy downtown districts, fueling economies, have ended for now, and older towers will have to be torn down.
To be very frank. It’s a crisis. Democrats running the crime-ridden metro area are delusional and blinded by their woke religion as the city’s population recently crashed to a 100-year low, and violent crime remains a major issue.
We’ve had conversations with multiple folks at wealth management and investment banking firm Stifel Financial about the latest shift of operations outside the dying business district to a new tower in a much safer and newer district. At first, Stifel contemplated leaving the city for the suburbs because far-left Democrats in City Hall could not enforce law and order.
CRE foreclosures are on the rise.
Don’t forget about Soros-funded district attorneys not enforcing the law in large cities. Expect more of the same if Harris/Walz win the election.
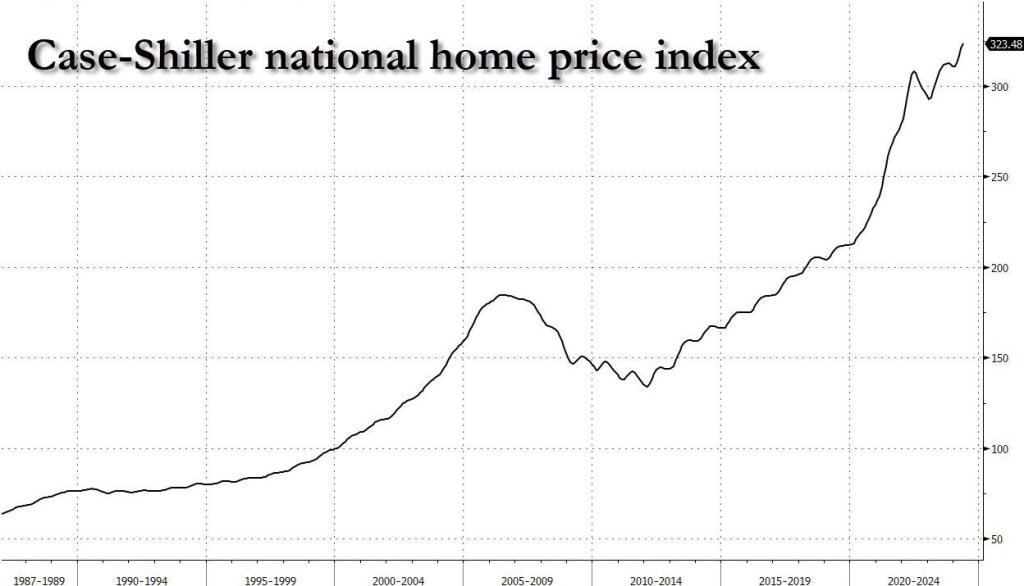
Big bubbles! US home pricest hit an all-time high as The Fed keeps its foot on the monetary gas pedal following the Covid economic shutdown in 2020.
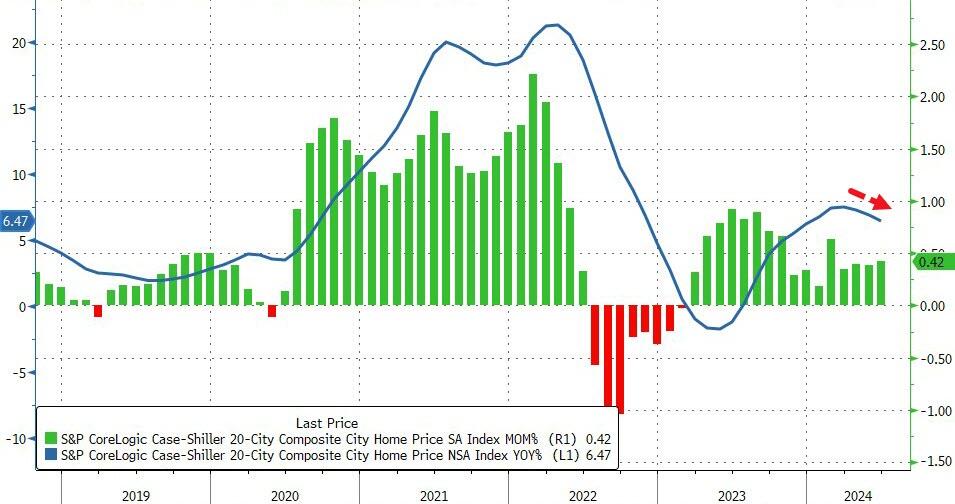
Home prices in America’s 20 largest cities rose for the 16th straight month in June (according to the latest data from S&P CoreLogic – Case Shiller – data today), up 0.42% MoM (hotter than expected and accelerating from May). On a YoY basis, prices rose 6.47%, but notably that is the third straight monthly slowdown in the pace of price appreciation…
Source: Bloomberg
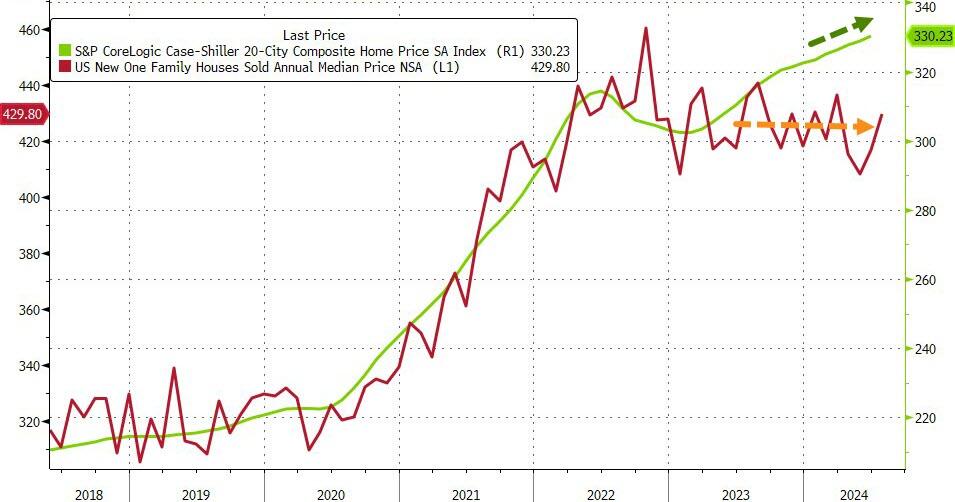
Overall, US home prices reached a new record high in June (as median new home prices continued to tread water)…
Source: Bloomberg
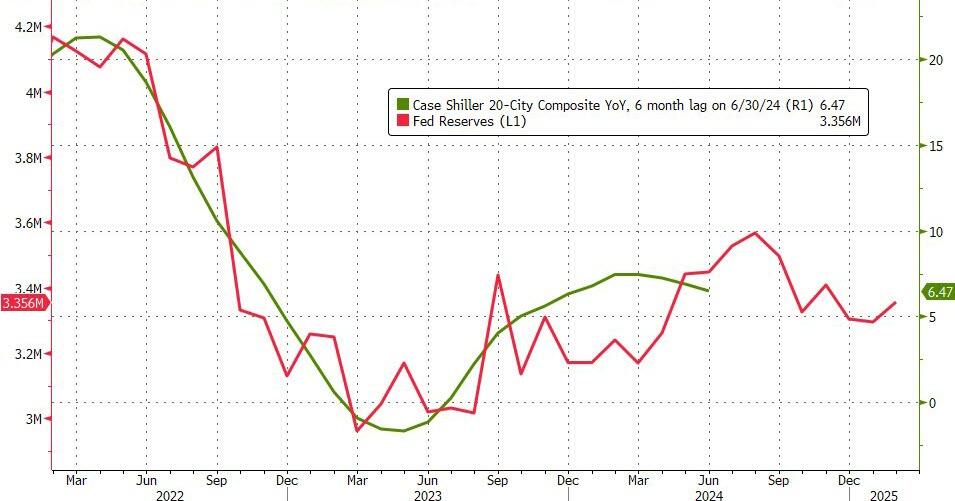
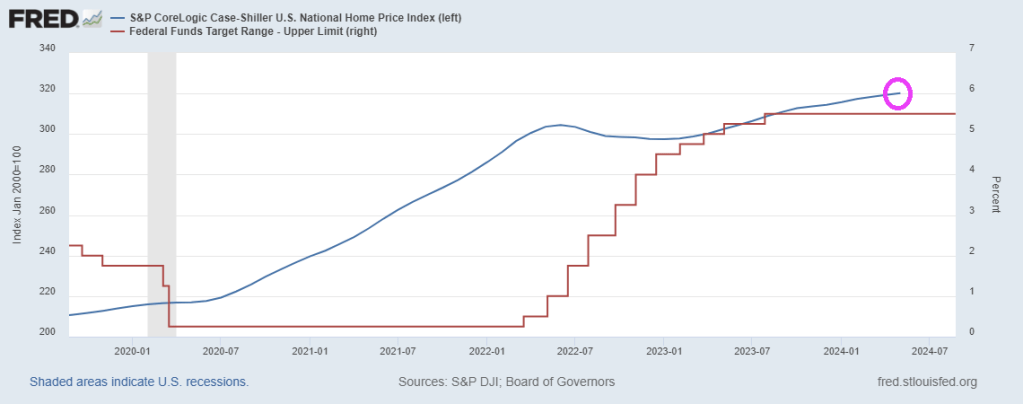
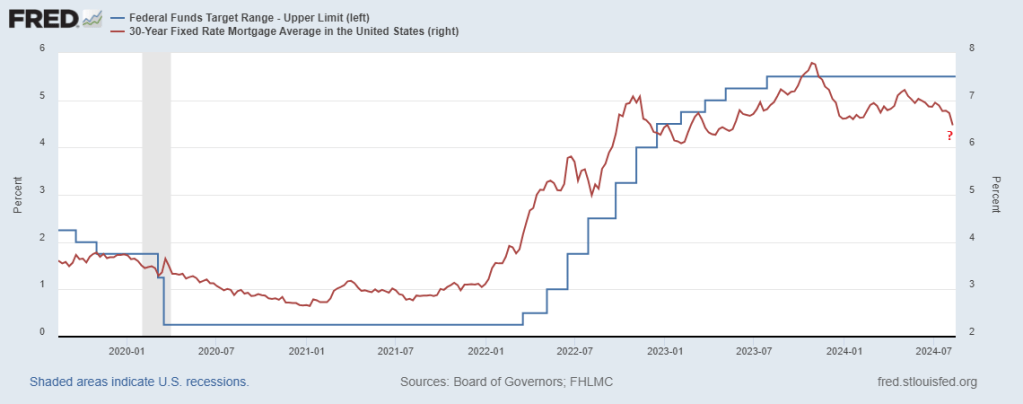
Home prices continue to track Fed Reserves closely, but a turning point may come soon…
Source: Bloomberg
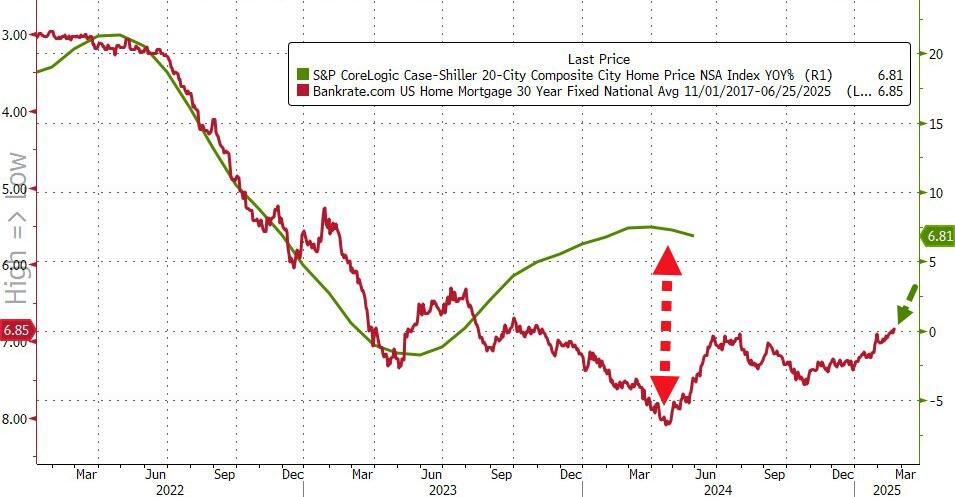
Given the smoothing and heavy lag in the Case-Shiller data, it’s hard to find a causal relationship between prices and mortgage rates…
Source: Bloomberg
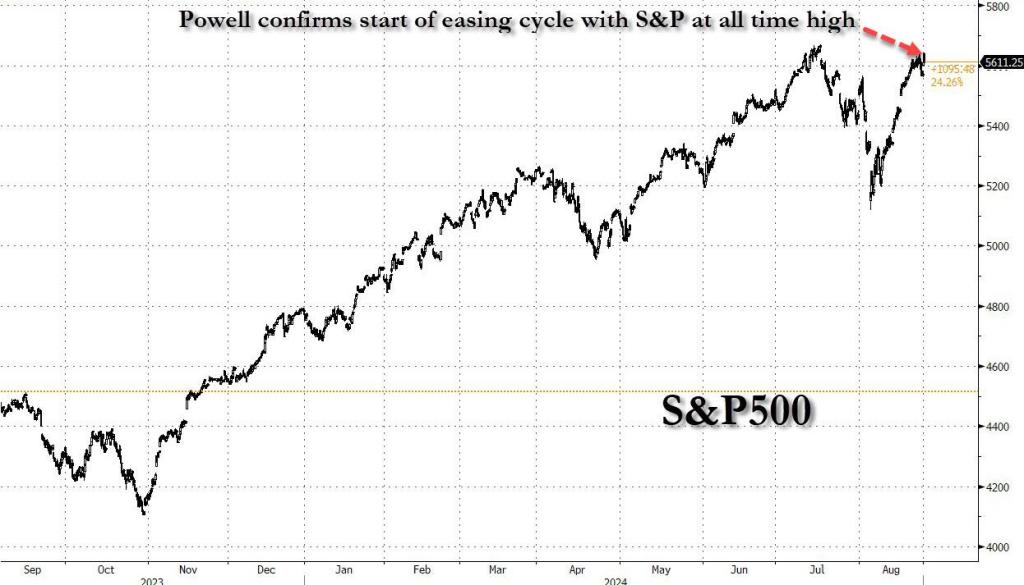
But, with prices reaccelerating and mortgage rates already back below 7.00% – in anticipation of The Fed – WTF does Powell think is going to happen when he actually starts cutting with prices at these record highs.
The Freddie Mac HP index shows the variation in home price growth. New Jersey coastal towns of Atlantic City and Ocean City grew at 10% YoY while Lake Charles LA declined by -2% YoY.
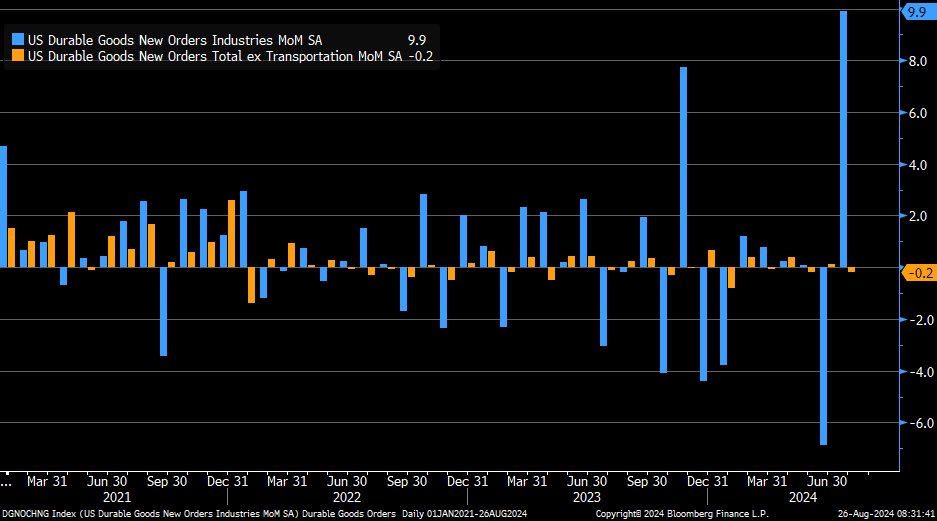
The latest durable goods orders report is like cottage cheese. That is, not real cheese. Non-defense aircraft orders +41.9% MoM!
July durable goods orders (blue) +9.9% m/m vs. +5% est. & -6.9% prior (rev down from -6.7%) … orders ex-transportation (orange) -0.2% vs. -0.1% est. & +0.1% prior (rev down from +0.4%).
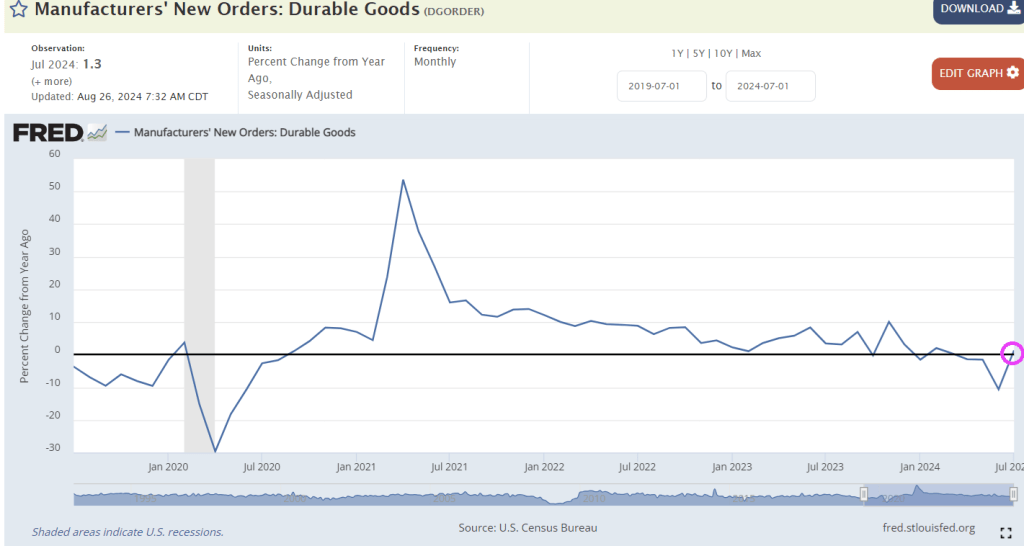
In fact, despite the impressive MoM gain, durable goods new orders are only up 1.3% YoY.
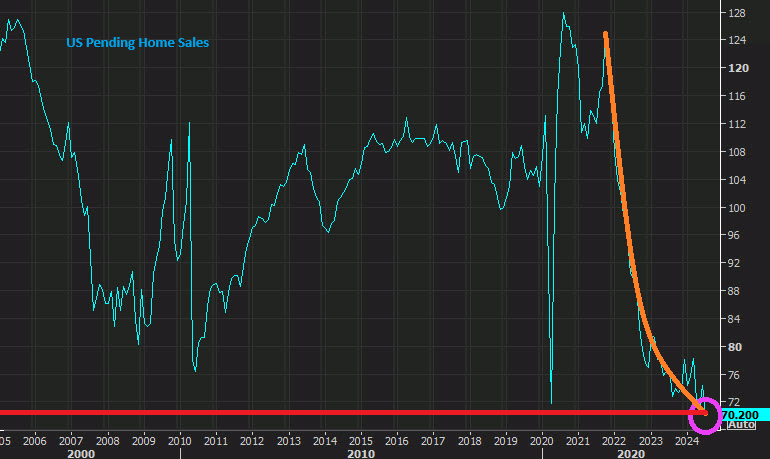
Combined Biden/Harris’ spending spree with The Fed’s monetary goonery and we got inflation (gasoline, food, shelter). With spiraling inflation in mortgage rates and shelter prices we saw a correponding decline in existing home sales under Biden/Harris.
Harris claims to lower prices on her first day in office (she has been in office as VP since 2021 and actually voted in the US Senate as tie breaker to enact policies that INCREASED Inflation). But her suggestion of $25,000 for ALL first time homebuyers is of course INFLATIONARY. And her anti-price gouging policies willl of course reduce supply of groceries avaiable, driving up INFLATION.
Having put inflation fully in the rearview mirror, the “Powell payrolls pivot” is now complete because as the Fed chair said, “the cooling in labor market conditions is unmistakable” even if it was quite mistakable to the Biden admin’s presstitutes as recently as one month ago.
Which is also why it was imperative for the Biden labor department to admit the truth about the deteriorating labor market: without that -818K revision earlier this week, the Fed would have some pushback to turning fully dovish. But now that we know that a third of the job gains in the last year of Bidenomics were bogus…well, please come save us Chairman Fed.
Or, as TradeStation head of strategy David Russell said, “here comes the punchbowl. Jerome Powell came out swinging today with a litany of dovish signals. He said inflation is on a sustainable path lower and talked about how the job market has cooled to pre-pandemic levels. He drove the point home with a clear call for adjusting policy.”
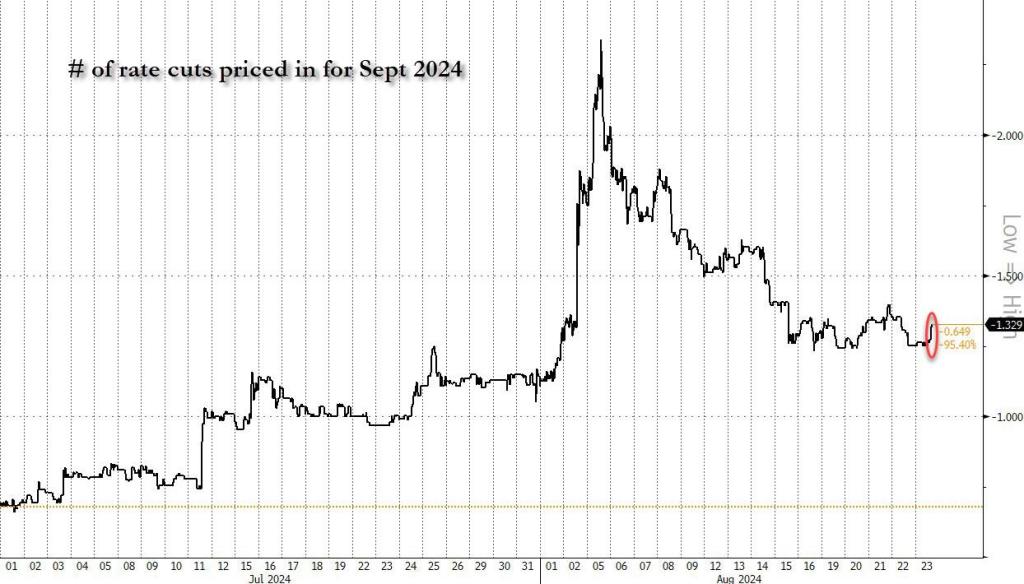
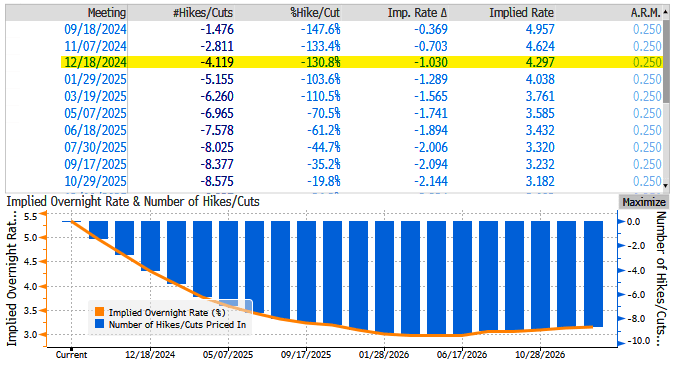
The market agreed, and quickly cemented at least one rate cut while also pricing in as much as 33% odds of a 50bps rate cut.
Which is all great: after all as we have long said, with the November elections looming, the Fed will do everything to make sure the establishment candidate isn’t distracted by such trivial things as a market crash.
There are just four small problems with this.
First: the Fed will end its tightening cycle and starts the next easing cycle with stocks at all time highs, something that has never before happened in the history of capital markets!
It means that, unless the current expansion ends in a gruesome recession which crushes the economy, the S&P is about to enter a full-blown bubble, which in turn will burst in even more spectacular fashion and force the Fed to not only cut back to ZIRP, but activate NIRP (just like Japan did years ago) and also go right back to QE and buying bonds ETFs. For now, however, as in the next three months ahead of the elections, all shall be well and should serve the all time high in the market to Kamala Harris on a silver platter…. which is precisely why the Fed is doing what it is doing.
Second, this is also the first time in history when the Fed has aborted a tightening cycle having achieved zero home price easing. Indeed, one look at the case-shiller index shows that home prices are the highest they have ever been…
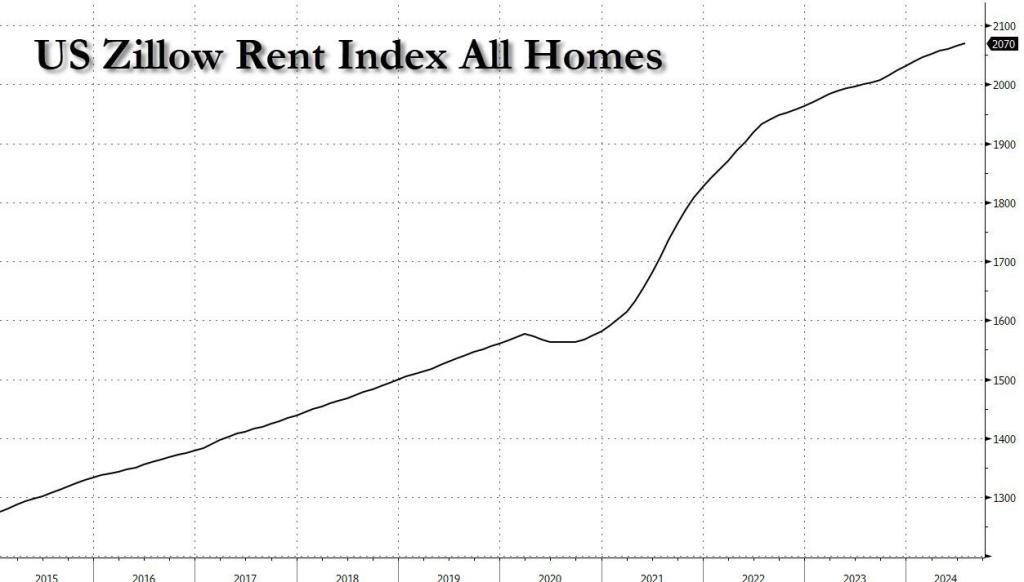
… as are actual asking rents according to Zillow (not that delayed aberration known as Owner-Equivalent Rent).
And then you have Kamala’s promise to provides $25,000 in new home purchase subsidies, which will go straight to the asking price, sending prices even higher.
In short, both home prices and rents, already at record high, are about to go record-er…
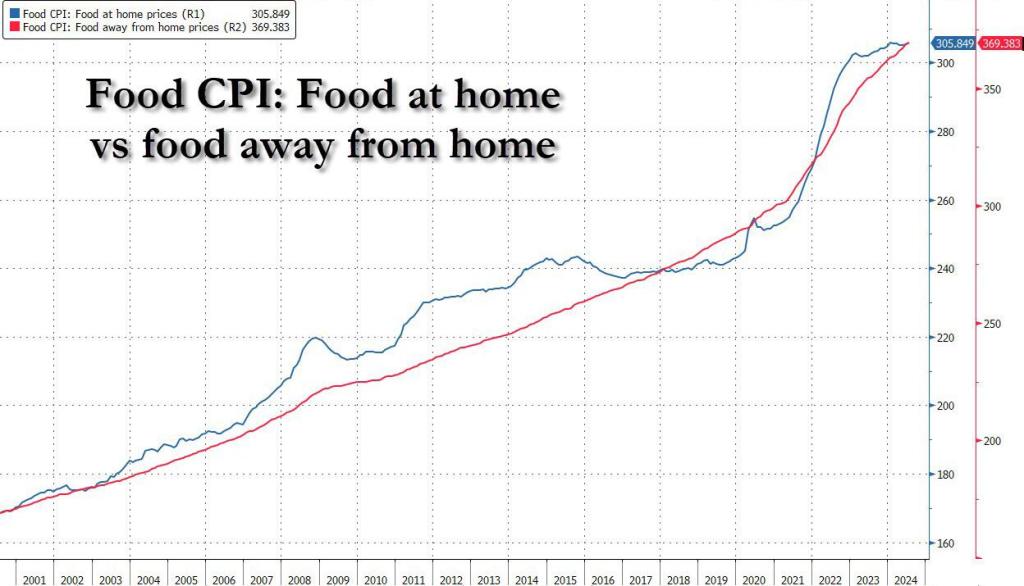
Third, while one can technically live without housing or rent, one still needs to eat. And here we find another problem, because not only did the Fed’s rate hikes not contain stock, home or rent prices, but food prices – both at home and away from home – are also at all time high! And guess what cutting rates and stimulating the economy will do to food prices from this point on…
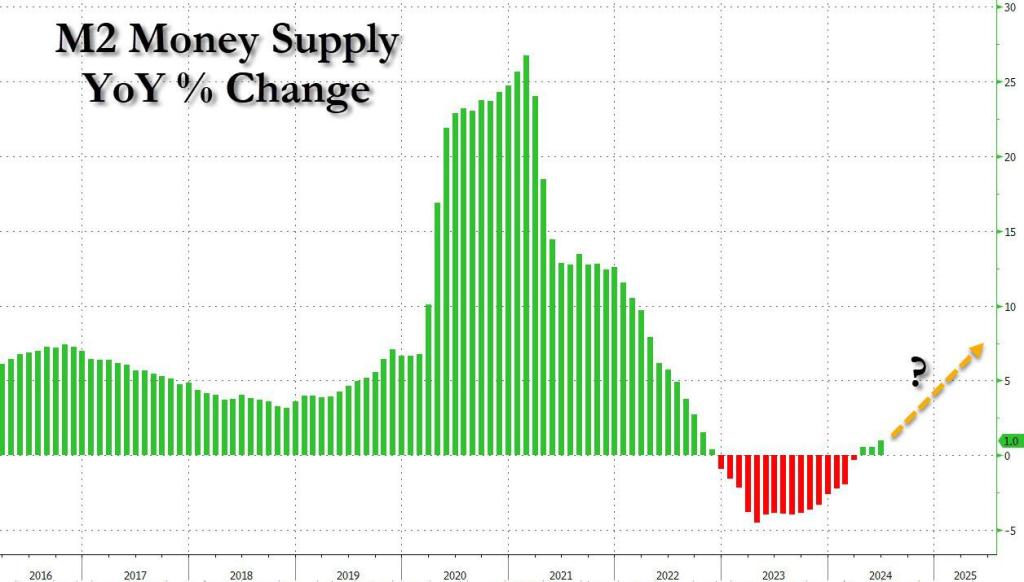
Fourth, and final, the seeds of the next inflationary bubble are already set, because even as the Fed kept conditions tight (or even exceptionally tight), M2 – the broadest money aggregate tracked by the Fed – is once again rising after declining for the past three years.
Of course, there are countless other examples, because besides the above case studies, prices are at all time highs pretty much everywhere else too. But you get the message. The only question is what can possibly go wrong with the Fed launching an easing (i.e., monetary stimulus) cycle with prices for pretty much everything, stocks and homes included, at all time highs and rising.
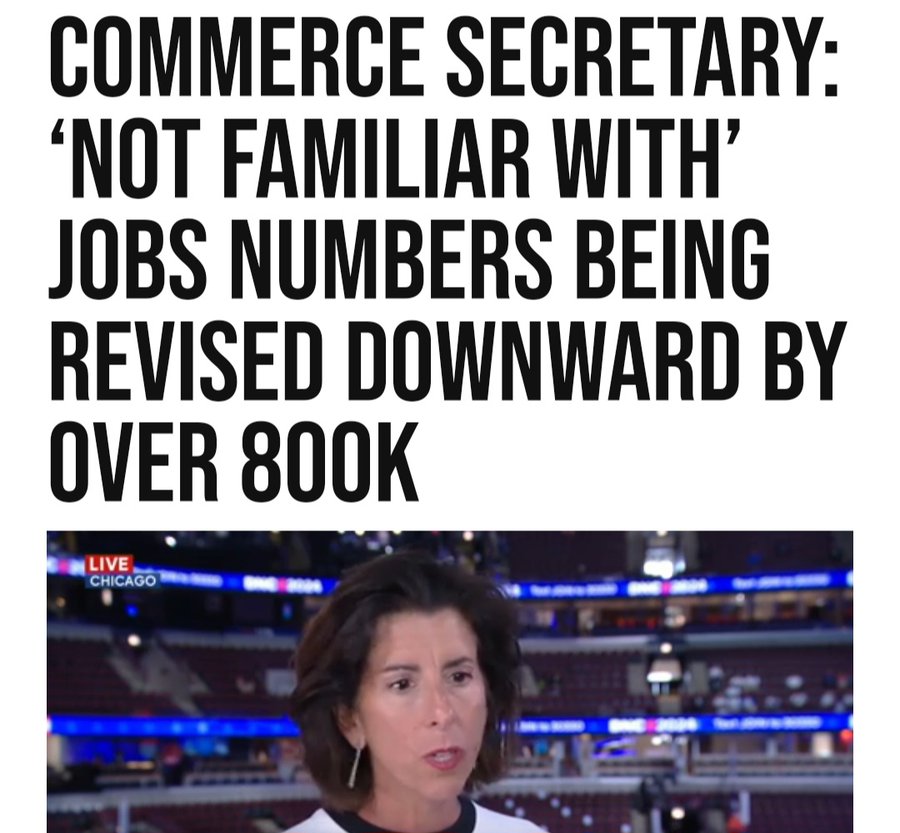
The scary thing about the BLS overstating job gains by Biden/Harris by almost 1 million jobs is that US Commerce Secretary Gina “The Goofball” Raimondo didn’t even know about the Philly Fed report.
Back in March, when most of Wall Street and economists still believed the lies spewed forth by the Biden Bureau of Labor Statistics, which intentionally uses inaccurate, rushed “data” from the Establishment survey which is meant to pad sentiment and make the economy appear far stronger than it is for propaganda purposes (as one can see by the constant monthly downward revisions), we did an in-depth analysis looking at the actual, “uncooked” numbers published by the Philadelphia Fed preview of the annual Quarterly Census of Employment and Wages employment revision, and warned our readers that actual US payrolls are overstated by at least 800,000.
Specifically, we concluded that “the BLS had overstated payrolls by 800,000 through Dec 2023 (and more if one were to extend the data series into 2024)” and added that “it’s truly statistically remarkable how every time the data error is in favor of a stronger, if fake, economy.”
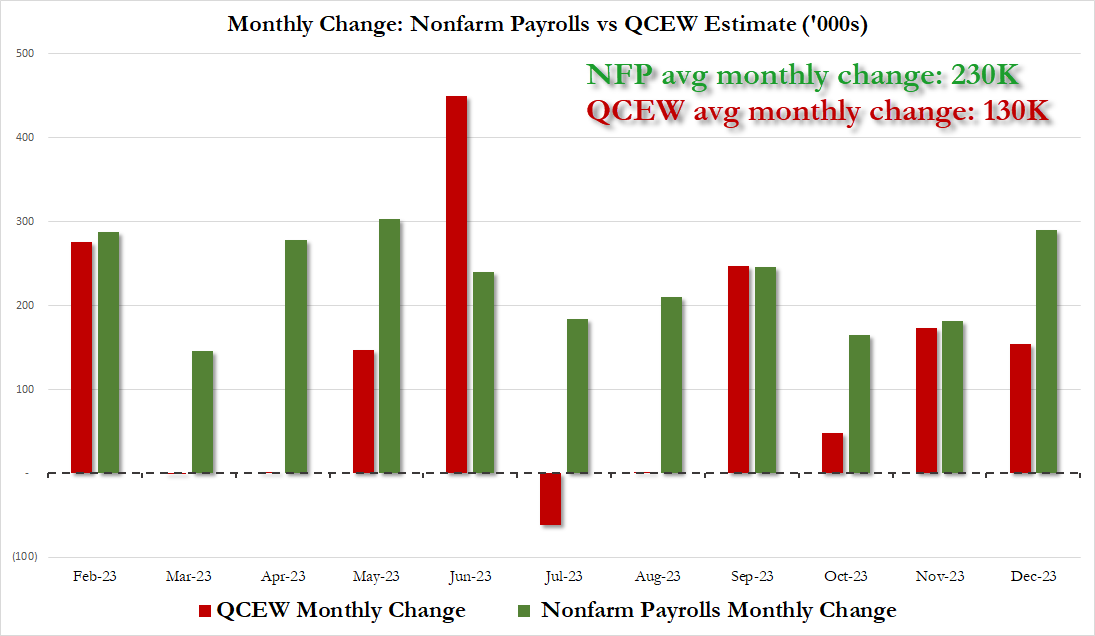
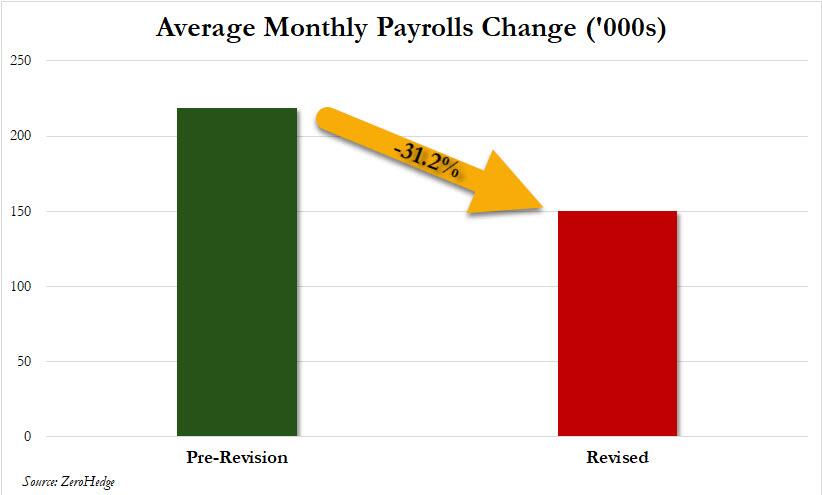
Furthermore, we also noted that the revision “also means that far from the stellar 230K average monthly increase in payrolls in 2023, which the White House would spin time and again as direct evidence of the benefits of Bidenomics, the true average monthly payroll increase in 2023 was only 130K! The full monthly change in payrolls as originally reported by the BLS (in green) and the actual monthly number, as per the QCEW (in red) is shown below.”
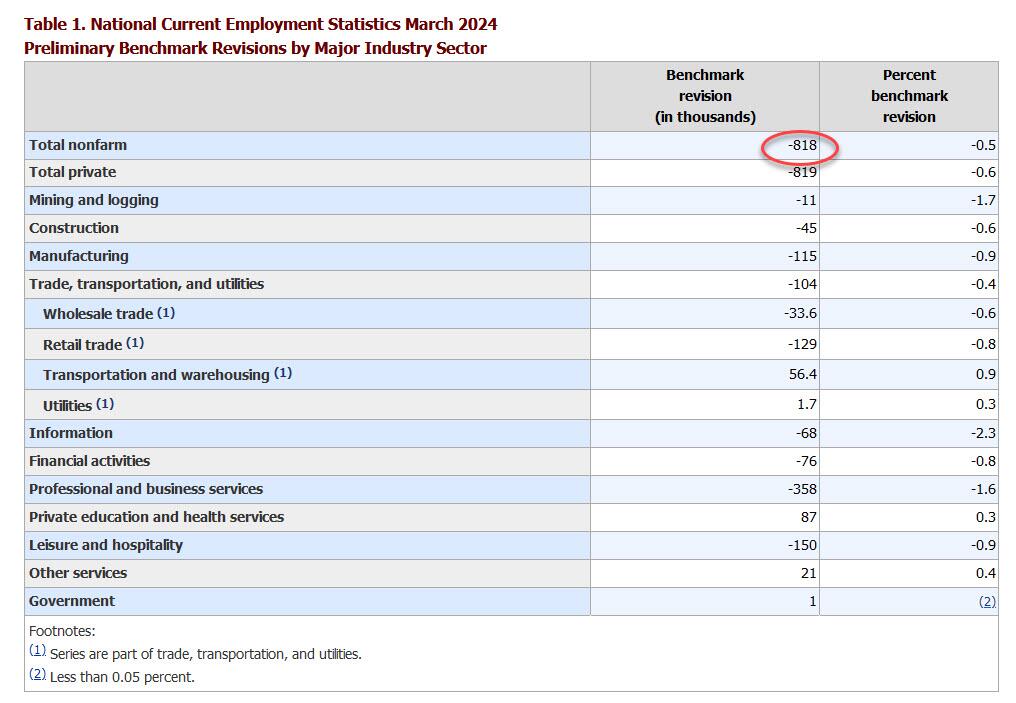
This matters because as we reminded our followers this weekend, today at 10am, the BLS would publish its annual nonfarm payrolls benchmark revision where it would unveil as , which it did (with the usual 35 minute delay because that’s the kind of service $35 trillion in debt buys you), and it confirmed that we were right almost to the dot, because as the BLS unveiled in its CES Preliminary Benchmark Announcement, “the preliminary estimate of the benchmark revision indicates an adjustment to March 2024 total nonfarm employment of -818,000 (-0.5 percent)” or just above the 800,000 was said to expect back in March.
The revision is mainly due to the highest-paying sectors: i.e., professional services -358k, leisure -150k, and manufacturing -115k. Not at all surprising: government was revised +1,000.
As an aside, while the data were scheduled to be released at 10 a.m. in Washington but didn’t appear on the BLS’s website for more than a half hour later. A spokesperson for the agency didn’t answer Bloomberg’s questions as to why the figures were delayed, but we have some pretty good guesses about the panic that gripped the BLS as they realized they needed a green lights from the propaganda ministry before going live with this number.
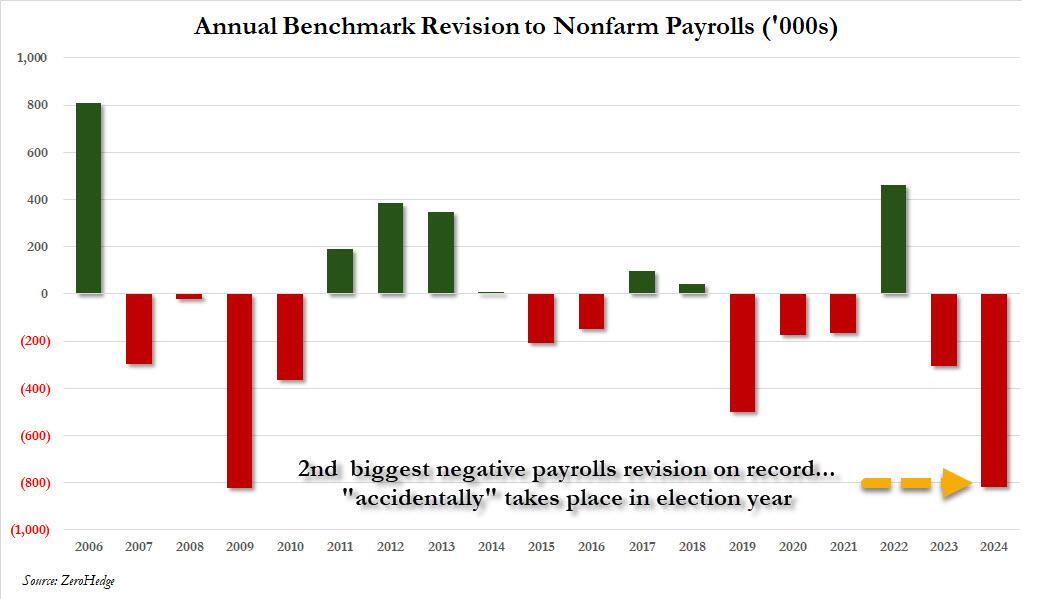
How big is the 818,000 revision in context? As the chart below shows, the 2024 revision was the biggest in the past decade, and the second biggest on record, with just the 824K downward revision in 2009 just (barely) greater.
The revisions confirm that – as we had been warning for much of the past year – the labor market started moderating much sooner than flawed conventional wisdom thought. It wasn’t until earlier this month that markets and economists grew concerned with the release of the July jobs report. That set off alarm bells with a weak pace of hiring and a fourth month of rising unemployment, but other metrics like jobless claims and vacancies have suggested a more moderate slowdown.
Putting it all together, we now know – as we reported first back in March – that the labor market is, and was, far weaker than conventionally believed. In fact, no less than 800,000 payrolls would end up “missing” when one uses the far more accurate Quarterly Census of Employment and Wages data rather than the BLS’ woefully inaccurate and politically mandated payrolls “data”, and if one looks back the the monthly gains across most of 2023, one gets not 218K jobs added on average every month but rather 150K, a 31% decline. Needless to say, the market would look very different if it had known that effectively all the payroll “beats” of the past year would be deleted!
Of course, none of that paints Bidenomics, or Kamalanomics, or whatever it is now, in a flattering picture, because while one can at least pretend that issuing $1 trillion in debt every 100 days to add 3 million jos per year is somewhat acceptable, learning that that ridiculous amount buys 800,000 jobs less is hardly the endorsement that the White House needs. On the flip side, pretending that the US had added an additional 800,000 jobs in the past year is precisely what Biden, and now, Kamala would have wanted to generate the kind of buzz and momentum that somehow translates into the “greatest economy ever”… at least until it is all revised away as the admin’s lies finally wash away.
What is the implication for the market? Well, as UBS trader Leo He correctly notes, “the Fed is well aware of nonfarm payrolls (establishment survey) overstating the job market, but unemployment rate (household survey) underestimating the job market” and he goes on to quote Governor Bowman’s speech on Tuesday:
“There are also risks that the labor market has not been as strong as the payroll data have been indicating, and it appears that the recent rise in unemployment may be exaggerating the degree of cooling in labor markets. The Q4 Quarterly Census of Employment and Wages (QCEW) report suggests that job gains have been consistently overstated in the establishment survey since March of last year, while the household survey unemployment data have become less accurate as response rates have appreciably declined since the pandemic. The rise in the unemployment rate this year largely reflects weaker hiring, as job searchers entering the labor force are taking longer to find work, and layoffs remain low. It is also likely that some temporary factors contributed to the soft July employment report. The rise in the unemployment rate in July was largely accounted for by workers who are experiencing a temporary layoff and are more likely to be rehired in coming months. Hurricane Beryl also likely contributed to weaker job gains, as the number of workers not working due to bad weather increased significantly last month.”
At the end of the day, all this does is cement the Fed’s 25bps rate cut next month.
As for broader socio-political implications, the reactions are already pouring in with those on the blue side of the spectrum pretending nothing happened, while those on the other side of the aisle raging at what has now become clear propaganda by the highly politicized Department of Labor. To wit, here is RFK, Jr., proposed VP candidate Nicole Shanahan slamming the BLS, and using our data to do so:
The Bureau of Labor Statistics (BLS) has long been used as a tool of propaganda by the executive branch. Here’s how: they distort definitions, manipulate data, exclude discouraged workers, and revise past reports to create narratives that fit the agenda of whichever administration is in power. This skews the actual economic picture and misleads citizens about the true state of our economy. It’s like a game of musical chairs, and neither side wants to be caught standing when the music stops. The Constitution doesn’t grant the government the authority to track unemployment statistics, so why do we even have this agency? Perhaps it’s time to get rid of it. Their $750M budget could surely be put to better use, and private companies already track U.S. unemployment for free. Win-win.
We agree: back in March we concluded our article, which predicted today’s revision with near 100% accuracy, by warning that the staggering size of the revised data “is also why nobody in the mainstream media – which is now nothing more than the PR smokescreen for the Biden puppetmasters, the government and the deep state – will ever mention this report.”
Today it will be more difficult for the propaganda press to ignore it.
At least she should speak in front of a Communist Chinese flag! Her true master.
After watching the Democrat hate fest last night (Aka, the Democrat National Convention), I was not shocked that the DNC platform looked like a playbook to destroy the US economy. High taxes, endless spending, more regulations, etc. Not a word about the staggering side of the US debt load … with Harris’ economic plan projected to add a whopping $25 trillon in debt to the already massive $35+ trillion debt load.
And not a mention that US interest payments on the national debt already exceeds defense spending. And is booming!
Of course, Harris’s economic vision is a continutation of Biden’s disastrous visions (which are Obama’s vision of US obliteration). Most politicians in Congress are millionaires (including Bernie Sanders) and won’t suffer from their insane “progressive” policies. Watching last night’s DNC hatefest was like watching nasty 2nd graders having a party.
Of course, the drove of anti-American, anti-properity speakers spewing venom (I hate Hillary’s flat-tone speaking style) like Hillary, Jaime Raskin (aka, Rasputin), AOC, etc. all failed to acknowledge to acknowledge the already monstrous size of the US debt ($35+ trillion) or the massive size of the unfunded promises ($218+ TRILLION). Of course not.
The handle the staggering interest payments that will crowd out other spending, The Federal Reserve will be forced to lower rates.
Of course, Democrats will wheel out “economists” like Robert Reich who say that the debt doesn’t matter.


You must be logged in to post a comment.