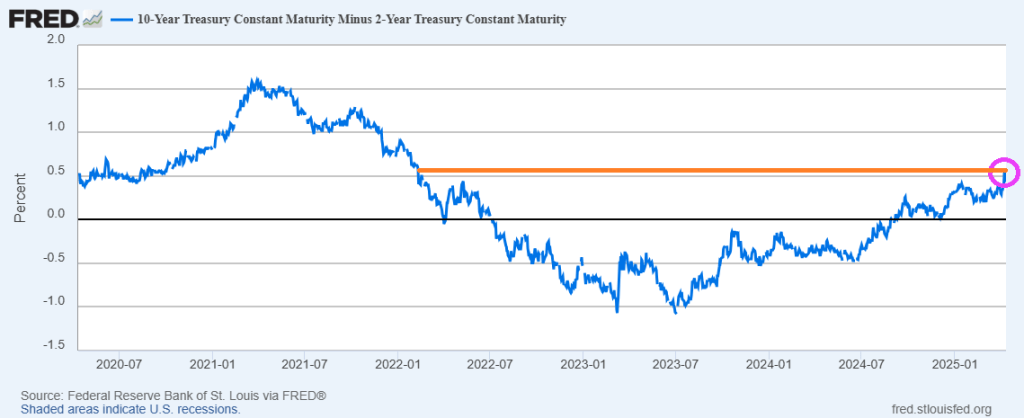
The good news? The US Treasury 10Y-2Y yield curve is normalizing to January 2022 levels.
One the mortgage side, adjustable rate mortgage (ARM) share is the highest since the financial crisis (2008).
As Trump continues to stand up for Americans and China (and Democrats) continues to fight, the S&P 500 index lags MSCI World index by most since 1993 (The Clintons).
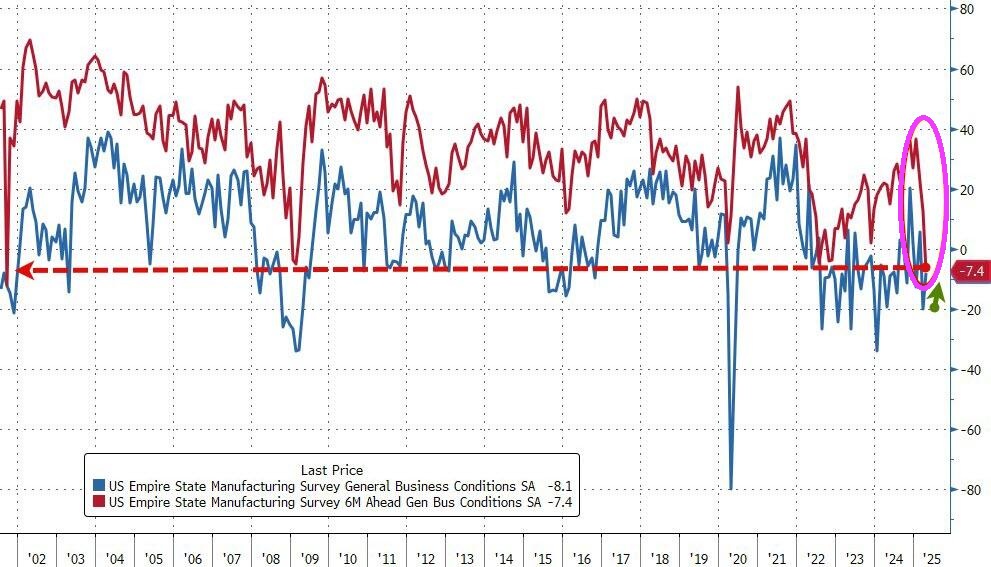
Despite the slump in ‘soft’ survey data, analysts expected Empire Fed Manufacturing to bounce back from March’s tumble to one year lows and they were right with the headline index rising from -20.0 to -8.1 (considerably better than the -13.5), but still negative. However, while current conditions jumped, expectations plunged to the lowest since 9/11/.
Obama/Biden/Harris/Schumer/Pelosi have let the US be the punks for China. Trump is simply trying to level the playing field and China’s Xie doesn’t like the new equilibrium.
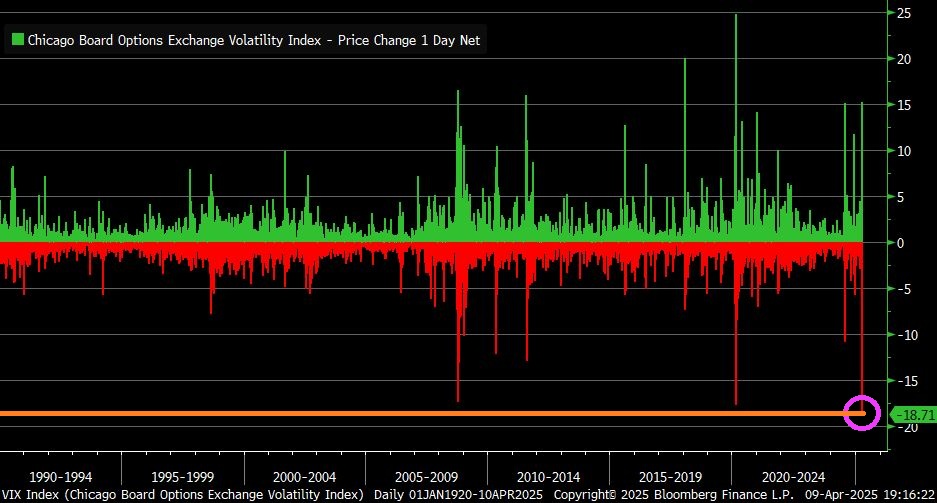
VIX Index fell by 18.7 points yesterday … largest one-day decline in history.
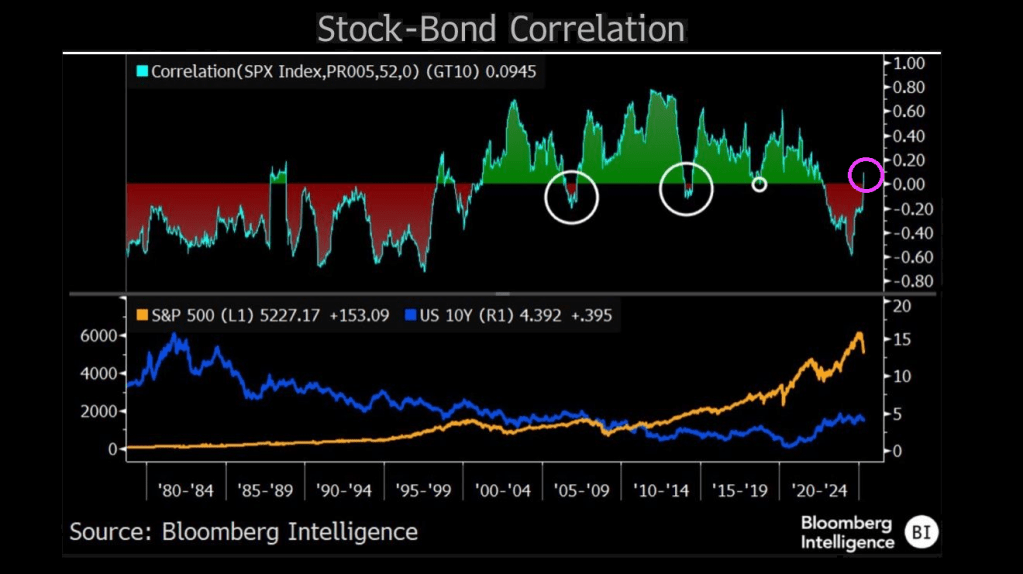
The correlation between stock prices and bond yields has returned to positive territory — hinting at a period of distress in equities and a regime shift in equity and bond markets where recession fears, rather than inflation, may be starting to drive direction of both. The correlation between the two asset classes was positive for the better part of 20 years prior to the pandemic, suggesting equities trended in the direction of yields as inflation mostly coincided with growth. Stocks held a negative correlation to yields throughout most of the 1980s and 1990s, when inflation hurt stocks — and that phenomenon returned for the 2022-24 bear market and recovery period.
Notably, major stock corrections occurred each time the correlation jumped out of its primary regime.
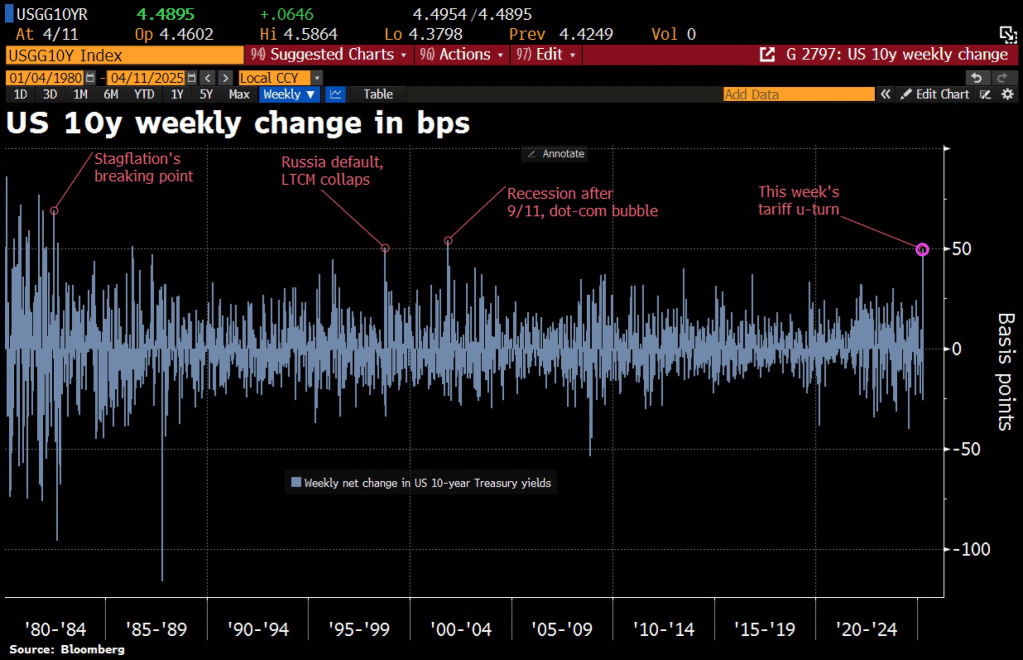
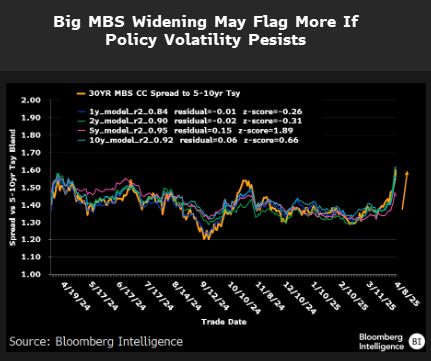
Thunderstruck! The tariff kerfuffle between the Trump Administration and China is causing turbulence in the Treasury market. The 10-year Treasury rate is soaring with China’s counterpunching.
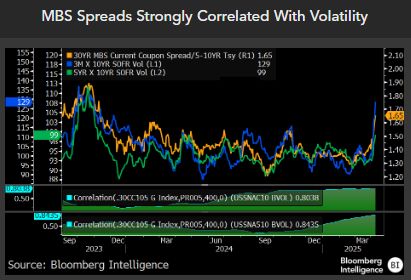
MBS spreads are widening.
Along with volatility.
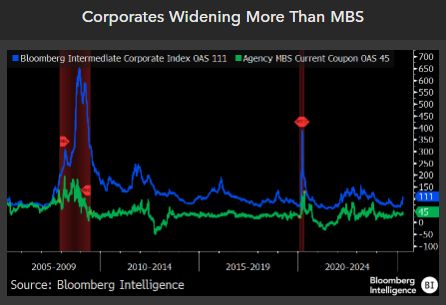
But corporate spreads are widening more than MBS spreads.
The 10Y-2Y yield curve has risen to the highest level since the early days of “China Joe” Biden.
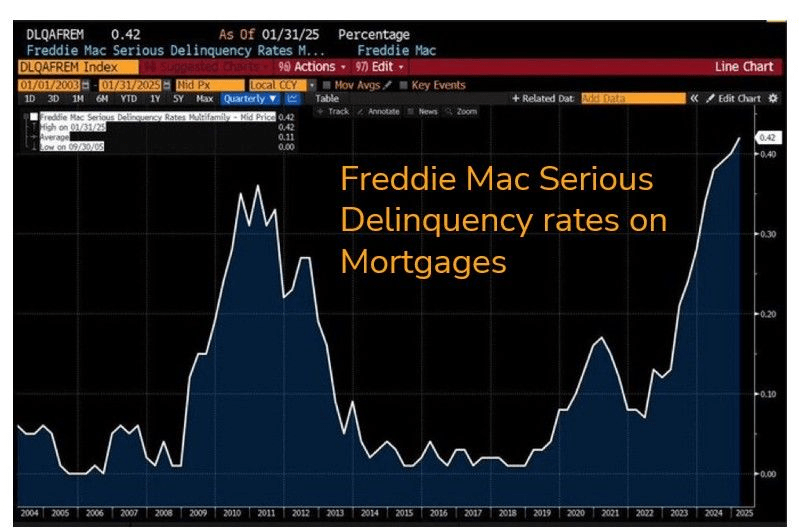
On a related note, Freddie Mac serious delinquency rates on mortgages is now the highest since the financial crisis.
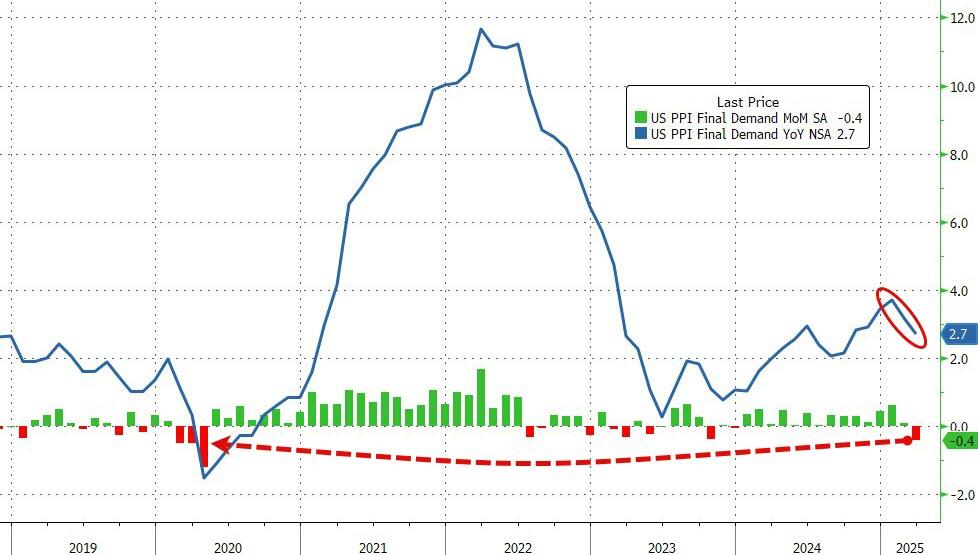
Headline PPI fell (yes fell) 0.4% MoM (dramatically cooler than the 0.2% MoM rise expected), dragging the headline index down to +2.7% YoY.
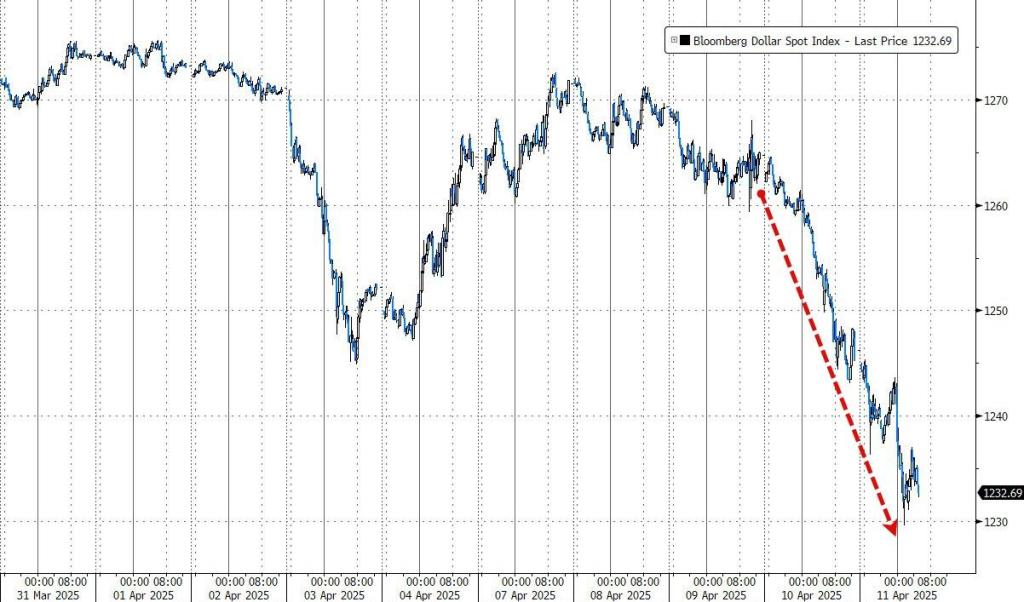
The market is re-assessing the structural attractiveness of the dollar as the world’s global reserve currency and is undergoing a process of rapid de-dollarization.
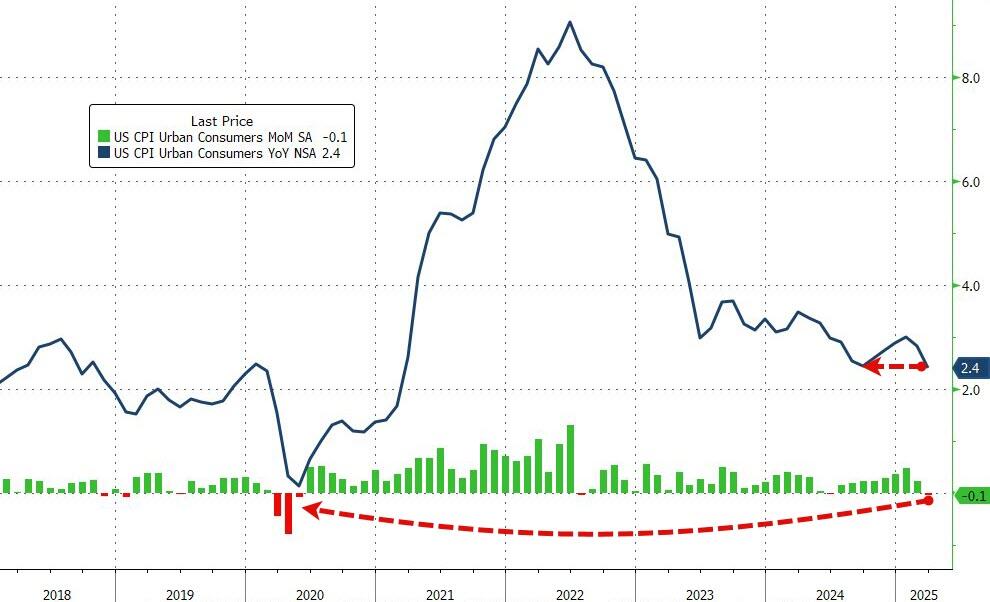
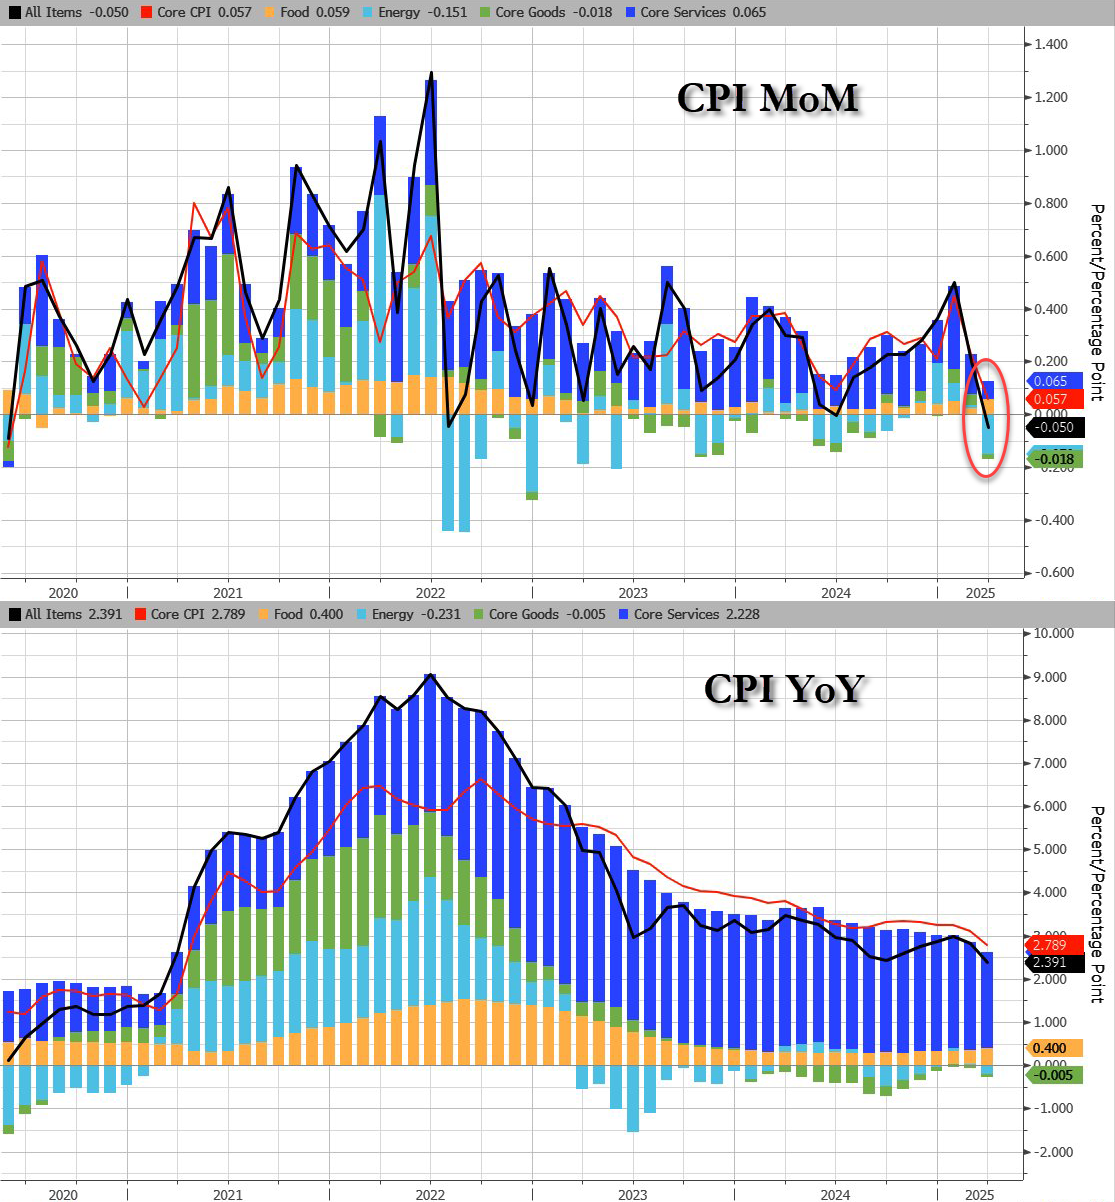
Having dipped lower in the previous month (following a few straight months of re-acceleration), expectations were for both headline and core measures to continue trending lower on a YoY basis… and they were.
Headline CPI FELL 0.1% MoM (vs +0.1% exp), which dragged the YoY CPI to +2.4%, matching the September lows…
Source: Bloomberg
That is the weakest MoM print since May 2020.
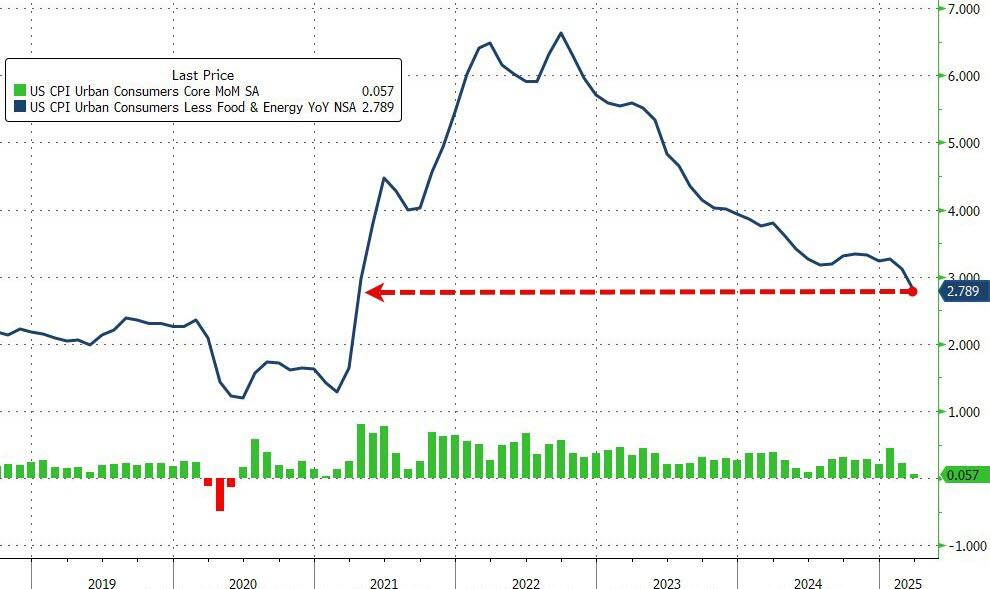
Core CPI also printed cooler than expected (+0.1% MoM vs +0.3% MoM exp), pulling the YoY print down t0 +2.8% YoY – the lowest since March 2021…
Source: Bloomberg
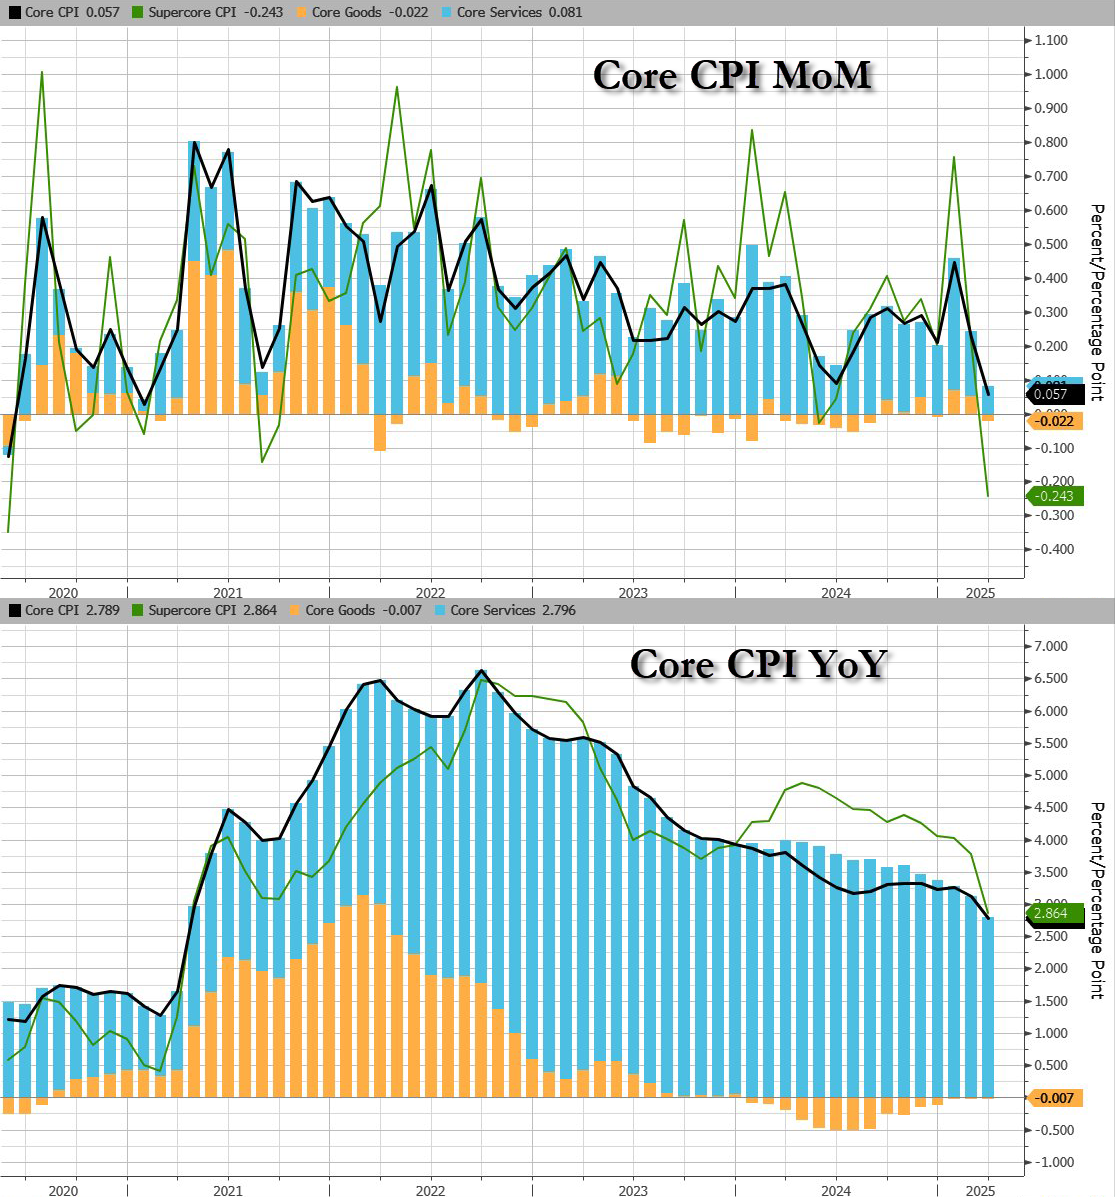
Services inflation tumbled…
Source: Bloomberg
CPI breakdown:
Headline:
CPI decreased 0.1% after rising 0.2% in February, and below the +0.1% estimate. Over the last 12 months, CPI rose 2.4%, below the 2.5% estimate.
Energy CPI fell 2.4% in March, as a 6.3% decline in the index for gasoline more than offset increases in the indexes for electricity and natural gas.
Food CPI rose 0.4% in March as the food at home index increased 0.5% and the food away from home index rose 0.4 percent over the month.
Core CPI:
The index for all items less food and energy rose 0.1% in March, following a 0.2% increase in February.
Indexes that increased over the month include personal care, medical care, education, apparel, and new vehicles.
The indexes for airline fares, motor vehicle insurance, used cars and trucks, and recreation were among the major indexes that decreased in March.
Core CPI details (MoM increase):
The shelter index increased 0.2% over the month.
The index for owners’ equivalent rent rose 0.% in March and the index for rent increased 0.3%.
The lodging away from home index fell 3.5 percent in March.
The personal care index rose 1.0%in March.
The index for education rose 0.4% over the month, as did the index for apparel.
The new vehicles index also increased over the month, rising 0.1%.
The index for airline fares fell 5.3% in March, after declining 4.0% in February.
The indexes for motor vehicle insurance, used cars and trucks, and recreation also fell over the month.
The household furnishings and operations index was unchanged in March.
The medical care index increased 0.2% over the month.
The index for hospital services increased 1.1% in March and the index for physicians’ services rose 0.3% over the month. In contrast, the prescription drugs index fell 2.0% in March.
Core CPI details (YoY increase):
The index for all items less food and energy rose 2.8 percent over the past 12 months.
The shelter index increased 4.0 percent over the last year, the smallest 12-month increase since November 2021.
Other indexes with notable increases over the last year include motor vehicle insurance (+7.5 percent), medical care (+2.6 percent), recreation (+1.9 percent), and education (+3.9 percent).
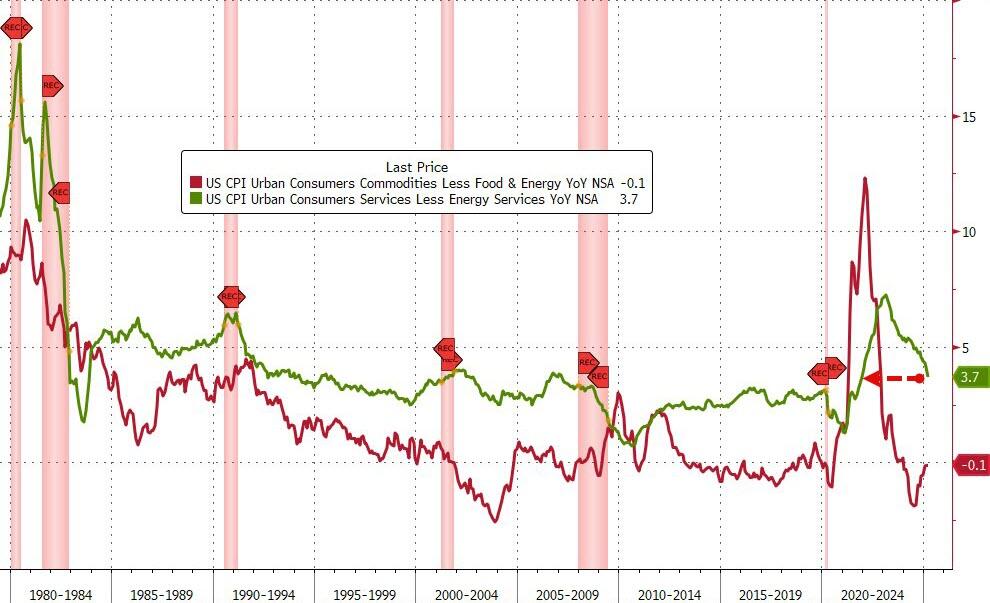
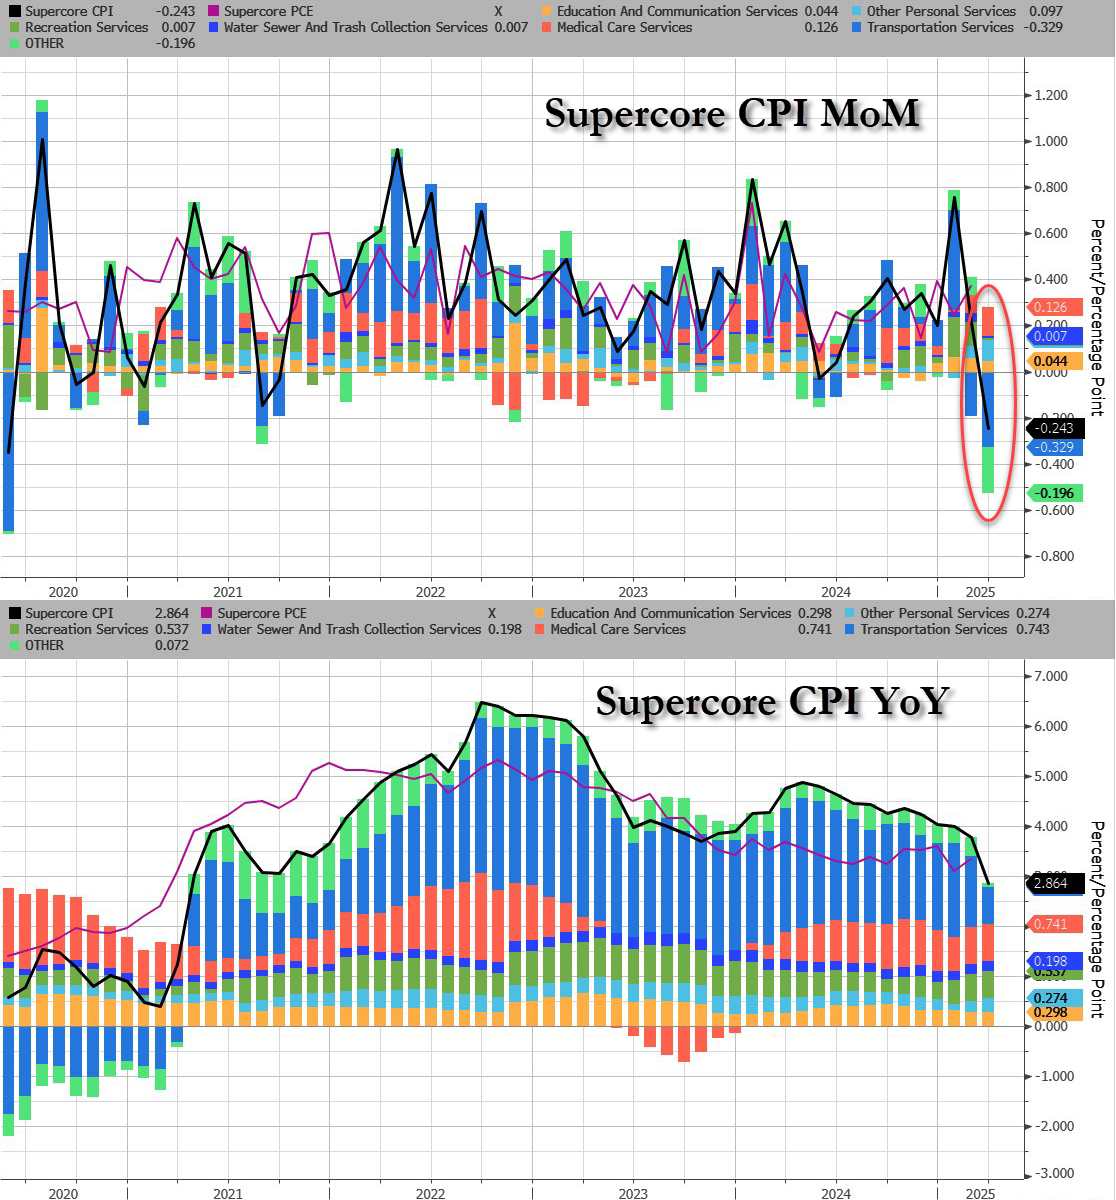
While goods inflation is flat (zero-ish), services cost inflation is fading fast…
Source: Bloomberg
Shelter and Rent inflation is slowing fast:
Shelter inflation +0.3% MoM, +3.99% YoY, down from 4.25% in February (lowest since Nov 2021)
Rent inflation +0.3% MoM, +3.99% YoY, down from 4.09% in February (lowest since Jan 2022)
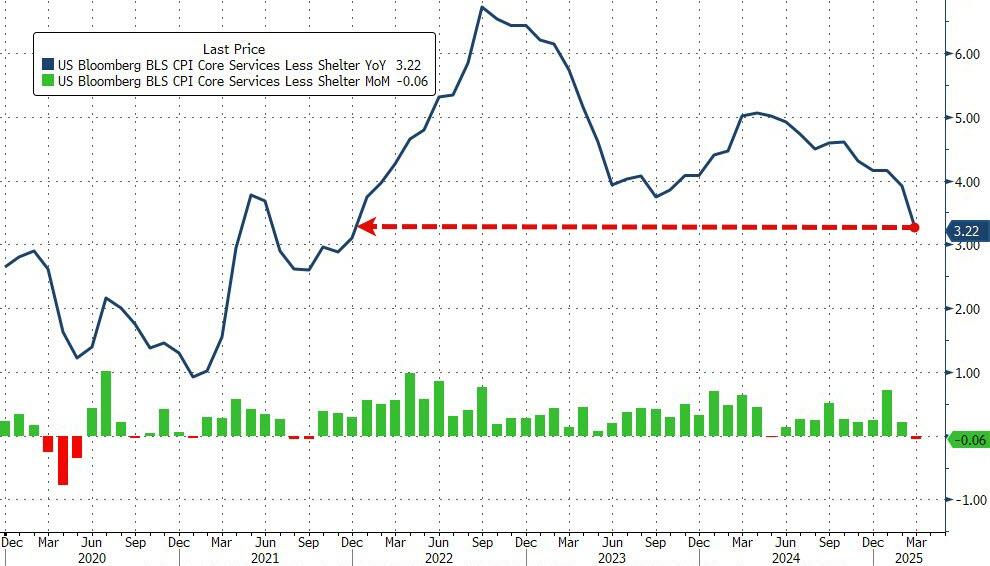
The so-called SuperCore CPI – Services Ex-Shelter – dropped 0.1% MoM dragging it down to +3.22% YoY – the lowest since Dec 2021…
Source: Bloomberg
Source: Bloomberg
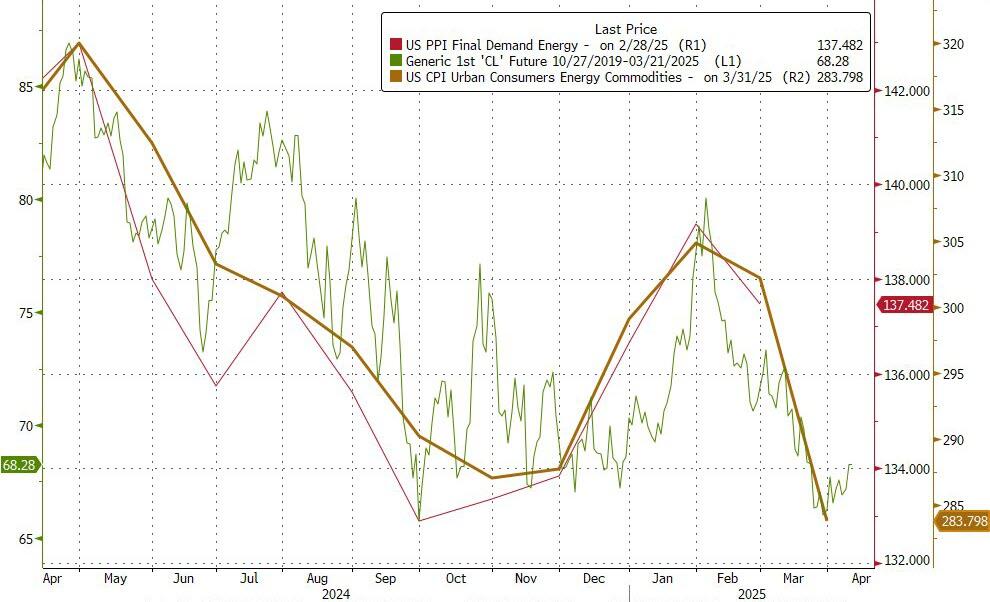
Drill Baby Drill (and tariffs recession fears) have dragged energy prices lower and pulled CPI lower with it…
Soothe me? As we move further away from Sleepy Joe’s horrid economic policies, we should see an improvement in GDP from the current Atlanta Fed GDP Now Q1 Forecast of -2.8%.
The alternative model forecast, which adjusts for imports and exports of gold as described here, is -0.5 percent. After recent releases from the US Census Bureau and the US Bureau of Economic Analysis, the nowcast of the contribution of net exports to first-quarter real GDP growth declined from -3.95 percentage points to -4.79 percentage points in the standard model and from -1.92 percentage points to -2.53 percentage points in the alternative model.
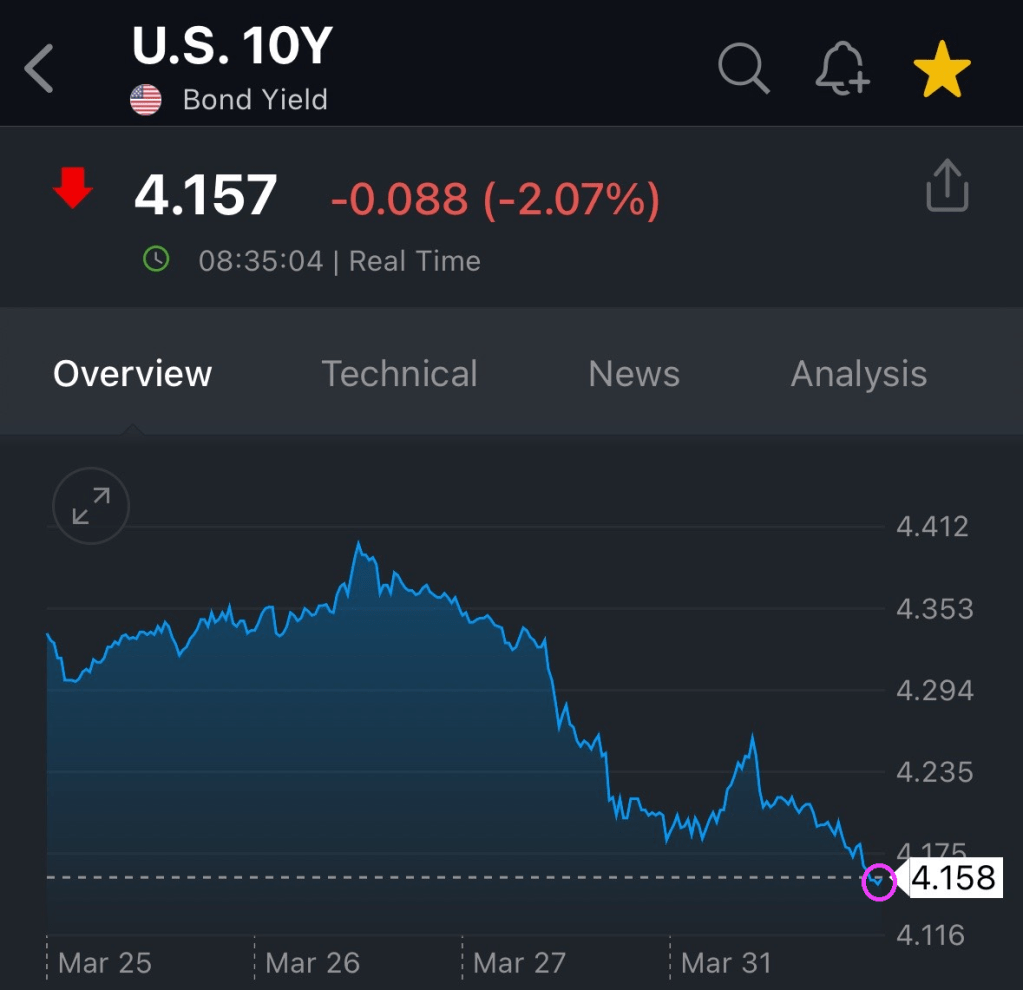
The US Treasury 10Y yield has fallen to 4.157% as recession fears mount.
Freddie Mac Serious Delinquency Rate on Multifamily (Apartment) loans soared to highest rate since 2000. Since it is as of January 31, 2025, you can’t blame this on Donald Trump (although I am sure they will try).
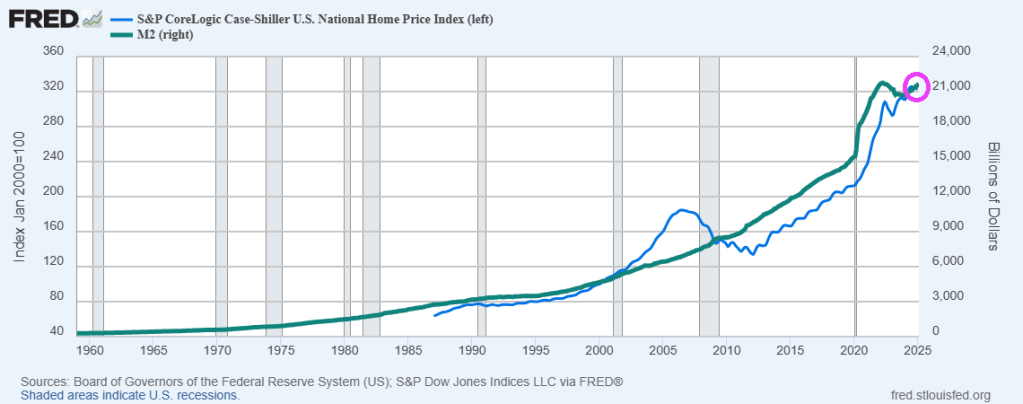
Of course, home prices and rents soared under Biden. Home prices rose 37% under Biden and rents rose 25%. Simply unaffordable.


You must be logged in to post a comment.