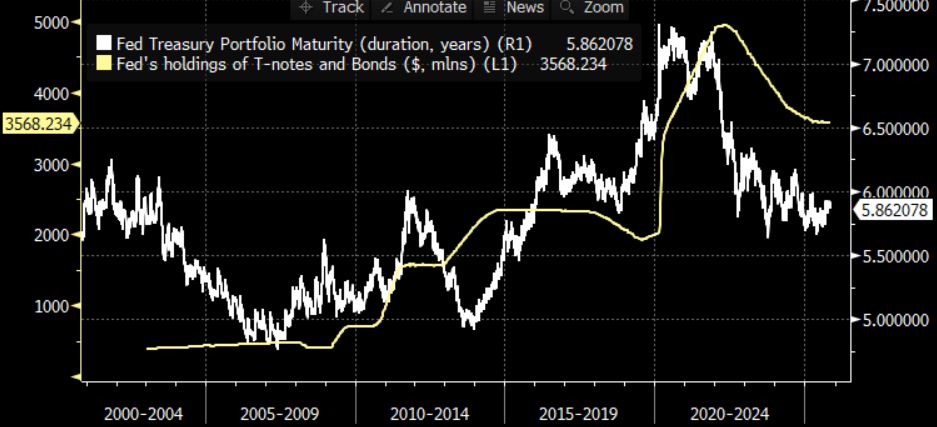
Like tuna surprise (bleech!!), Fed Chair Powell announced a move towards reinvesting maturing MBS into ST Treasury bill decreasing the duration of The Fed’s balance sheet.
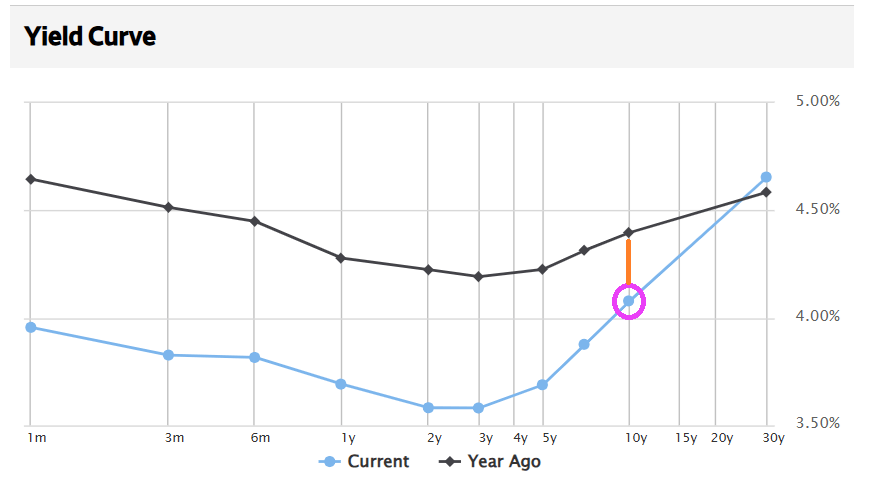
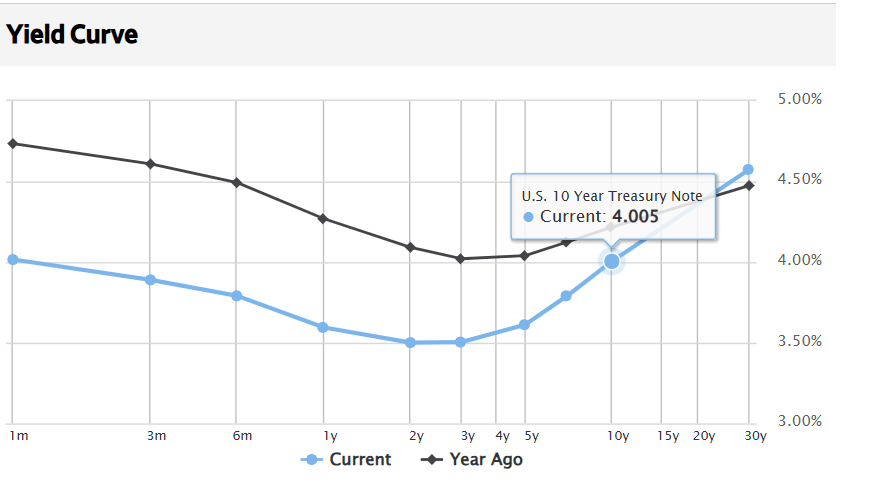
Fed’s QT Surprise: Powell announced that maturing mortgage-backed securities (MBSs) will be reinvested into short-term Treasury bills instead of longer-duration Treasuries, signaling a shift toward a shorter-duration balance sheet. 🧭 Strategic Implications: This move distances the Fed from potential “yield curve control” strategies and aligns with pre-2008 norms, where the average maturity was under 3 years—suggesting a long-term pivot in portfolio structure. 💰 Market Impact: The decision, coupled with rising Treasury yields and upcoming refunding announcements, intensifies pressure on the 10-year yield, especially as the Treasury seeks to fund a $38 trillion debt load with more short-term instruments.
I just hope the Nittany Kittens (Penn State) don’t surprise Ohio State in today’s football game!
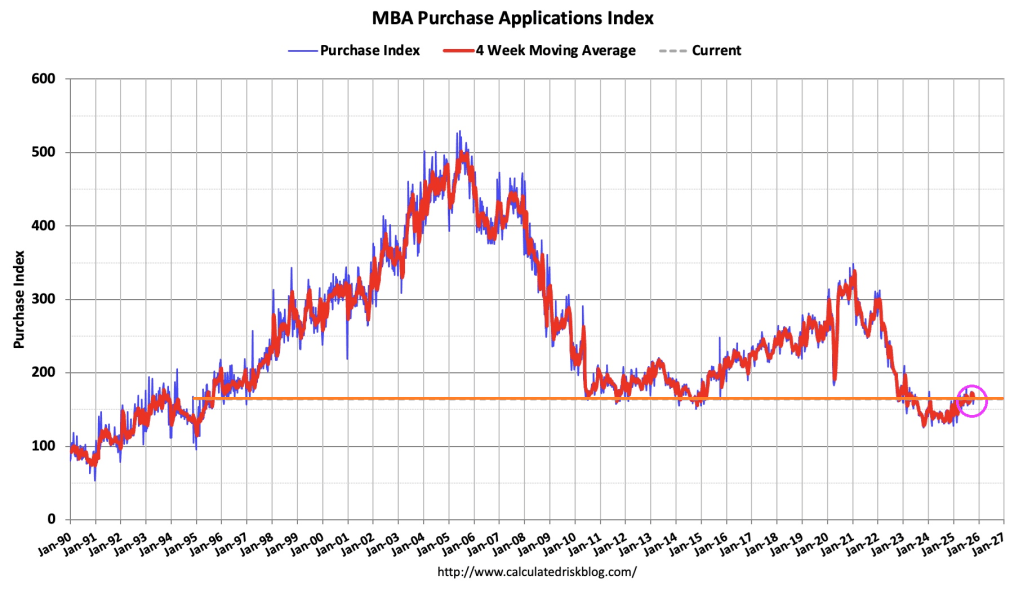
Mortgage applications increased 7.1 percent from one week earlier, according to data from the Mortgage Bankers Association’s (MBA) Weekly Mortgage Applications Survey for the week ending October 24, 2025.
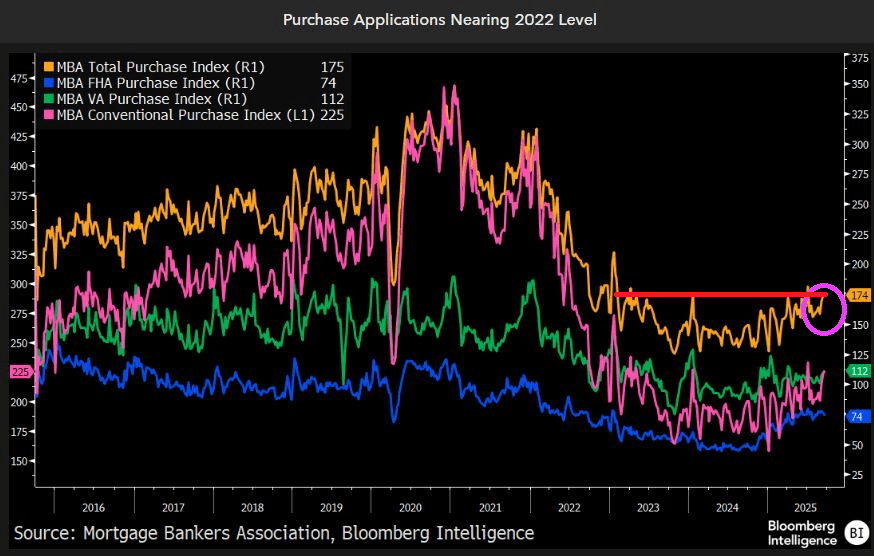
The Market Composite Index, a measure of mortgage loan application volume, increased 7.1 percent on a seasonally adjusted basis from one week earlier. On an unadjusted basis, the Index increased 7 percent compared with the previous week. The seasonally adjusted Purchase Index increased 5 percent from one week earlier. The unadjusted Purchase Index increased 4 percent compared with the previous week and was 20 percent higher than the same week one year ago.
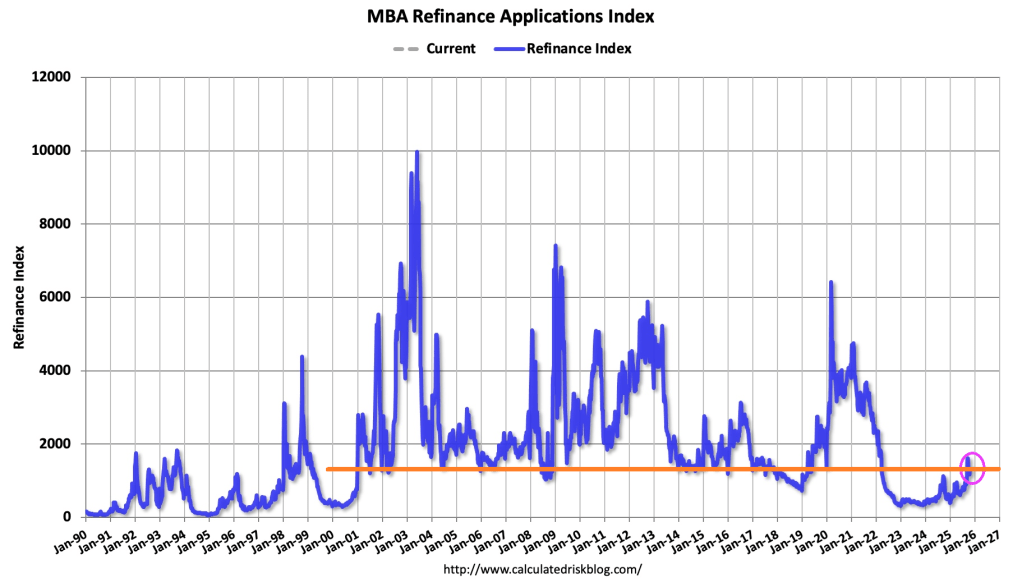
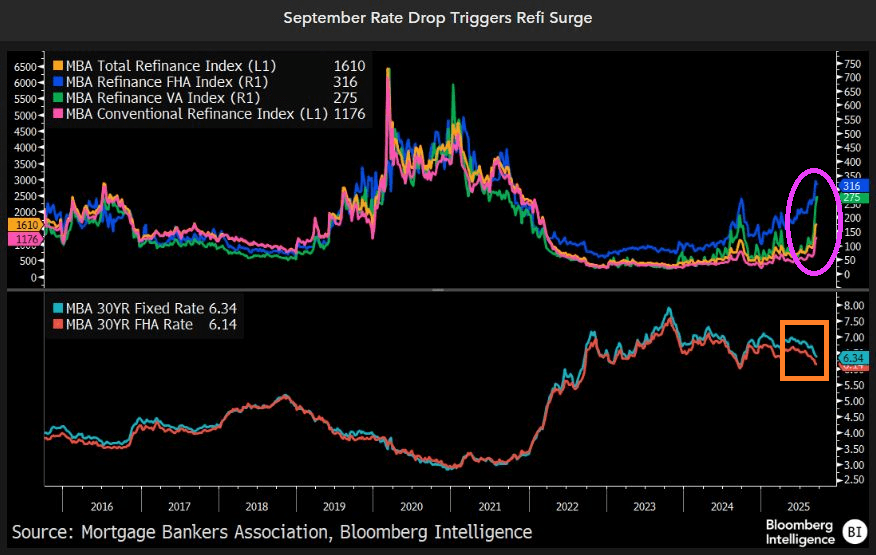
The Refinance Index increased 9 percent from the previous week and was 111 percent higher than the same week one year ago.
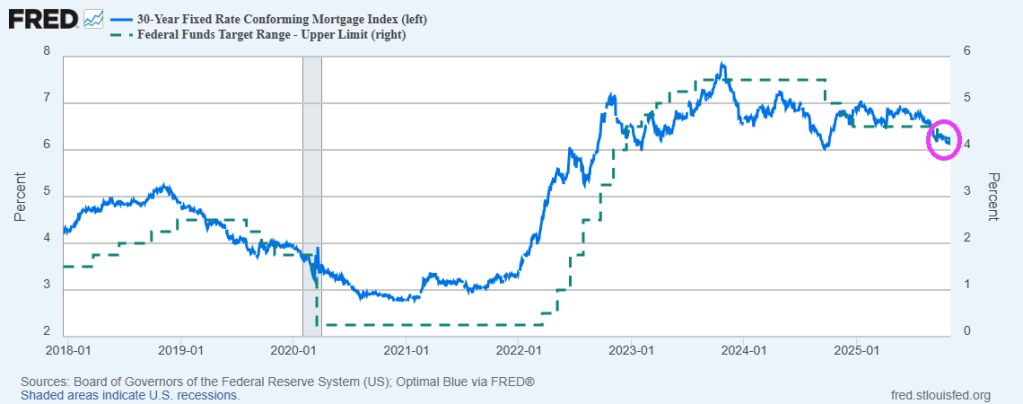
The average contract interest rate for 30-year fixed-rate mortgages with conforming loan balances ($806,500 or less) decreased to 6.30 percent from 6.37 percent, with points decreasing to 0.58 from 0.59 (including the origination fee) for 80 percent loan-to-value ratio (LTV) loans.
Yesterday, The Fed lowered their target rate by 25 basis points. And the 30-year conforming rate index fell by 0.037 basis points to 6.155%.
On the government shutdown side, USDA applications fell more than 26 percent.
Fed Chair Jerome Powell at The Federal Reserve Building in Washington DC.
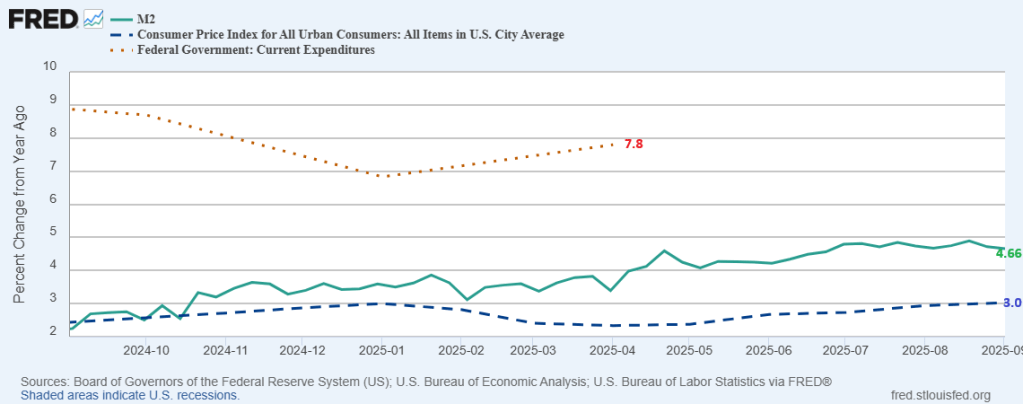
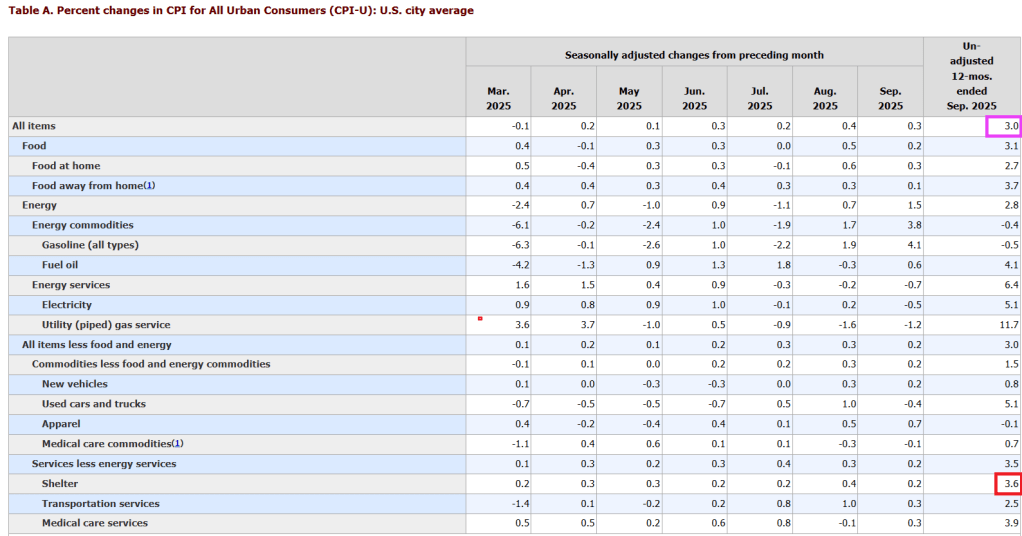
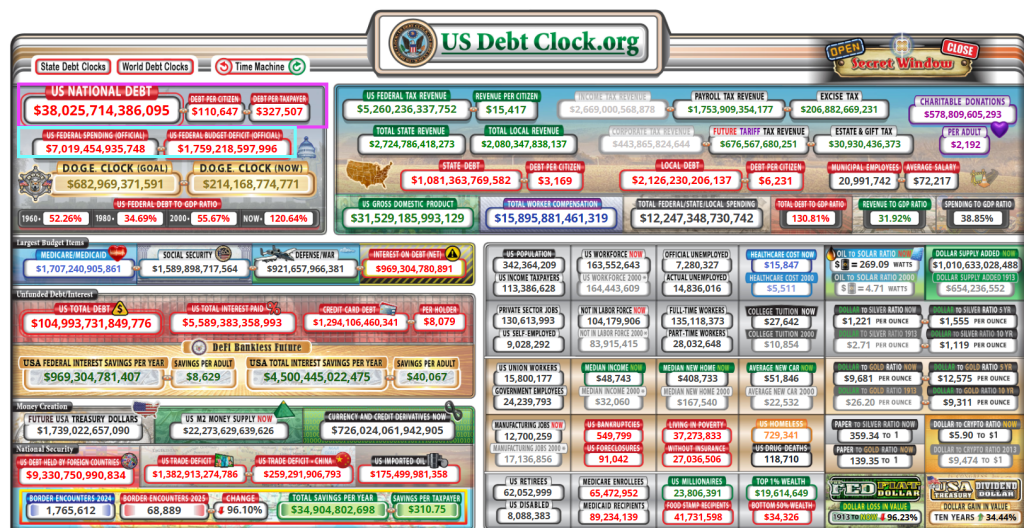
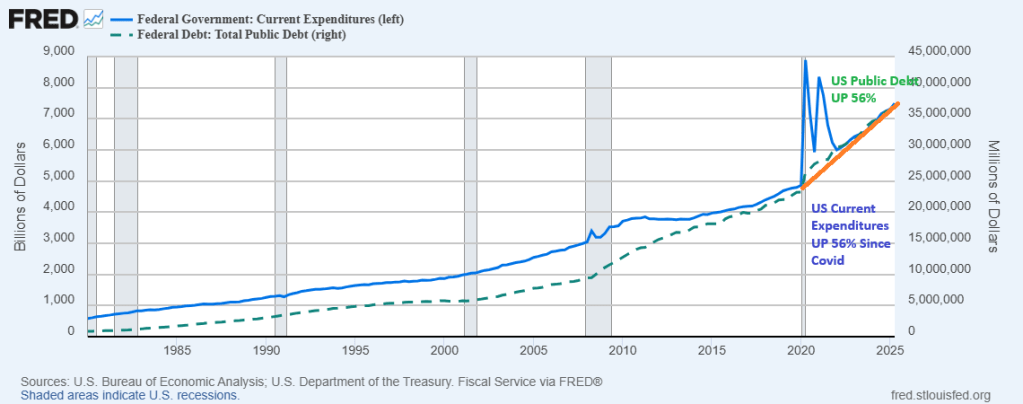
Of course, CPI data release has been delayed thanks to the US Federal government shutdown (aka, the Schumer Shutdown). But never fear, the Federal government is continuing to spending like the proverbial drunken sailors in port. The Federal debt just breached the $38 trillion mark.
And the Federal budget deficit just breached the $7 trillion mark. Why? Too much Federal spending! The Federal government COULD raises taxes, but that would strangle the economy. But politicians in DC are terrified of not being re-elected, so they are terrified of cutting spending.
The September drop in mortgage rates is sparking the biggest boom in refinancings since the pandemic. Mortgage-refinancing applications have surged above the decade average, despite that period including the record-breaking refi boom of 2020-21 when rates fell to all-time lows. Purchase-loan demand has also rebounded to its best for this time of year since 2022, yet remains well below pre-pandemic levels.
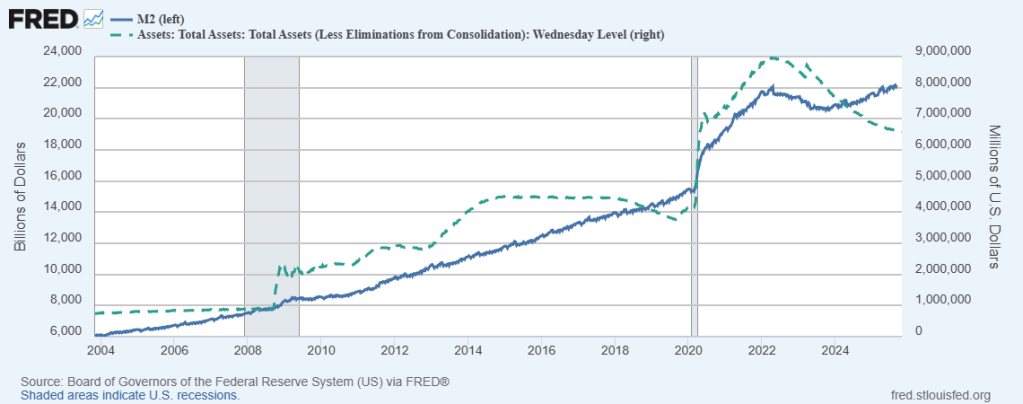
Can we ask the US House and Senate if they will ever return US Federal government spending to pre-Covid levels? Both US Federal government spending and public debt are up 56% since the Covid outbreak in 2020.
The answer is no. Politicians thrive on Federal spending.


You must be logged in to post a comment.