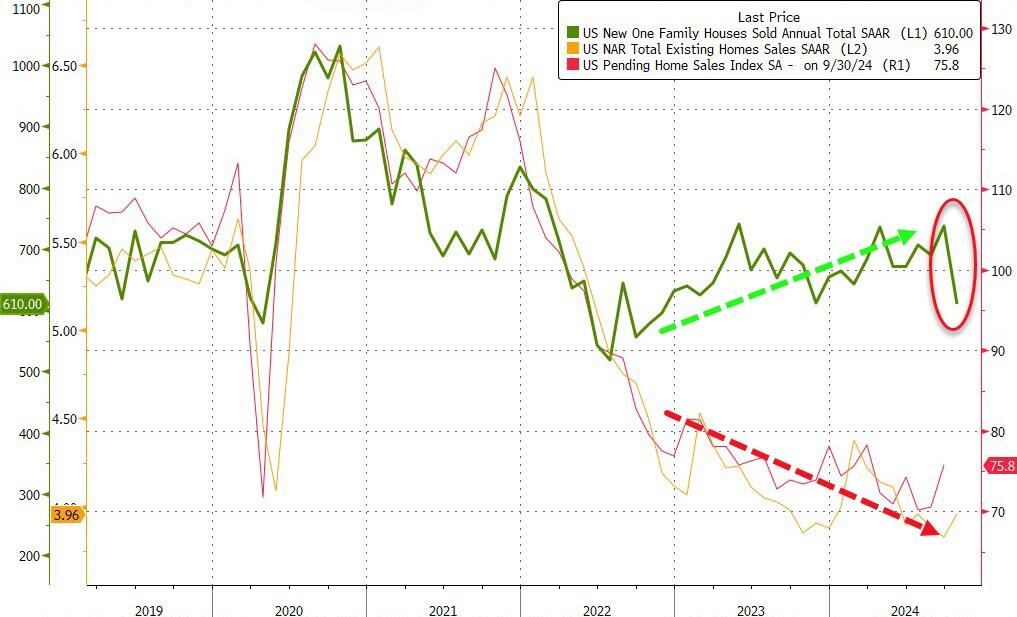
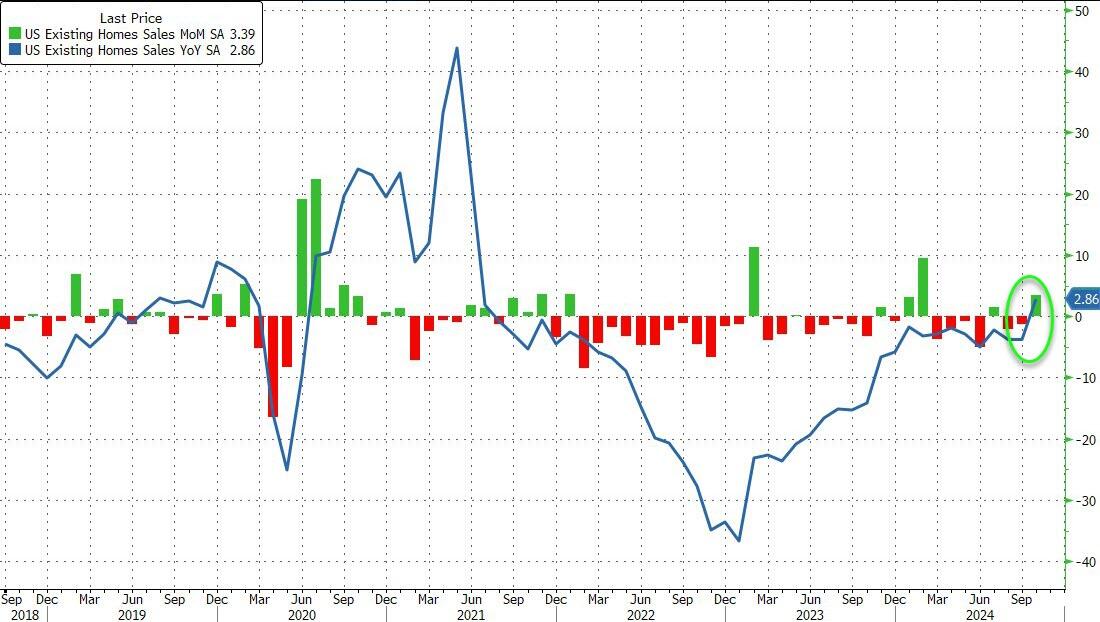
Existing-home sales have finally started to improve on a seasonally adjusted basis after a three-year decline.
Cause? Raging home prices combined with higher than normal mortgage rates. Home prices are up 35.4% under Biden while conforming 30Y mortgage rates are up 148%.
Mortgage applications decreased 21.9 percent from two weeks earlier, according to data from the Mortgage Bankers Association’s (MBA) Weekly Mortgage Applications Survey for the week ending December 27, 2024. The results include an adjustment to account for the Christmas holiday.
The Market Composite Index, a measure of mortgage loan application volume, decreased 21.9 percent on a seasonally adjusted basis from two weeks earlier. On an unadjusted basis, the Index decreased 55 percent compared with two weeks ago. The seasonally adjusted Purchase Index decreased 13 percent compared with two weeks ago. The unadjusted Purchase Index decreased 48 percent compared with two weeks ago and was 17 percent lower than the same week one year ago.
The holiday adjusted Refinance Index decreased 36 percent from two weeks ago and was 10 percent higher than the same week one year ago. The unadjusted Refinance Index decreased 62 percent from two weeks ago and was 6 percent lower than the same week one year ago.
US home prices in the 20 largest cities rose 0.32% MoM in October (the latest data from S&P CoreLogic Case-Shiller), considerably hotter than the 0.22% rise expected. However, despite the MoM beat, the pace of annual acceleration has declined to its slowest since Sept 2023. At 3.62% YoY.
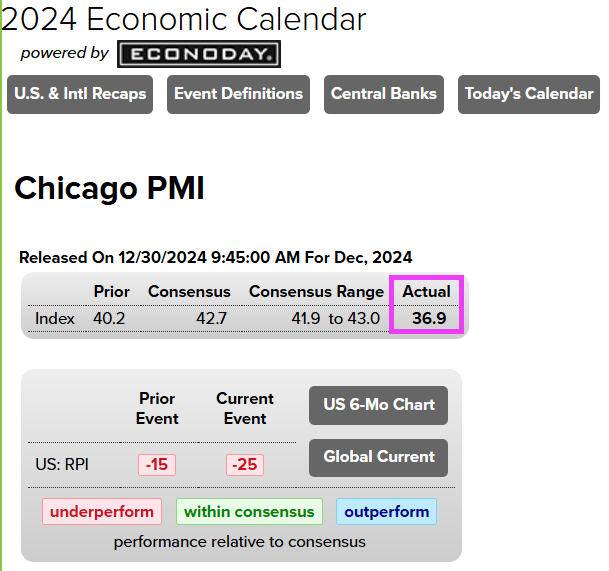
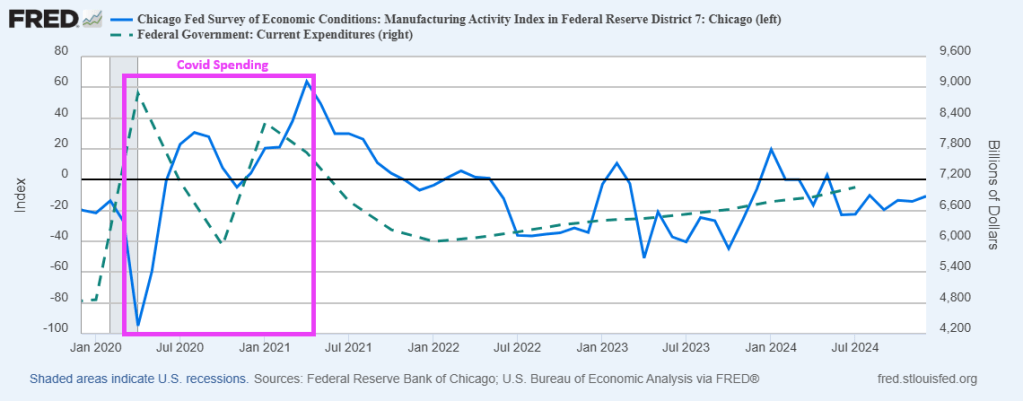
The Biden/Harris economic “miracle” was simply massive Federal spending (and borrowing) combined with hiring Federal workers. This can be seen in the following chart of Chicago Fed manufacturing index compared with Federal spending. Great times in the first months of 2021, but as Federal spending slowed, so did the manufacturing index. Last seen at -10.71 in December 2024.
Joe Biden, sold his soul for family wealth at the crossroads in Delaware.
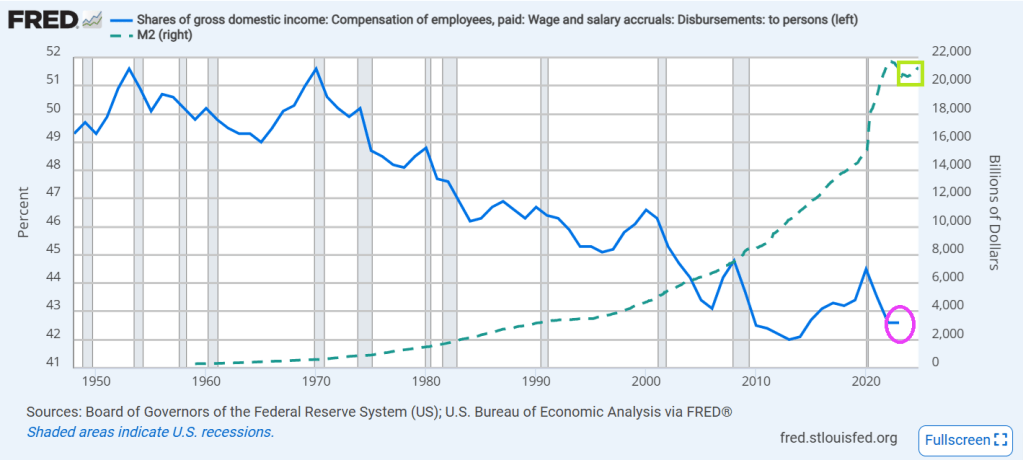
Wage and salary income as a percentage of GDP has fallen from over 50% back in 1970 to 43.1% in 2022. And look at the post Covid decline! And the increase in M2 Money.
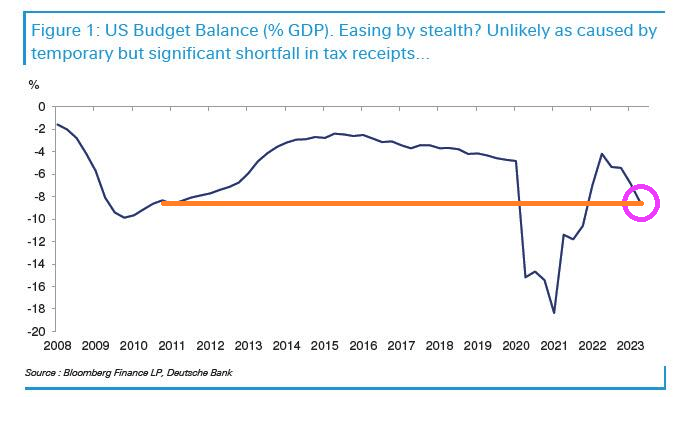
Meanwhile the US budget balance as a % of GDP has been plunging downwards in recent years.
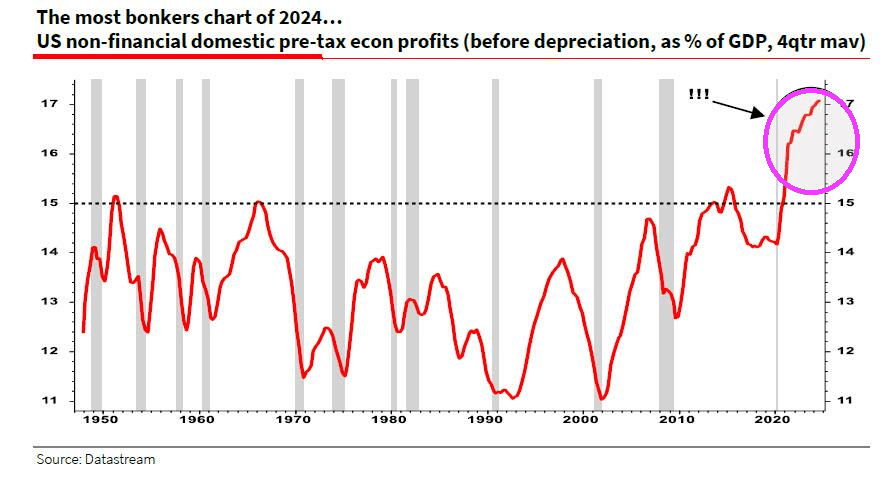
Despite the slowing economy, pre-tax profits post Covid have SOARED!
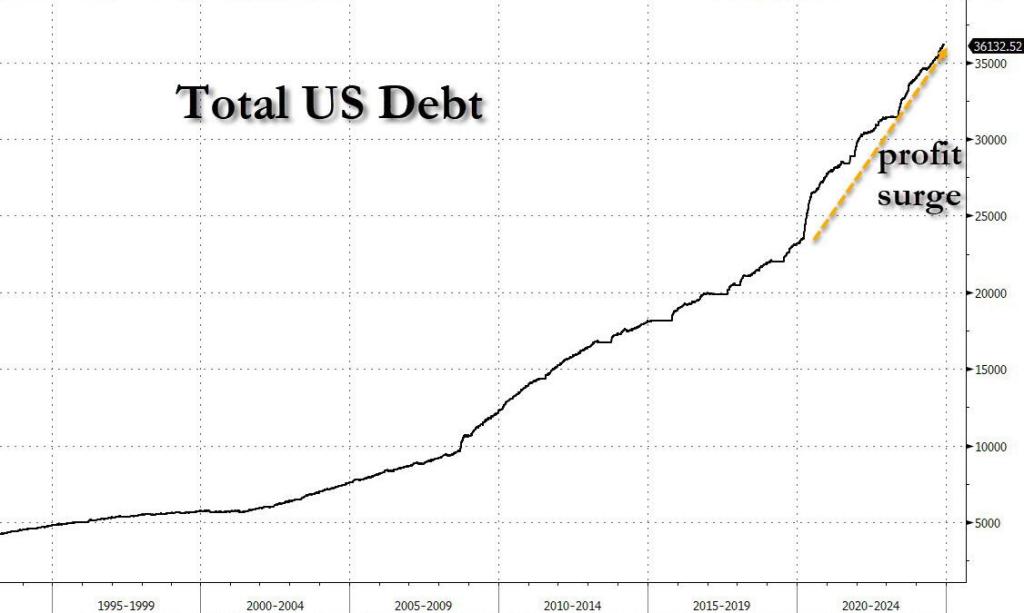
Primarily due to reckless/wasteful Federal spending and FEDERAL DEBT that soared.
There you have it! The Biden/Harris economic “miracle” was simply Federal government malspending that benefitted large corporations and few people.
Joe Biden and his woefully corrupt son Hunter of laptop fame.
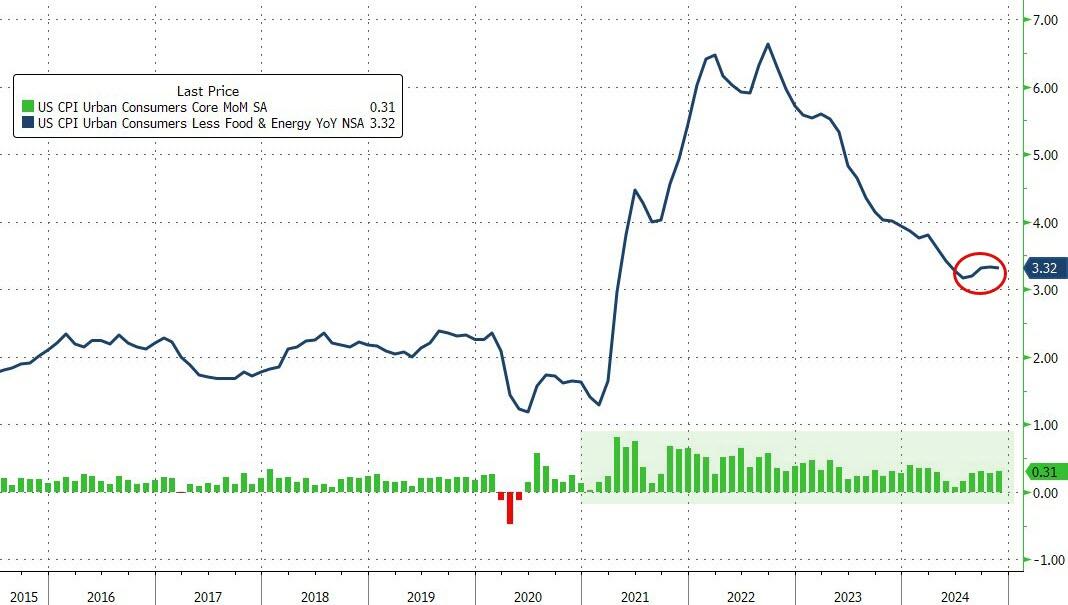
October STICKY core inflation is still up 4% YoY (year-over-year)
Core CPI rose 0.3% MoM (as expected) which pushed it up 3.3% YoY (not even close to the 2% mandate)…
Source: Bloomberg
There has not been a single monthly decrease in core consumer prices since Biden too office.
dddd
Between The Fed’s insane monetary policy and Biden/Harris insane fiscal policies, we are living in a world where Ray Bradbury’s novel Fahrenheit 451 becomes a reality. Instead of books burning, it is the US Dollar burning.
The last gasp of the Biden/Harris reign of (economic) error!
After existing home sales unexpectedly ticked up in October, analysts expected new home sales to slow after their recent resurgence (-1.8% MoM). They were right… BUT… the magnitude is mind-boggling!
New Home Sales collapsed 17.3% MoM in October. That is the largest MoM drop since July 2013.
Source: Bloomberg
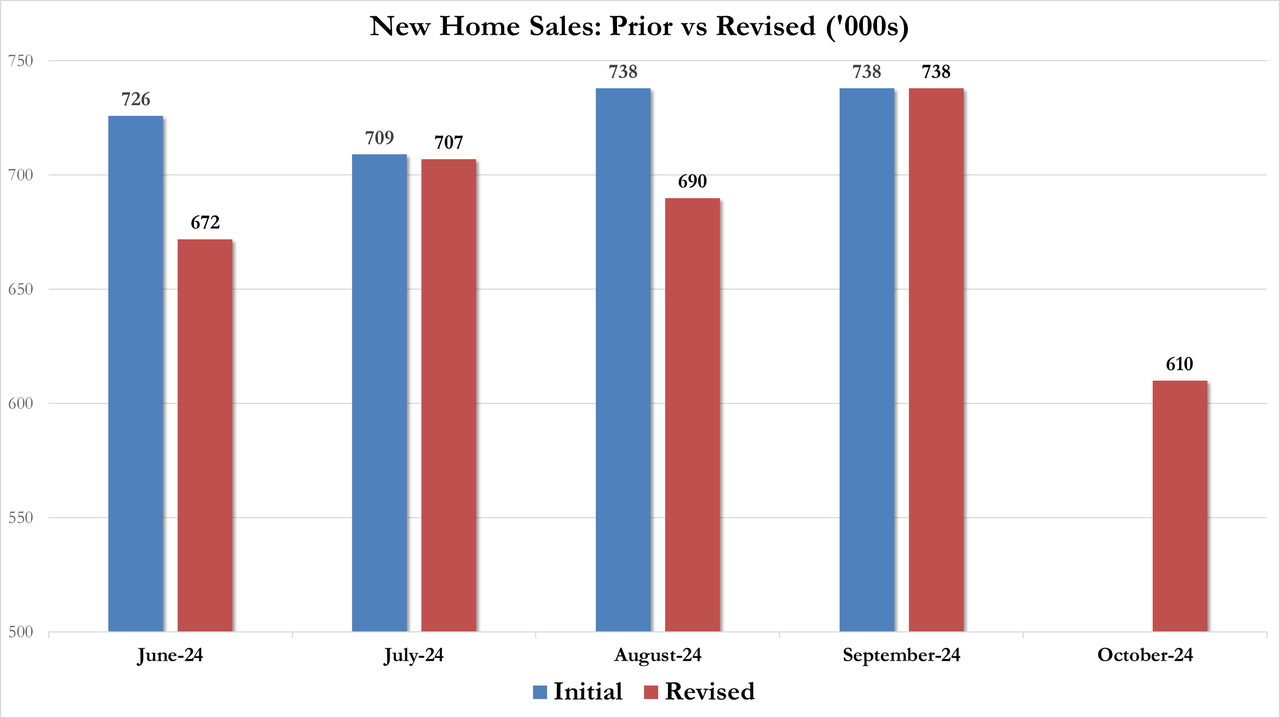
That MoM plunge dragged sales down 9.4% YoY to 610k SAAR – the lowest since Nov 2022
Source: Bloomberg
Of course, all the revisions are lower…
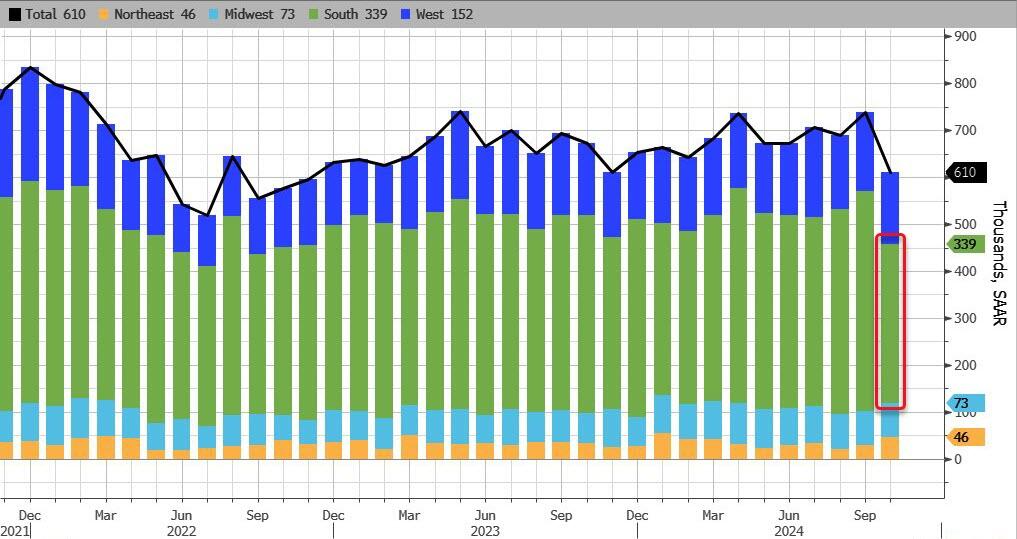
Hurricanes Helene and Milton, which tore through parts of the Southeast, delayed sales in the nation’s biggest housing region and dragged down sales overall.
Sales in the South decreased 28% to 339,000, the slowest pace since April 2020. Sales also fell in the West, but rose in the Northeast and the Midwest.
Source: Bloomberg
Finally, we note that the median sale price of a new home increased to $437,300 in October, the highest in 14 months.
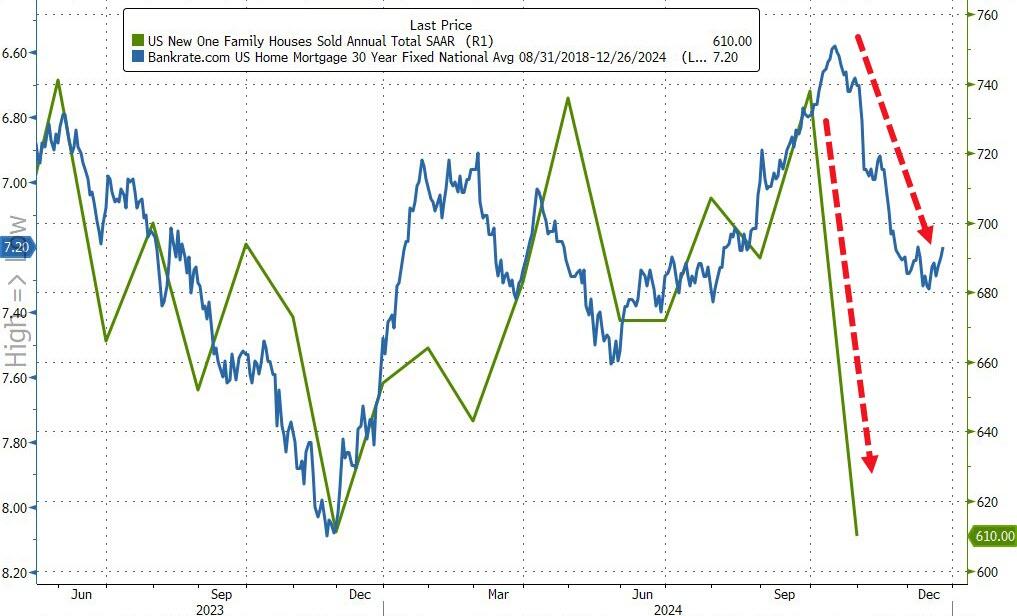
Does this mean November’s data will see a massive surge in new home sales? …even as rates have increased significantly?
Longer-term inflation jumped to their highest since June 2008, according to the latest UMich Sentiment survey, while short-term inflation expectations dropped to four year lows…
Housing sentiment (buying conditions for housing) remains depressed under Biden/Harris “Reign of (economic) error.”
Here is a picture depicting the assassination of the US housing market.
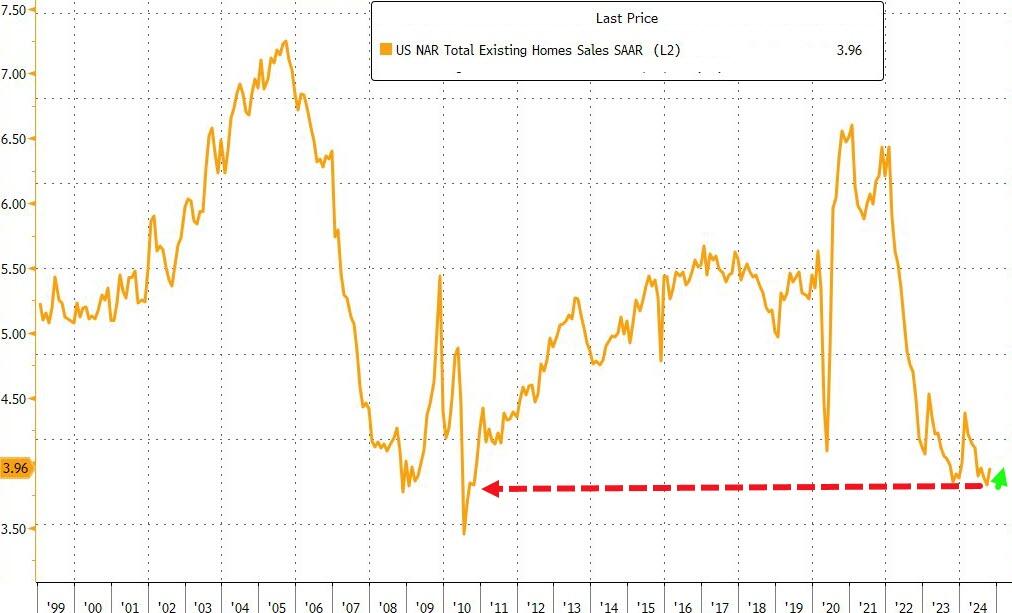
…but in context, that shift up to 3.96mm SAAR homes sold is nothing…
Source: Bloomberg
High borrowing costs have led to a shortage of previously owned homes on the market, discouraging many would-be home sellers from listing their properties for sale and having to part with their current low financing costs.
“Additional job gains and continued economic growth appear assured, resulting in growing housing demand,” NAR Chief Economist Lawrence Yun said in a prepared statement.
“While mortgage rates remain elevated, they are expected to stabilize.”
Last month, the inventory of available homes edged up 0.7% to 1.37 million, continuing to trend higher although well below pre-pandemic levels.
Despite the weakness in sales, tight inventory is keeping prices elevated, yielding one of the least affordable housing markets on record. The median sale price last month increased 4% from a year earlier to $407,200, the highest ever for any October, the NAR figures show.
Contract signings rose in all four US regions, led by a 6.7% jump in the Midwest.
Sales of single-family homes increased 3.5% in October; purchases of condominiums and co-ops were up 2.7%
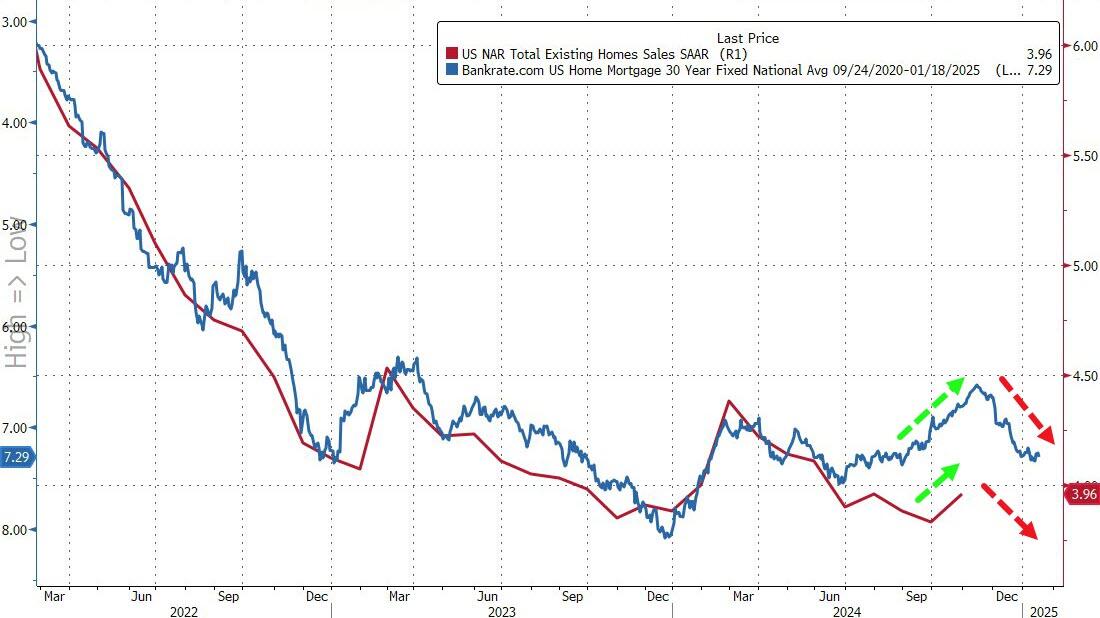
Finally, while that’s all very exciting – a scintilla of growth off almost record lows – the fecal matter is about to strike the rotating object as rising mortgage rates lagged impact threatens…
Source: Bloomberg
In October, 59% of homes sold were on the market for less than a month, compared with 57% in September, and 19% sold above the list price. Properties remained on the market for 29 days on average, compared with 28 days in the previous month. First-time buyers made up 27% of purchases, still historically low.














You must be logged in to post a comment.