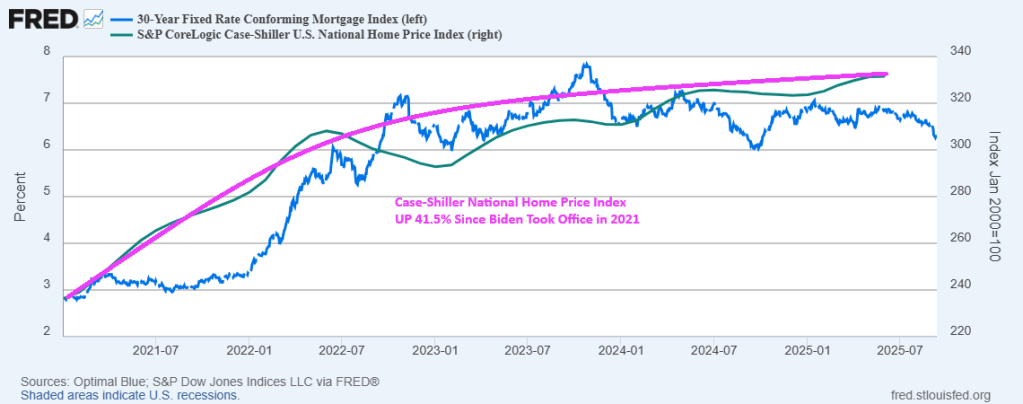
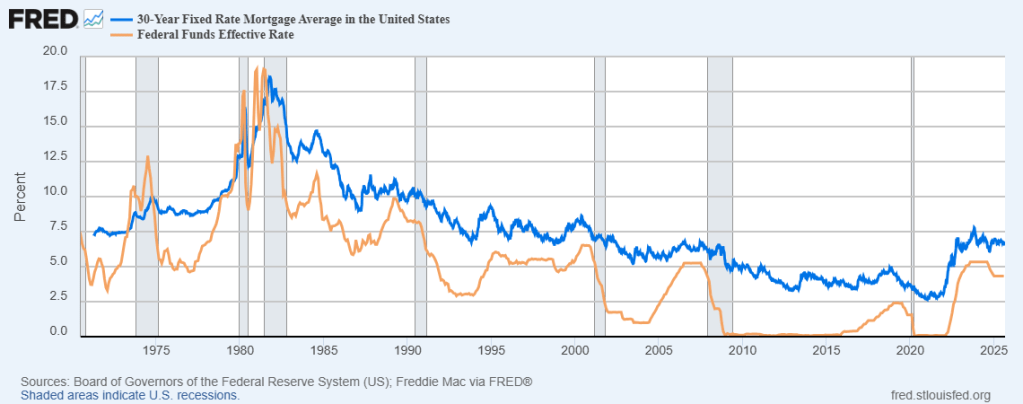
Mortgage rates remain elevated since the Biden Administration took control in 2021. Although under Trump, the rise in the 30-year mortgage rate has slowed. But the 30-year mortgage rate is up 126% since the beginning of 2021 and the “Joe The Boss” Biden administration.
Mortgage originations at large banks declined a whopping 74% under “Joe The Boss” Biden.
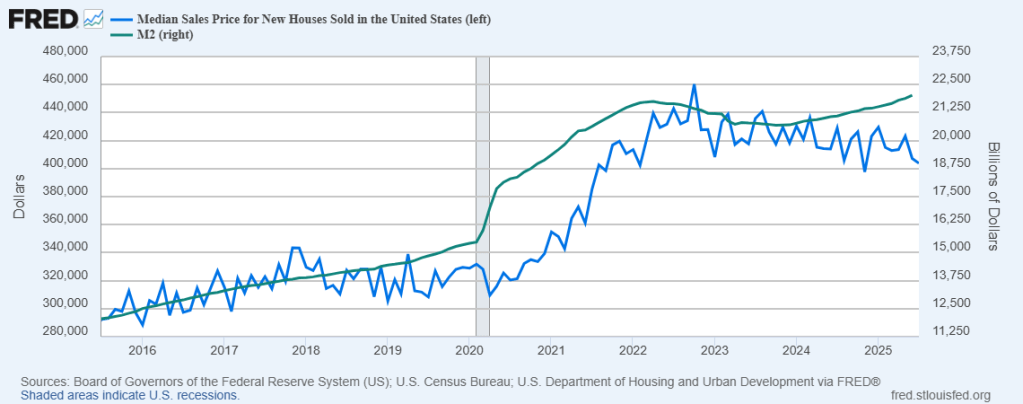
Between mortgage rates rising by 126% and house prices rising by 41.5% under “Joe The Boss” Biden.
But for last week, mortgage applications increased 9.2 percent from one week earlier, according to data from the Mortgage Bankers Association’s (MBA) Weekly Mortgage Applications Survey for the week ending September 5, 2025. This week’s results include an adjustment for the Labor Day holiday.
The Market Composite Index, a measure of mortgage loan application volume, increased 9.2 percent on a seasonally adjusted basis from one week earlier. On an unadjusted basis, the Index decreased 3 percent compared with the previous week. The seasonally adjusted Purchase Index increased 7 percent from one week earlier. The unadjusted Purchase Index decreased 6 percent compared with the previous week and was 23 percent higher than the same week one year ago.
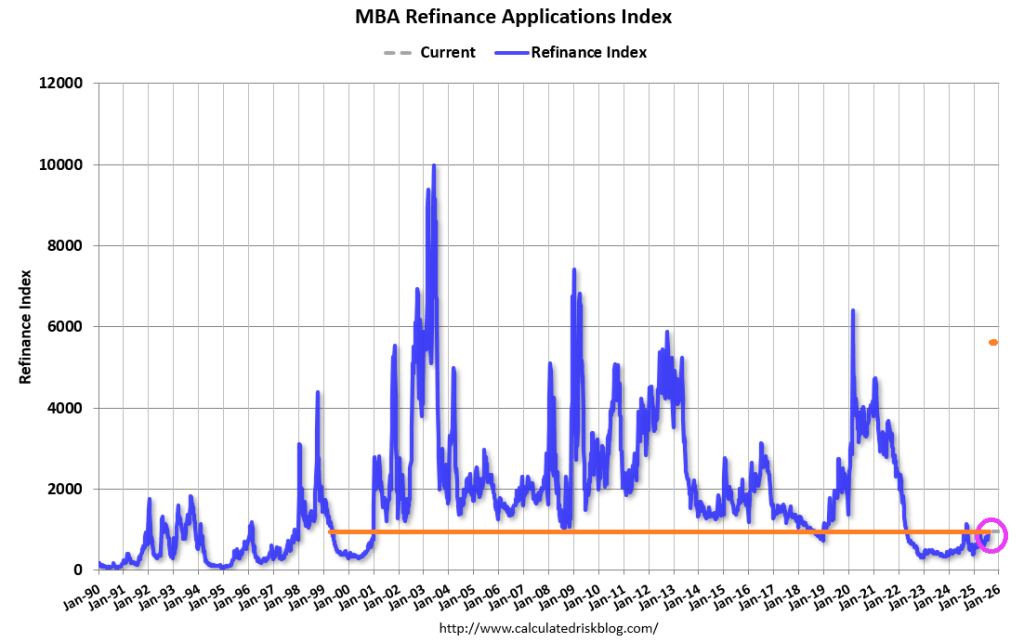
The Refinance Index increased 12 percent from the previous week and was 34 percent higher than the same week one year ago.
The holiday-adjusted refinance index had its strongest week in a year and the average loan size for refinances also increased significantly, since borrowers with large loans are more sensitive to bigger rate moves. Refinance applications accounted for almost 49 percent of all applications last week. … The average contract interest rate for 30-year fixed-rate mortgages with conforming loan balances ($806,500 or less) decreased to 6.49 percent from 6.64 percent, with points decreasing to 0.56 from 0.59 (including the origination fee) for 80 percent loan-to-value ratio (LTV) loans.
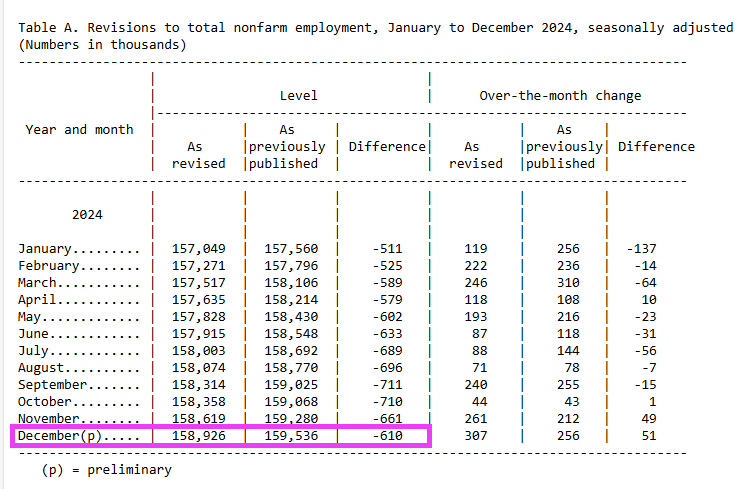
Each year, CES employment estimates are benchmarked to comprehensive counts of employment from the Quarterly Census of Employment and Wages (QCEW). These counts are derived primarily from state unemployment insurance (UI) tax records that nearly all employers are required to file with state workforce agencies.
Here is the breakdown:
Wow. Every month during Biden’s last year in his reign of error was a negative revision.
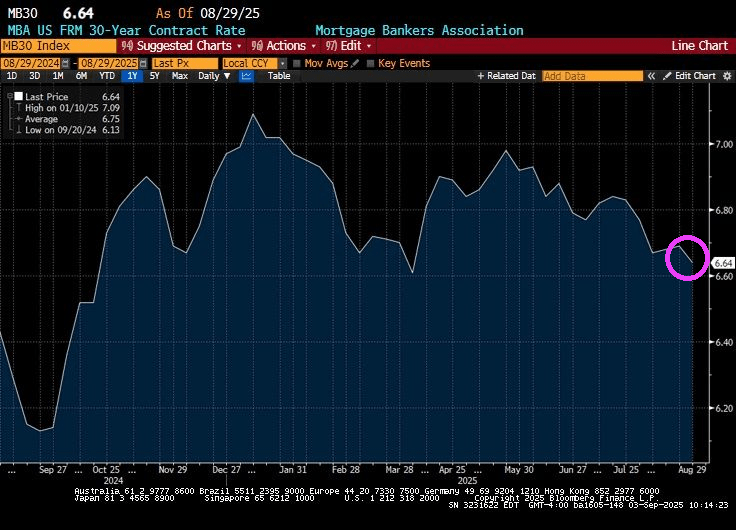
The good news? The US 30-year mortgage rate fell slightly to 6.64%.
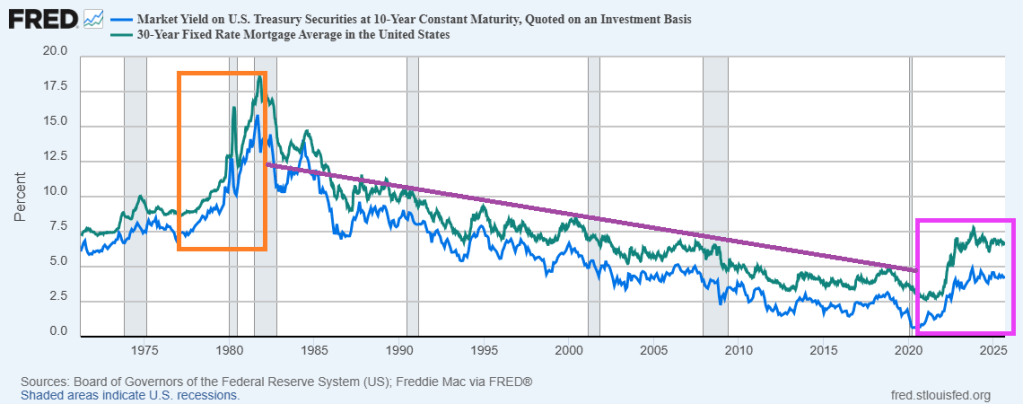
The bad news? It seems to be a milder repeat of the Ford/Carter years of the late 1970s/early 1980s. Rising 10-year Treasury yields and 30-year mortgage rates during the Ford/Carter years … and early Reagan years. The difference? The Federal Reserve is fundamentally different today than previously. With Bernanke/Yellen, The Fed became more “activist” (like Obama/Biden-appoointed District Judges). Powell is returning to the Yellen model of Fed activism … not doing much.
Now the market awaits a rate cut from The Fed at the next FOMC meeting. But 30-year mortgage rates are most closely related to the 10-year Treasury yield than the short-term Fed Funds rate. Theoretically, The Fed could cut their target rate by 25 basis points and mortgage rates could be uneffected. Or even rise.
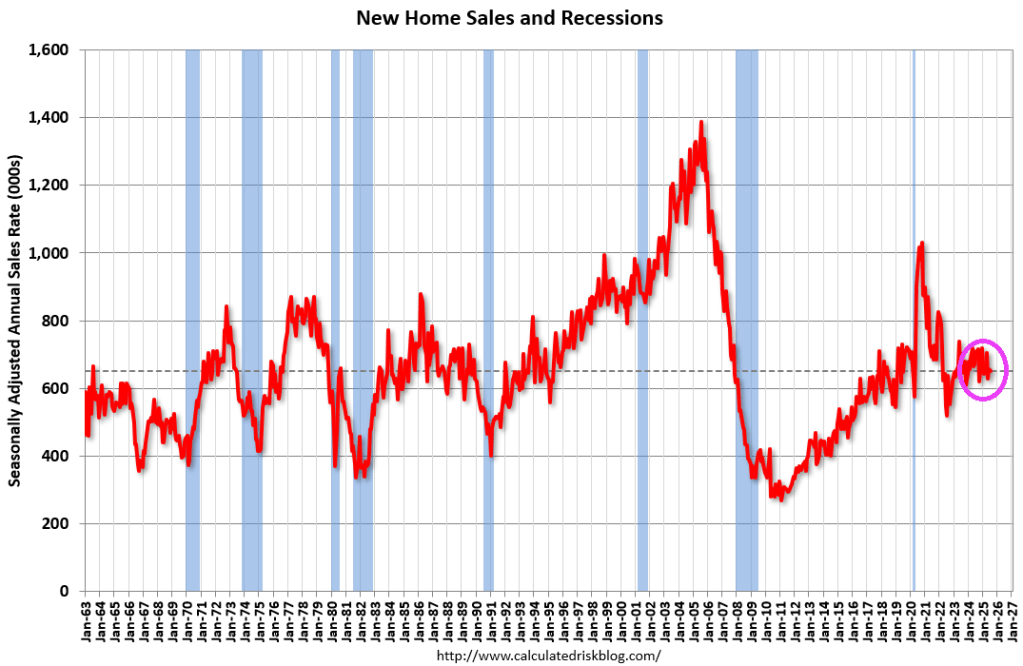
According to the US Census Bureau, New Home Sales of new single-family houses in July 2025 were at a seasonally-adjusted annual rate of 652,000, according to estimates released jointly today by the U.S. Census Bureau and the Department of Housing and Urban Development. This is 0.6 percent (±15.5 percent)* below the June 2025 rate of 656,000, and is 8.2 percent (±14.0 percent)* below the July 2024 rate of 710,000.
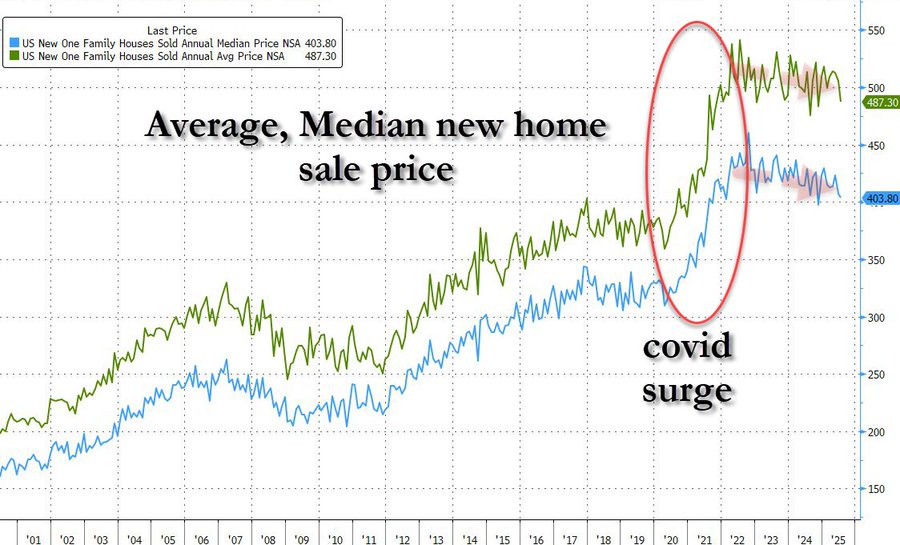
Median and Average Sales Price
The median sales price of new houses sold in July 2025 was $403,800. This is 0.8 percent (±5.9 percent)* below the June 2025 price of $407,200, and is 5.9 percent (±8.5 percent)* below the July 2024 price of $429,000. The average sales price of new houses sold in July 2025 was $487,300. This is 3.6 percent (±8.0 percent)* below the June 2025 price of $505,300, and is 5.0 percent (±8.6 percent)* below the July 2024 price of $513,200.
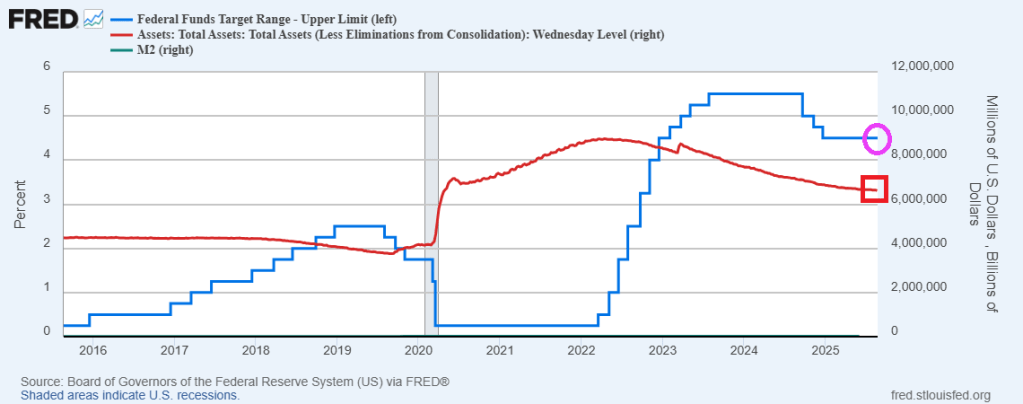
Here is a chart of median sales price of new homes against Fed money printing (M2).
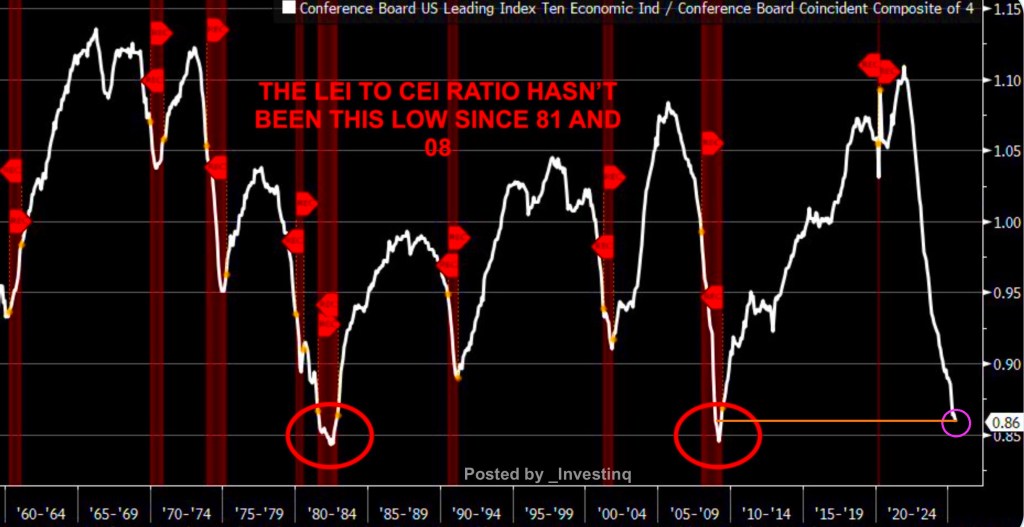
The Fed will have to whip it good with rate cuts if the recession warnings are an indicator of what lies ahead for the US economy.
The ratio of The Conference Board’s Leading Economic Indicators (LEI) vs. The Conference Board’s Coincident Economic Index (CEI) ratio hasn’t been this low since 2008.
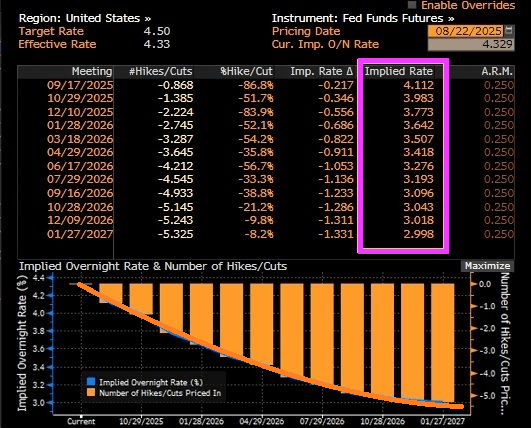
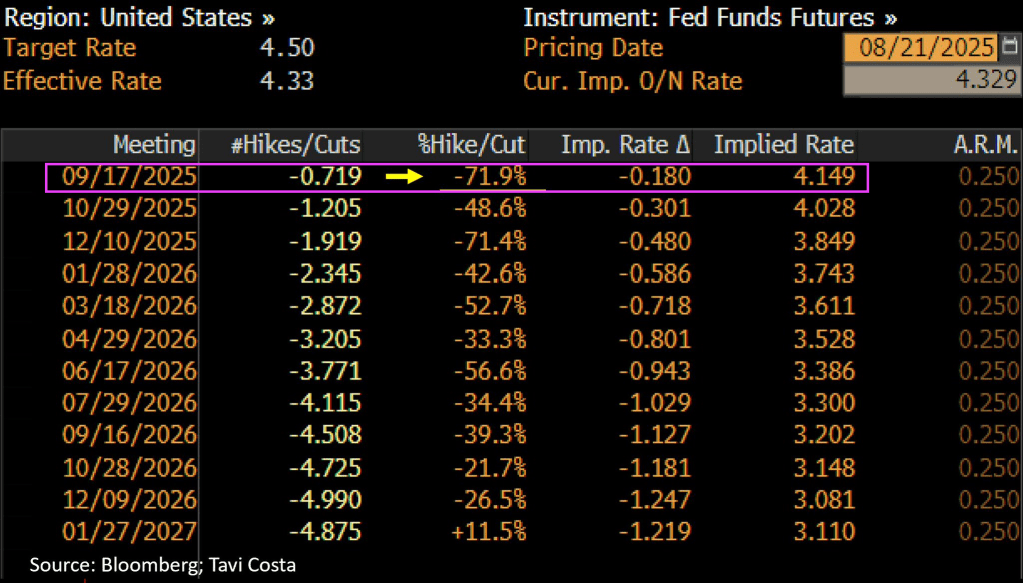
Fed Funds Futures are signalling rate cuts at the September 17th FOMC meeting and December 10th meetings.
The Fed didn’t try, but mortgage rates fell and mortgage applications rose 10.9% week-over-week.
Mortgage applications increased 10.9 percent from one week earlier, according to data from the Mortgage Bankers Association’s (MBA) Weekly Mortgage Applications Survey for the week ending August 8, 2025.
The Market Composite Index, a measure of mortgage loan application volume, increased 10.9 percent on a seasonally adjusted basis from one week earlier. On an unadjusted basis, the Index increased 10 percent compared with the previous week. The seasonally adjusted Purchase Index increased 1 percent from one week earlier. The unadjusted Purchase Index increased 1 percent compared with the previous week and was 17 percent higher than the same week one year ago.
The Refinance Index increased 23 percent from the previous week and was 8 percent higher than the same week one year ago.
The 30-year fixed mortgage rate declined to 6.67 percent last week,which spurred the strongest week for refinance activity since April. Borrowers responded favorably, as refinance applications increased 23 percent, driven mostly by conventional and VA applications. Refinances accounted for 46.5 percent of applications and as seen in other recent refinance bursts, the average loan size grew significantly to $366,400. Borrowers with larger loan sizes continue to be more sensitive to rate movements.
The latest inflation report continues to show no negative impact from tariffs. Core goods prices were up 0.2% in July. They are up just 1.1% over the past 12 months and are actually up a lesser 0.8% since President Trump began phasing in tariffs.
Business applications are booming under Trump’s economy.
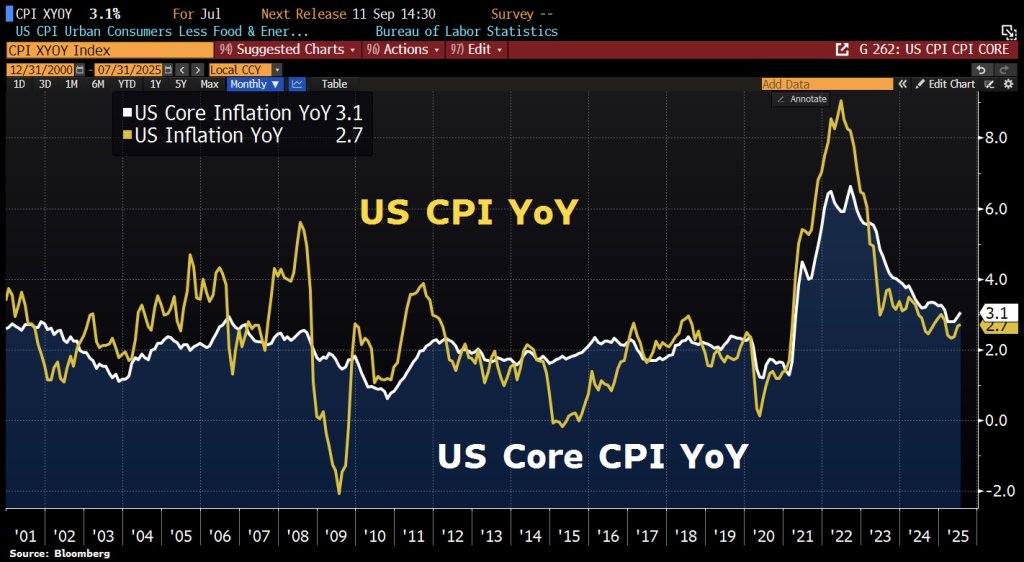
While consumer prices are calm (2.7% YoY).
Shelter inflation is higher than the average price increase (3.7% YoY).
US prices rose 0.3% MoM in June according to the Bureau of Labor Statistic (BLS). And on a YoY basis, inflation rose 2.7% while core inflation rose 2.9%.
Supercore inflation was up 3.017% YoY.
As of May, import prices rose a scant 0.0% MoM and 0.2% YoY.
Shelter rose 3.8% YoY in June while gas utilities rose 14.2%.
And on this news, the yield on 30-year Treasuries rose 5%.


You must be logged in to post a comment.