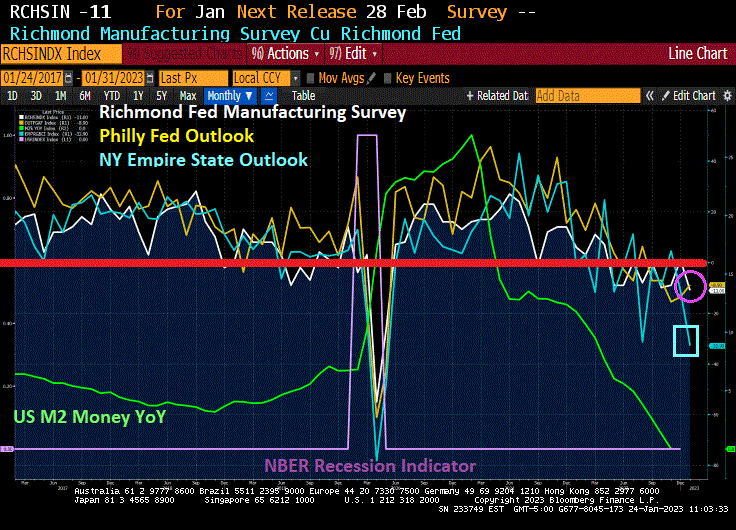
Three regional Fed reports I like to watch are New York’s Empire State Outlook, Philly Fed’s Outlook and Richmond Fed’s outlook. Today, The Richmond Fed released their manufacturing outlook and … it declined to -11.
So the big three are all down (Philly down to -8.9 while NY’s Empire State outlook is down to -32.9.
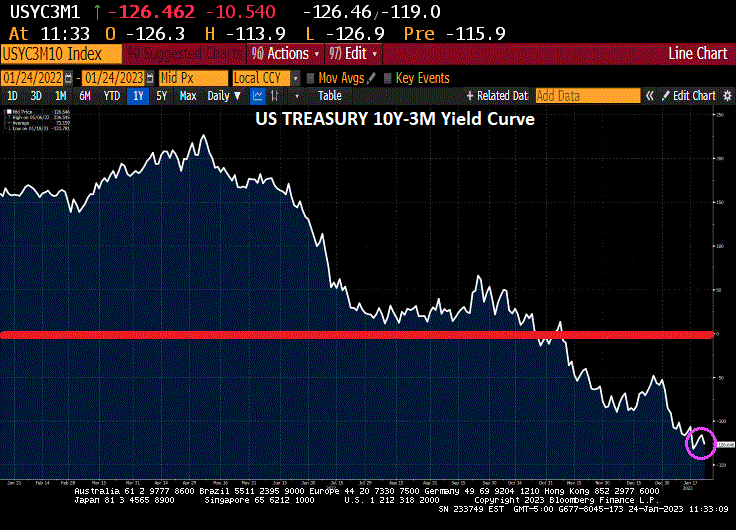
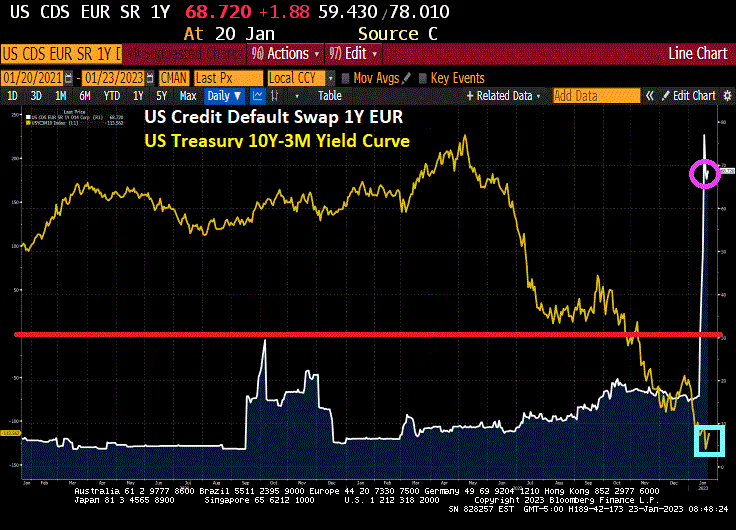
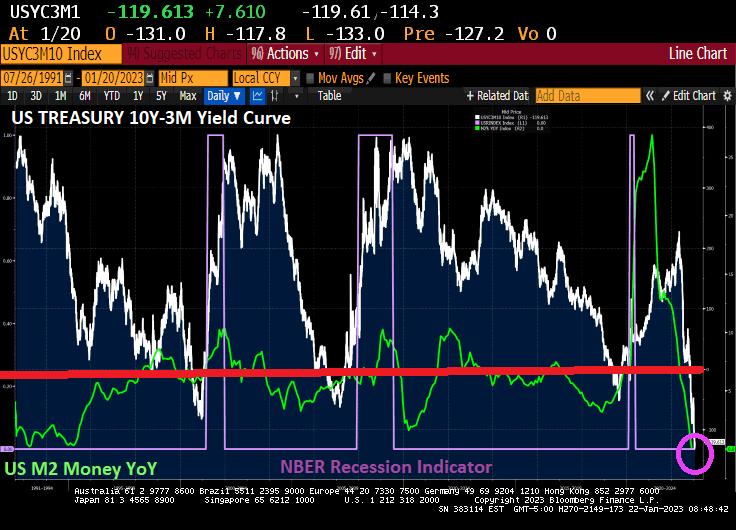
On the Treasury front, the US 10Y-3M yield curve inverted further (a signal of impending recession) just tanked to -126.462 basis points.
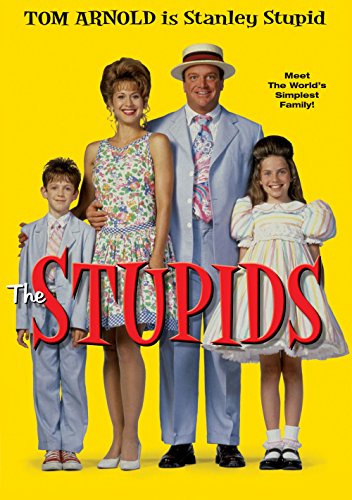
While the children in Congress and the Administration argue about cutting the Fedcral budget (as if there isn’t trillions of dollars of wasteful spending in the budget), we saw an even dumber suggestion from Pramila Jayapal (WA-D), Adam (Shifty) Schiff (CA-D) and Sheila Jackson Lee (TX-D): a bill to eliminate the debt ceiling altogether to allow unlimited Federal spending. That reminds me of the Tom Arnold/Julie Ford film “The Stupids.” Yet these clowns keep getting re-elected.
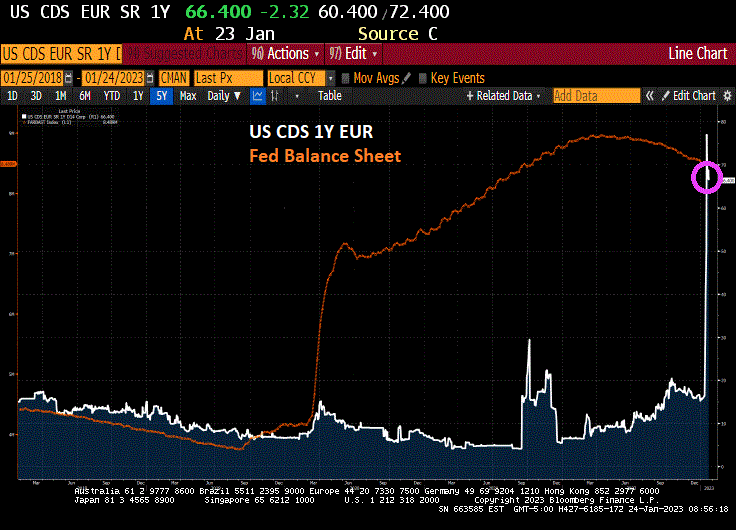
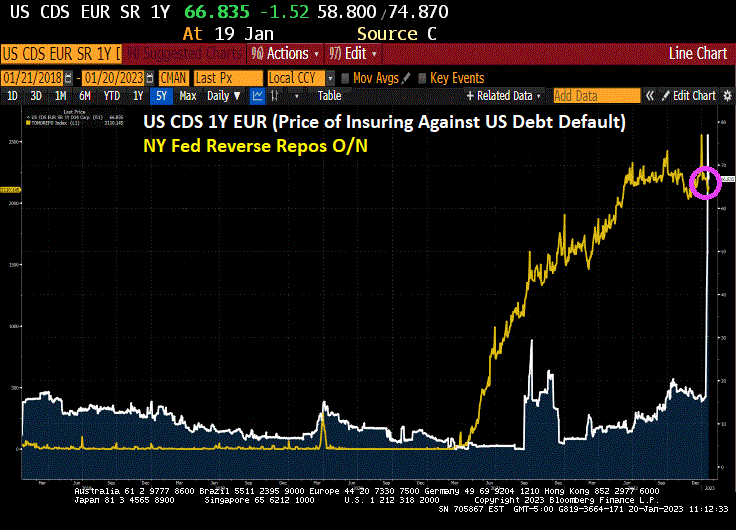
In any case, The Federal Reserve’s quantitative-tightening program risks being propelled toward an early end as US politicians bicker in Washington over raising the national debt limit, according to some economists and bond-market participants. As of this morning, the US credit default swap (1-year CDS) remains elevated signaling a positive probability of a US debt default. (CDS represents the price of insuring against a default).
But notice that The Fed still has $8.5 TRILLION in assets (largely Treasuries and Agency MBS) on their balance sheet. But The Fed’s plans to continue shrinking their balance sheet will be put on hold (and if fact will be reversed) if Democrats and President (10% for the big guy) Biden don’t budget on cutting some of the enormous fat from the Federal budget.
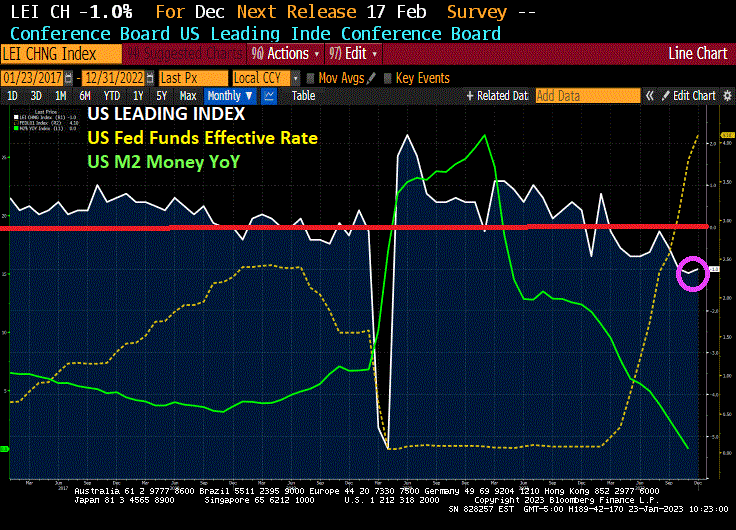
The Conference Board’s Leading Indicator should be called The Bleeding Indicator given that the leading index has declined to 10 straight months. This is happening as The Fed tightens monetary policy to combat inflation.
Leading indicators include economic variables that tend to move before changes in the overall economy. These indicators give a sense of the future state of an economy.
Ah, the start of a new week with Treasury Secretary Janet Yellen arguing (with a straight face) that there is no room in the Federal budget for cuts. Apparenly, Yellen never read any of the massive, pork-laden spending bills signed by Biden (no one else did in Congress either, nor did Biden).
Let’s start with the US credit default swap (1 year). It remains high at 68.72 (the price of insuring against a US default). And the US Treasury yield curve (10Y-3M)? It remains deeply inverted at -114 basis points this morning signaling an impending US recession.
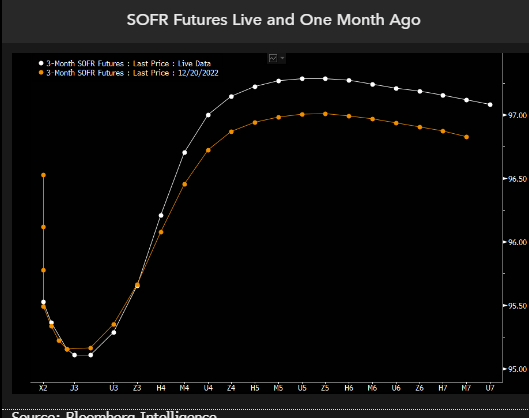
Then we have SOFR (Secured Overnight Financing Rate). SOFR futures are pricing for the Federal Reserve to hike rates a few more times and to start cutting before the end of this year. The pricing for the 2023 rate path is little changed from a month ago, but this year the market has priced in deeper cuts in 2024, with SOFR now seen below 3% by early 2025 before stabilizing. The implication is that hedging recession and significant rate cuts in 2024 now seems to be fully priced in, yet there’s a risk that the Fed cuts even deeper than the market is factoring in.
We think the market is partially preparing for the risk of even deeper rate cuts than linear instruments are pricing. To see how dramatic those are, we can look at options on SOFR futures and model what’s being priced by the volatility surface.
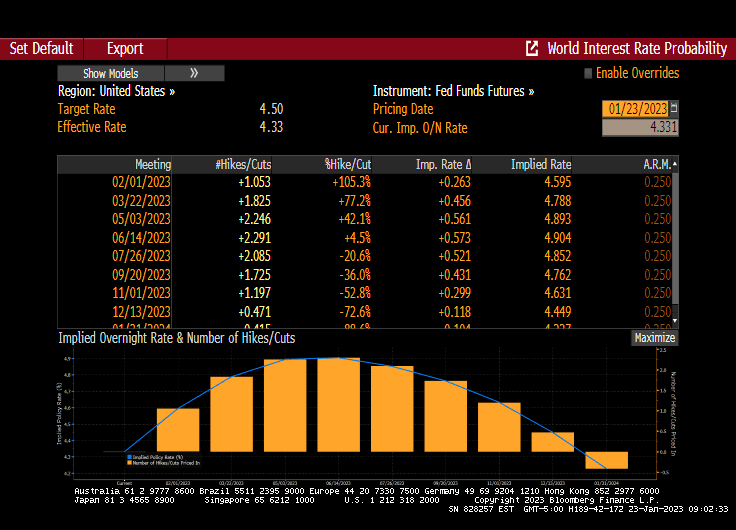
We are seeing the same story if we look at Fed Funds Futures data. Fed rate hikes until June, then rate cuts to follow.
How did Biden’s lawyers and now the DOJ figure out that Biden has classified documents all over the place? Probably from reading “The Hardy Boys.” Except that Biden didn’t cleverly hide classifed documents. Rather, he carelessly left them lying around at The Penn Biden Center and his home in Wilmington Delaware that he shared with his son, Hunter. And probably on the Amtrak train he would take from Wilmington to Union Station in DC. And probably at Chinatown Garden, a short walk from The White House.
The first headline I saw when I turned on Bloomberg.com was “DOJ Officials Find More Classified Documents at President Biden’s Home.” This is an improvement! So far, the task has been handled by Biden’s private attorneys who don’t have proper security clearance; at least the Justice Department is finally getting involved!
But back to the US yield curve. It is now the most inverted in 30+ years as M2 Money growth stalls. Inverted yield curves have preceded recessions in the past.
But as China reopens and Europe is experiencing a warmer winter than expected (meaning that Europe has sufficient natural gas reserves) and US inflation cooling,
we are seeing market-implied odds of a recession falling in January.
I am still betting on a recession in the second half of 2023.
I must admit, Joe Biden has a horribly misleading nickname “Middle Class Joe.” Between Biden’s horrible energy policies and Pelosi’s/Schumer’s spending binges, the US middle class and low wage workers have suffered mightely with the inflation tax. Throw in Jerome Powell and The Federal Reserve’s manic money printing and the American middle class has a problem.
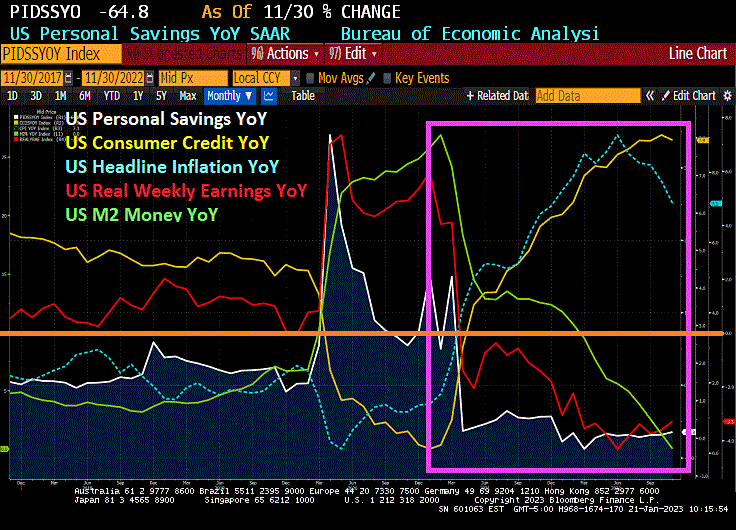
US inflation peaked at 9.1% year-over-year (YoY), but has declined to a still painful 7.1% YoY as The Fed removes it aggressive monetary stimulus. But to cope with persistent US inflation, consumers have had to dip into savings and use more credit cards. As a consequence, personal savings plunged -64.8% YoY while consumer credit rose 7.9% YoY.
The other tax on the middle class and low-wage workers is the 21 straight months of negative REAL weekly earnings growth.
On the housing front, REAL home prices are growing at 1.5% YoY while REAL weekly wage growth is still NEGATIVE at -3.13% YoY.
Make no mistake, inflation caused by The Fed and Federal governments spending is a tax on the middle class and low wage workers.
Biden, Pelosi, Schumer and Powell are the 4 Horseman of the Inflation Apocalypse.
First, US default risk as measured by credit default swaps remains elevated (primarily because Biden and Democrats refused to cut wasteful spending or reign in non-retirees on Social Security). And NY Fed’s Reverse Repos remain elevated.
And then we have Citi’s economic surprise index for the US at -17 as The Fed slows money growth to 0%.
I wish I knew a place where inflation and insane Federal government spending and policies doesn’t exist.
The Thrill Is Gone from the US housing market as M2 Money growth fells to 0%.
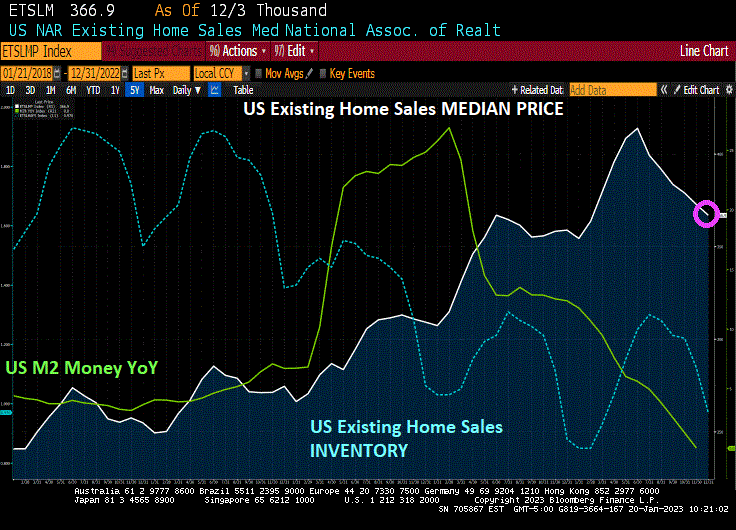
US Existing Home Sales fell -1.5% from November to December (MoM) to 4.02 SAAR units sold. That translates to a depressing -34% decline since December 2021 (YoY).
On the positive side, these numbers are better than expected (-3.4% MoM expected). Still, these numbers are pretty dismal.
Existing home sales MEDIAN PRICE fell to $366.9k as M2 Money growth vanishes. And inventory of existing homes for sale remains lower than pre-Covid levels.
Let’s see what Powell and the Gang (aka, The Federal Reserve Board of Governors) does with interest rates going forward.
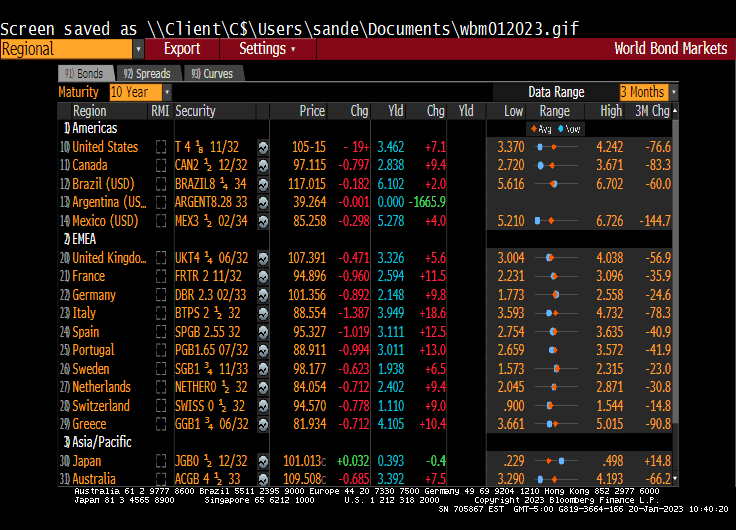
Today, the 10-year Treasury yield is up 7.1 basis points, but the real action is in Europe where sovereign yields are up 11.5 bps in France, 9.8 bps in Germany and 18.6 bps in Italy.
Notice that the debt ceiling keeps on climbing once the Kabuki Theater of Democrats and Republicans is over.
The Volatility Cube for the US CDS 1 year signals that it will all be over soon.
So, Yellen and Treasury are threatening us with taking away Social Security and Medicare if we don’t agree with their lavish Pelosi-like spending sprees and debt.
And why exactly is Janet Yellen flying to China? I admit Washington DC has lousy Chinese food, but at least I hope Yellen takes Hunter Biden with her to negotiate the impending US default and debt workout.
I watched Biden’s Press Secretary Karine Jean Pierre giving Biden credit for the lowest unemployment rate in US history thanks to his economic policies. And Biden mentioned that he inherited a terrible economy from Trump.
Hmmm.
Let’s let the data talk.
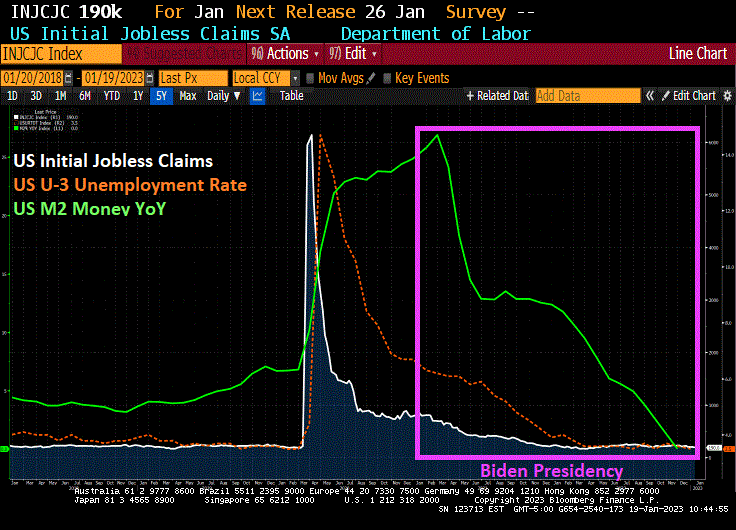
Covid was horrific (I almost died from it), but it was the government response to Covid there was disastorous. Government shutdowns (and the masking of the populace) killed off numerous small businesses and sent jobless claims soaring in 2020 (white line) and U-3 unemployment rate rose to the highest level since The Great Depression.
The response from The Federal Reserve was a massive printing of money (green line). And after governments stopped their economic shutdowns (coupled with massive money printing), we saw jobless claims and unemployment shrink rapidly BEFORE Biden took office as President.
The 1981 recession begat an epic borrowing of money by The Federal government (under House Speaker Tio O’Neill D-MA) and we saw another explosion in Federal debt under House Speaker Nancy Pelosi D-CA TWICE, once in 2009 following the financial meltdown and again in 2020 following the Covid economic lockdowns.
So does Trump get any thanks for the rapidly improving labor market before his ouster by Biden? Of course not. But who gets the blame for the staggering growth in Federal debt? House Speaker Nancy Pelosi.
The US did get positive wage growth under Biden, but due to inflation, American workers have experienced 21 straight months of NEGATIVE wage growth.
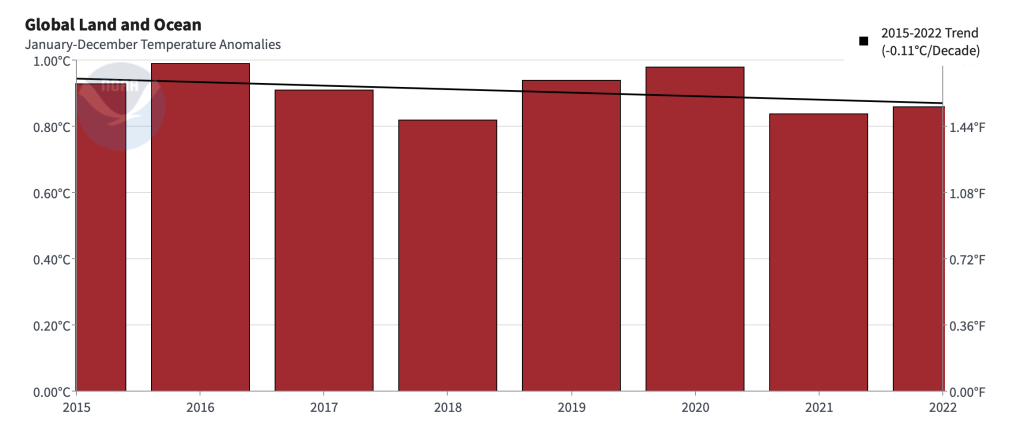
While Trump tried deregulation to free-up the US economy, Biden has consistently used regulation as a weapon of obidience. His slavish obidience to activist groups on the environment, which is a shame since temperatures have actually been coming down since 2016.
When you look at the data, Trump actually set in motion the jobs recovery, not Biden. Other than helping to create inflation, I can’t think of one positive thing Biden has done for the economy.
On an unrelated note, why is US FBI Director Chris Wray at the World Economic Forum in Davos Switzerland when there is a top secret document fiasco going on in DC and Delaware?


You must be logged in to post a comment.