The Fed’s themesong: Keep on printing!
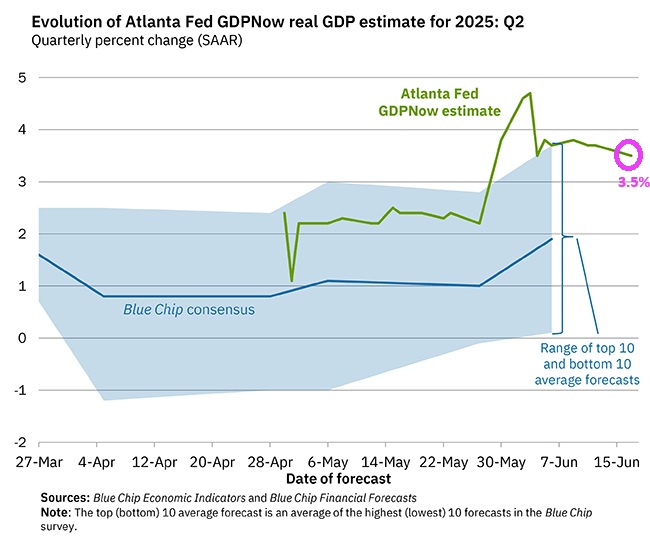
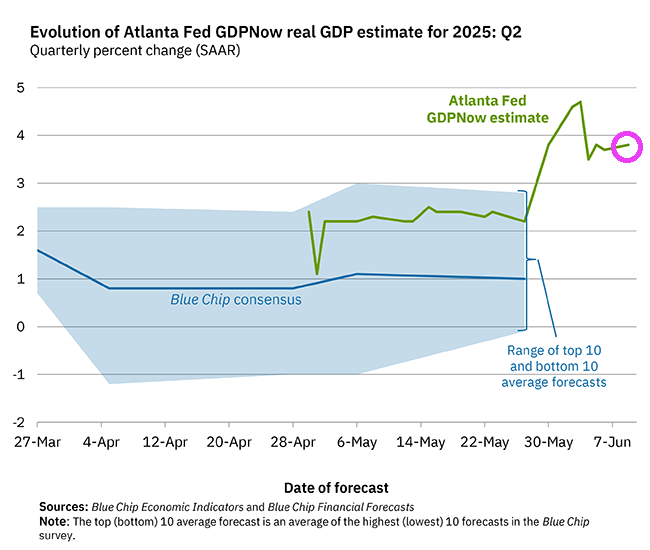
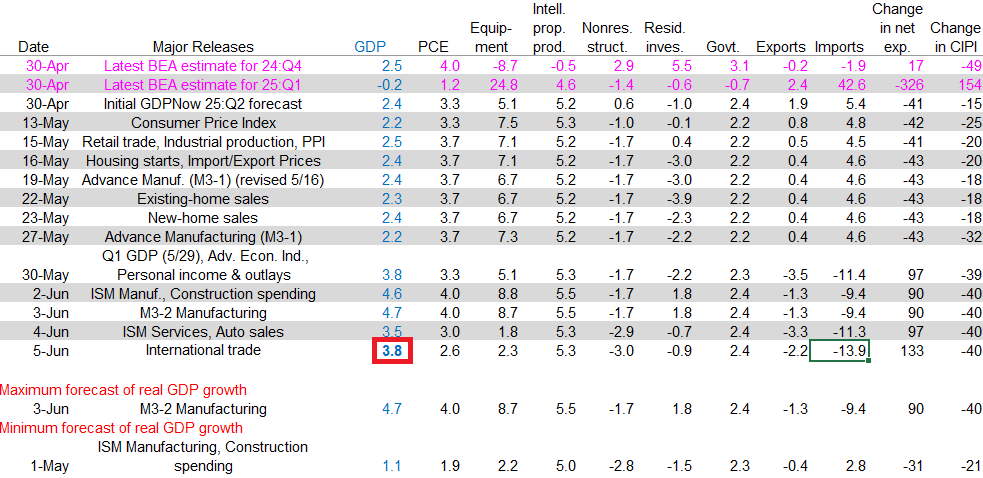
The GDPNow model estimate for real GDP growth (seasonally adjusted annual rate) in the second quarter of 2025 is 3.5 percent on June 17, down from 3.8 percent on June 9. After recent releases from the US Census Bureau, the US Bureau of Labor Statistics, the Federal Reserve Board of Governors, and the Treasury’s Bureau of the Fiscal Service, the nowcasts of second-quarter real personal consumption expenditures growth and second-quarter real government expenditures growth decreased from 2.5 percent and 2.3 percent, respectively, to 1.9 percent and 2.1 percent, while the nowcast of second-quarter real gross private domestic investment growth increased from -1.9 percent to -1.4 percent.
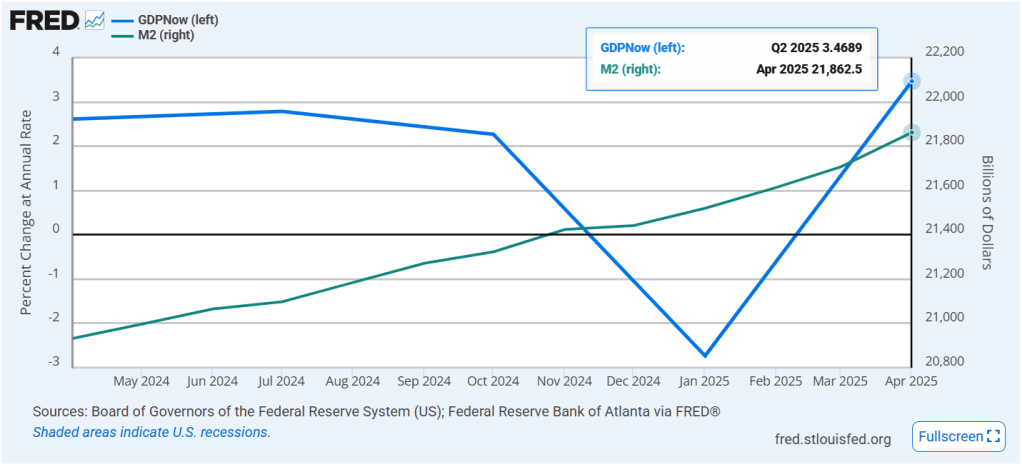
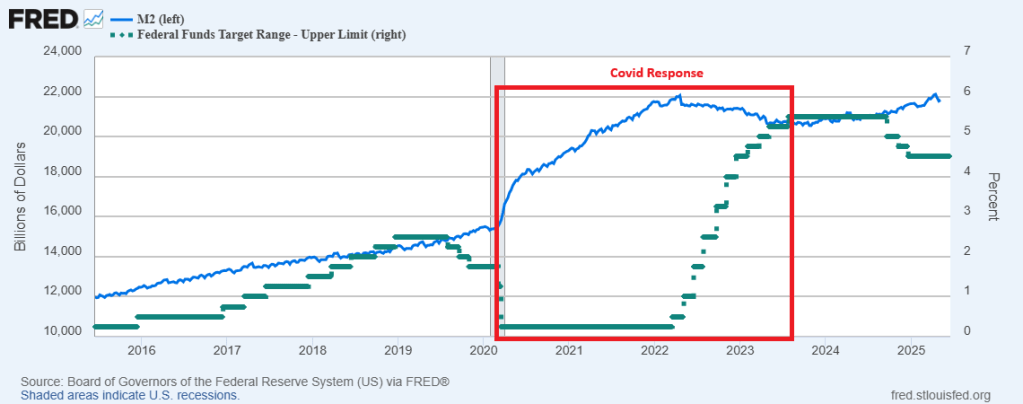
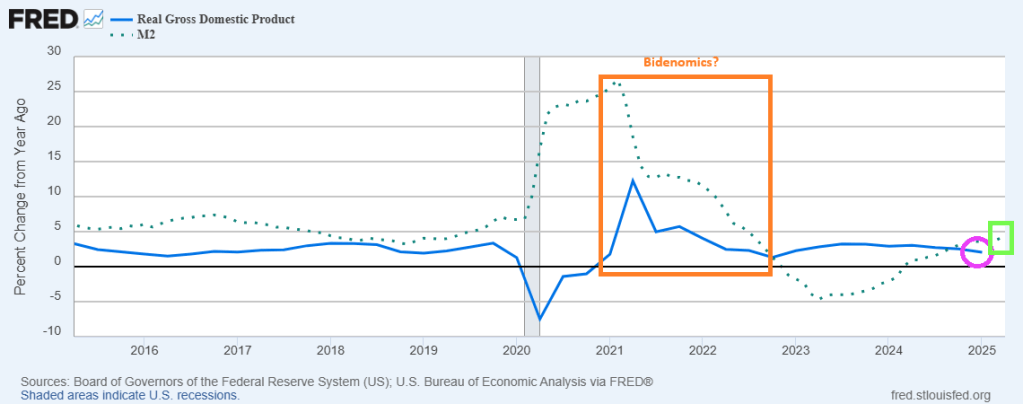
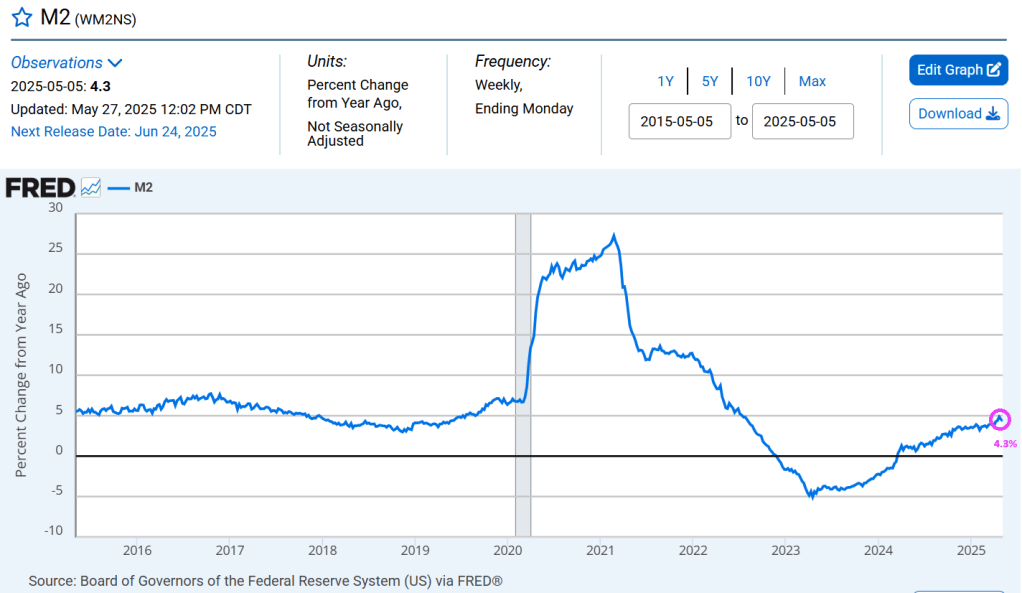
GDP growth corresponds to Fed money printing.
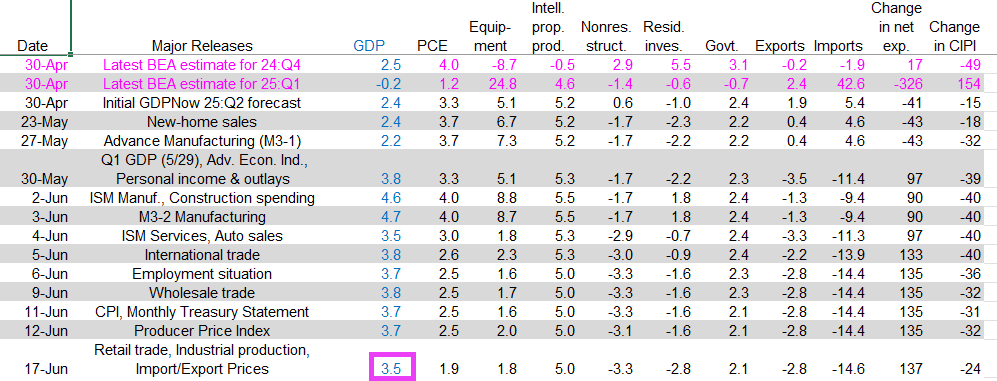
Here is the breakdown. True, real GDP growth has been slowing over June.


You must be logged in to post a comment.