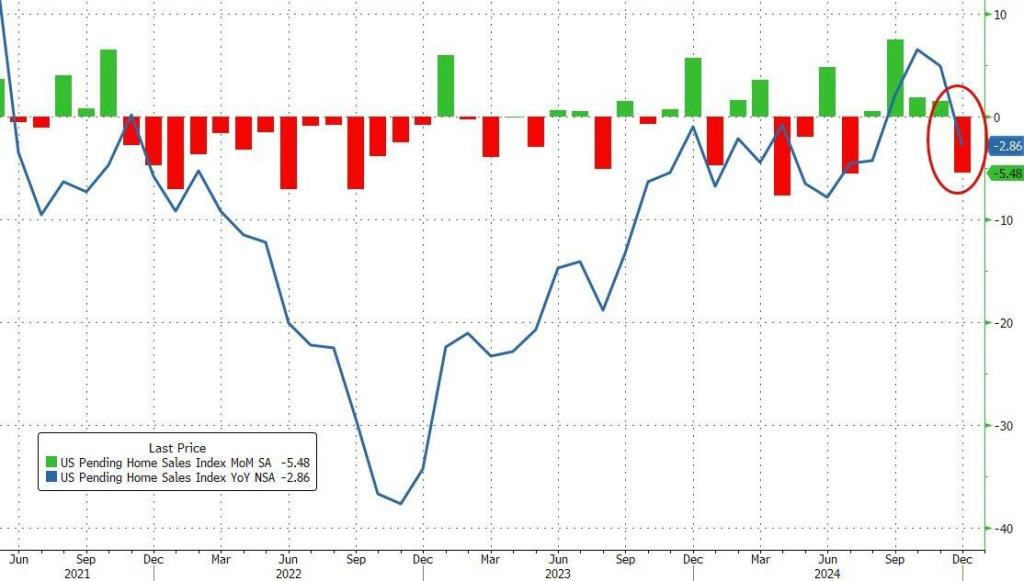
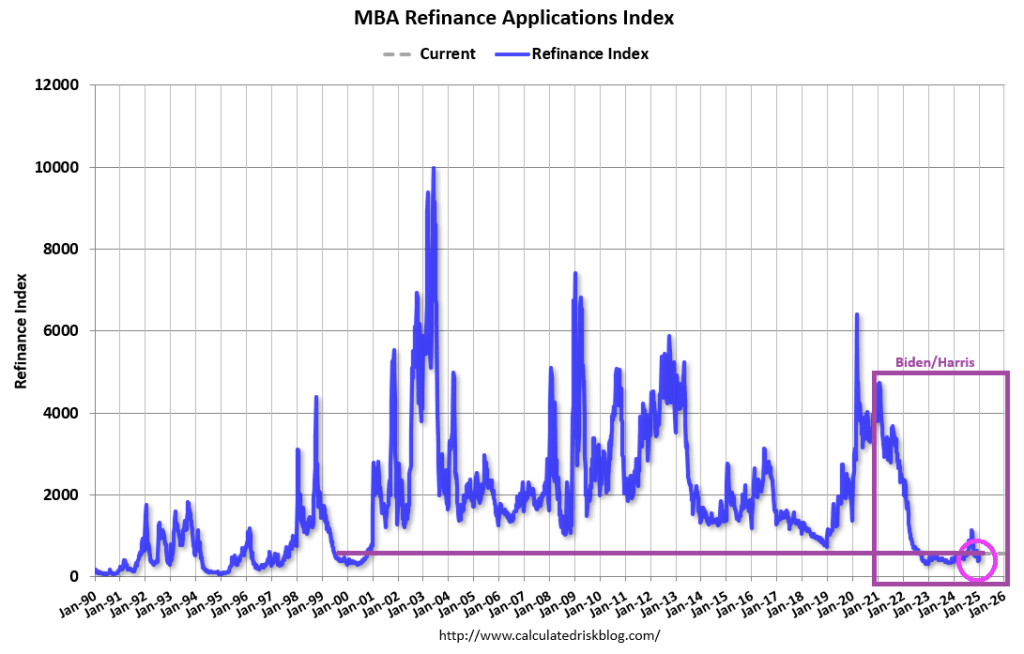
This is the lowest December print since records began (in 2000).
Let’s see if Trump can loosen up regulations on mortgage lending and housing. Hopefully, the new HUD Secretary (Scott Turner) will be an upgrade over DofHealth’s Rachel Levine.
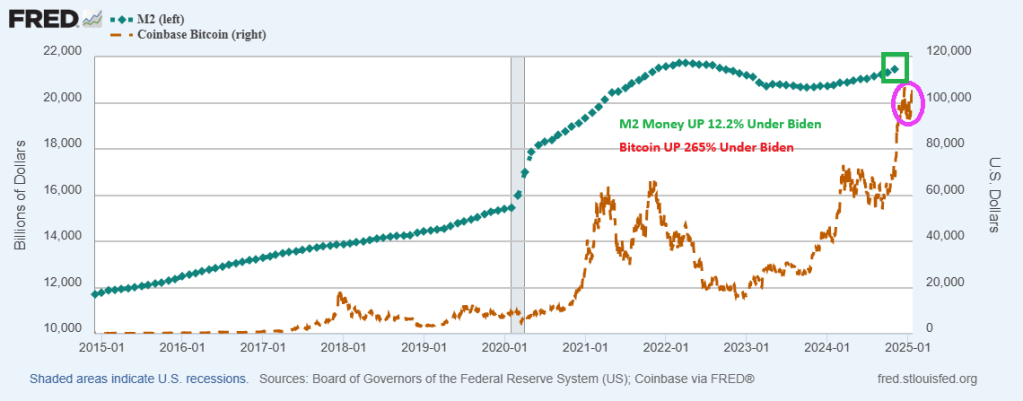
Wow. Money printing by The Federal Reserve went will after the Covid outbreak in early 2020. So did Federal spending. Unfortunately, politicians are addicted to Federal spending. And Senators like Chuck Schumer (D-NY) and Adam Schiff (D-CA) are trying to obstruct any spending cuts by Trump and his DOGE.
Well, M1 Money printing is UP 365% since Covid while M2 Money printing is UP 40%.
Federal current expenditures are up 45% since the Covid outbreak. But were never returned to normal spending levels.
New York senator Chuck Schumer is opposed to Trump’s efforts to cut Federal spending. Is Senator Schumer REALLY the political boss of Tammany Hall, the Democratic Party’s political machine that played a major role in the politics of 19th-century New York City and State?
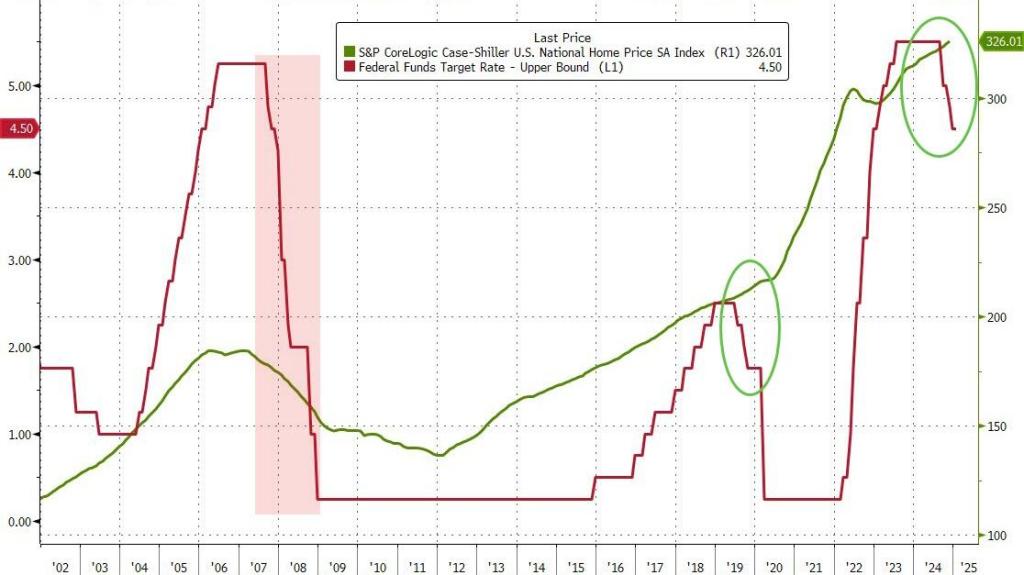
One reason that US home prices remain high (and unaffordable for many) is The Federal Reserve (aka, The Green Slime). Former Fed Chair (and Biden’s Treasury Secretary is no Luciana Paluzzi, the Italian beauty from the James Bond film Thunderball. Yellen is just a far-left economic hack.
Look at the Case-Shiller national home price index compared with The Fed funds target rate.
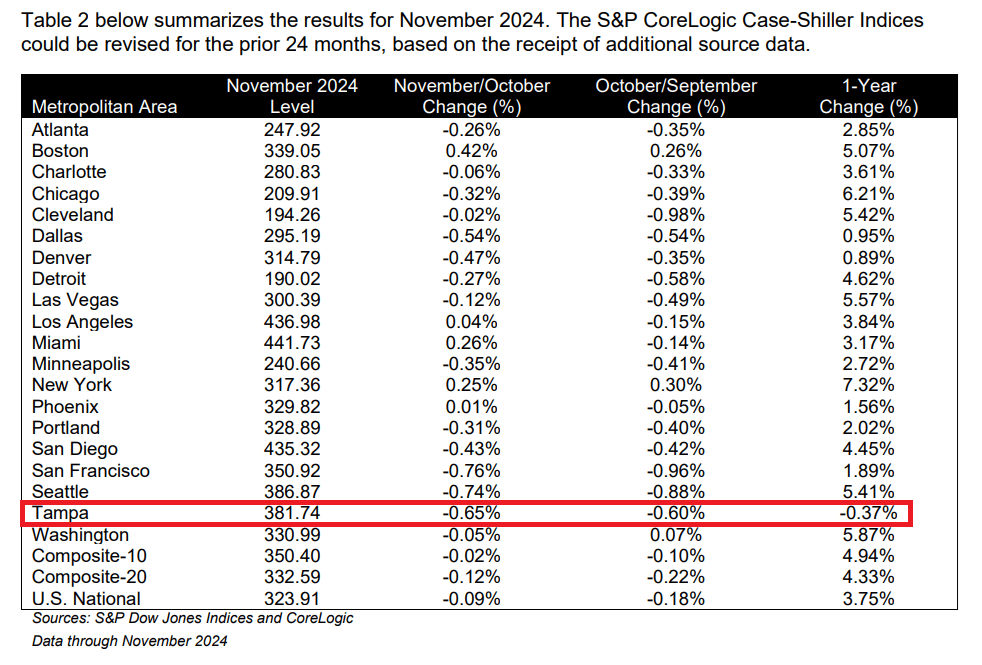
The S&P CoreLogic Case-Shiller U.S. National Home Price NSA Index, covering all nine U.S. census divisions, reported a 3.8% annual return for November, up from a 3.6% annual gain in the previous month. The 10-City Composite saw an annual increase of 4.9%, recording the same annual increase in the previous month. The 20-City Composite posted a year-over-year increase of 4.3%, up from a 4.2% increase in the previous month. New York again reported the highest annual gain among the 20 cities with a 7.3% increase in November, followed by Chicago and Washington with annual increases of 6.2% and 5.9%, respectively. Tampa posted the lowest return, falling 0.4%.
The pre-seasonally adjusted U.S. National, 20-City, and 10-City Composite Indices’ upward trends continued to reverse in November, with a -0.1% drop for the national index, while the 20-City Composite saw a -0.1% decline and the 10-City Composite was unchanged.
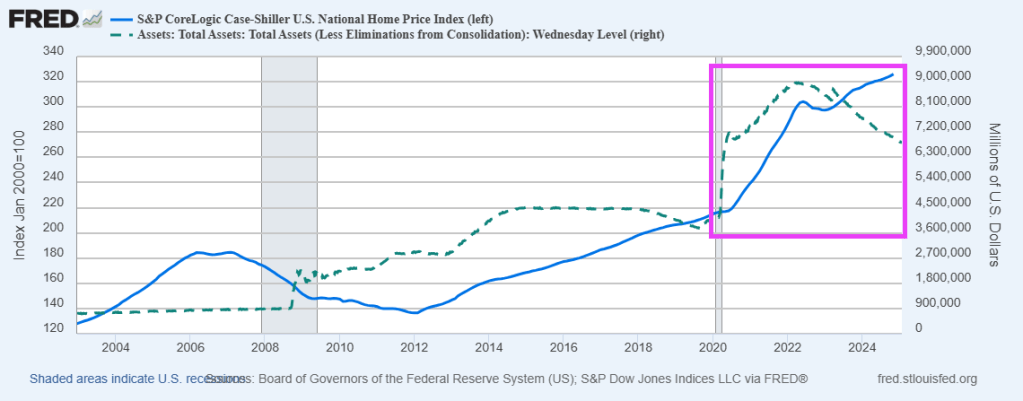
While the Fed Funds target rate gyrates, The Fed’s balance sheet remains high.
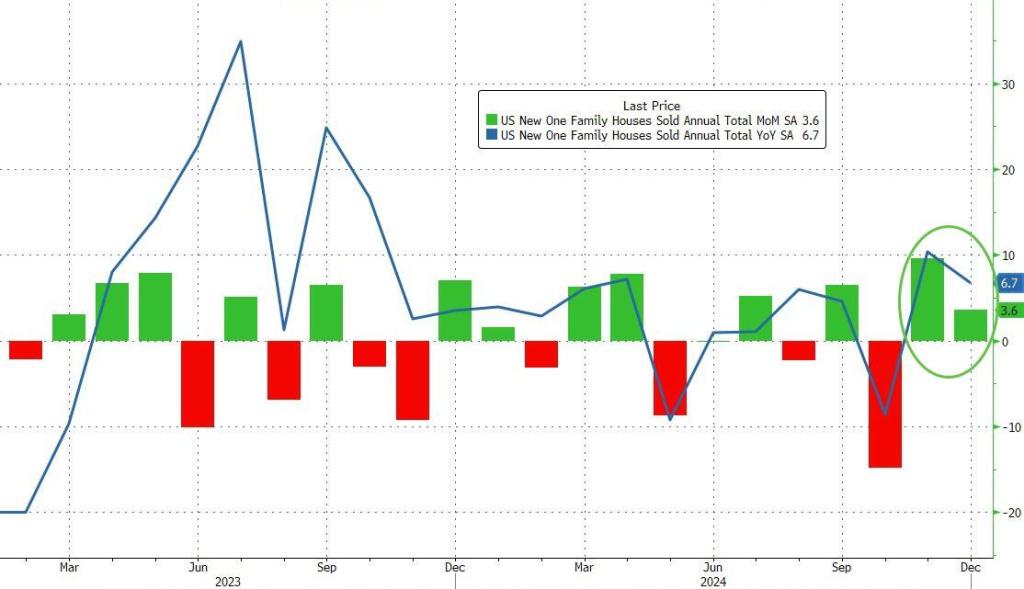
Sales of new US homes ended 2024 on a high note in December as customers took advantage of incentives from builders, leading to a second straight year of increased purchases.
For the full year, customers purchased 683,000 homes, up about 2.5% from 2023’s total.
Sales of new single-family houses in December 2024 were at a seasonally adjusted annual rate of 698,000, according to estimates released jointly today by the U.S. Census Bureau and the Department of Housing and Urban Development. This is 3.6 percent above the revised November rate of 674,000 and is 6.7 percent above the December 2023 estimate of 654,000.
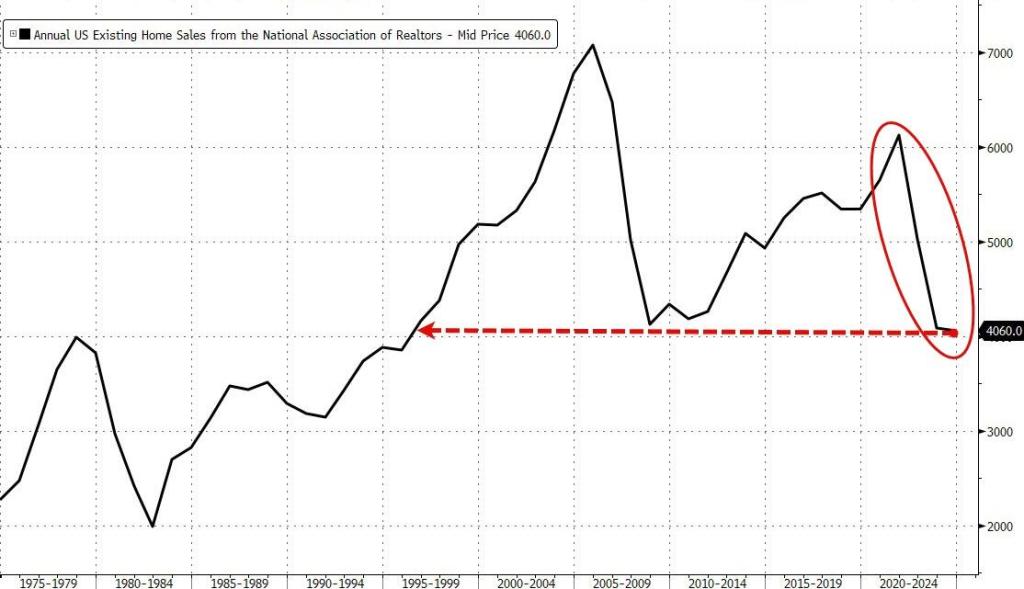
US Existing Home Sales rose for the third straight month in December (longest streak since late 2021), rising 2.2% MoM and up 9.3% YoY – the best annual shift since June 2021. However, despite the last rebound, for all of 2024, sales reached the lowest since 1995, when the US had about 70 million fewer people.
And with the lowest existing home sales since 1995, we have mortgage purchase applications at the lowest level since 1995.
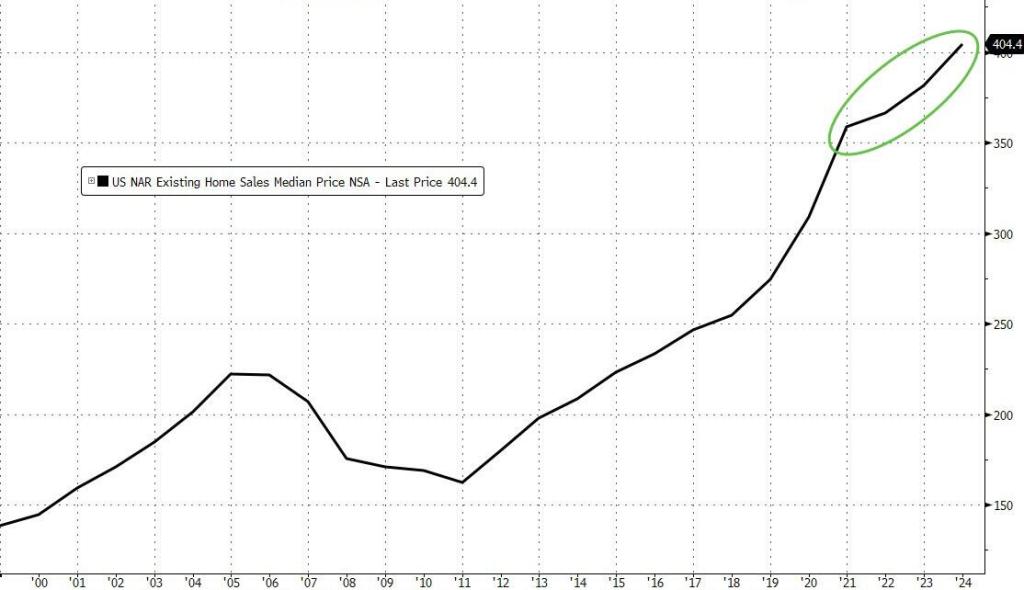
Why? The median price of EHS has exploded under Biden.
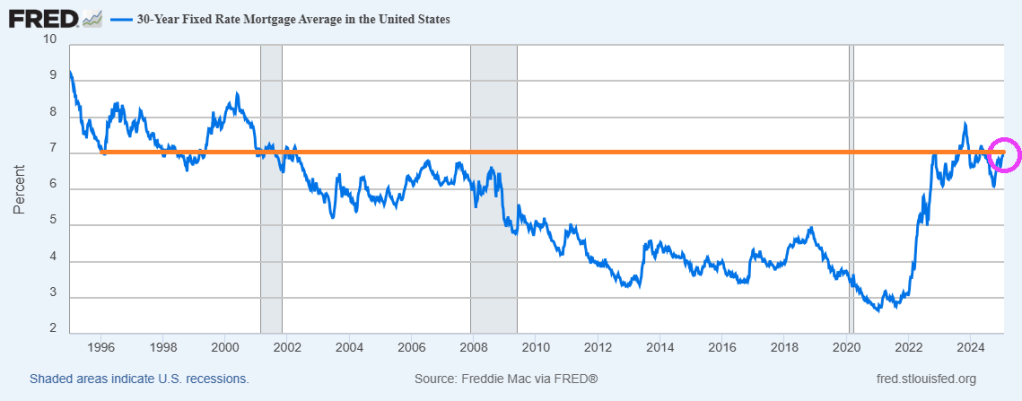
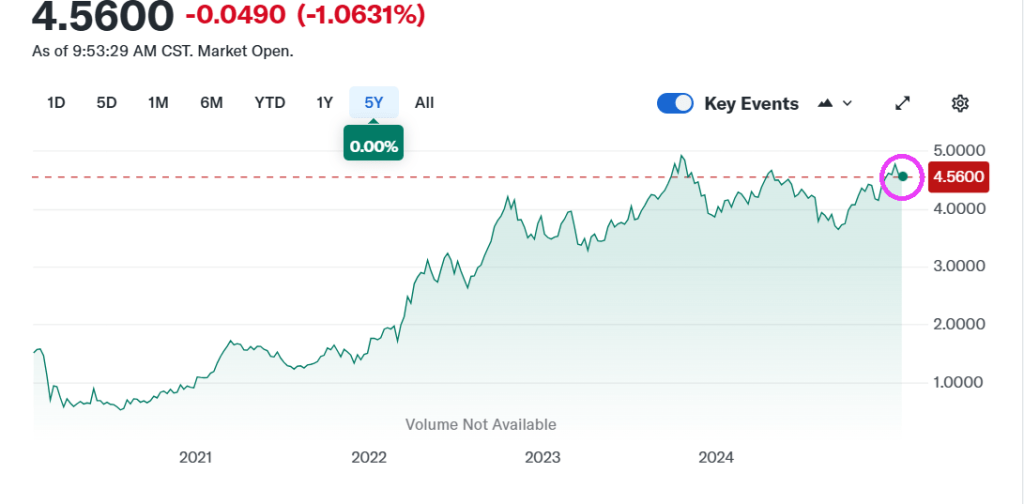
Mortgage rates are hovering around 7%, same as around 1995.
As The Pretenders sang, “My City Was Gone.” That song was about Akron, Ohio. But it applies to the US Mortgage Market under Biden/Harris. The question is whether Trump’s deregulation plans can return to its former glory.
Mortgage applications increased 0.1 percent from one week earlier, according to data from the Mortgage Bankers Association’s (MBA) Weekly Mortgage Applications Survey for the week ending January 17, 2025.
The Market Composite Index, a measure of mortgage loan application volume, increased 0.1 percent on a seasonally adjusted basis from one week earlier. On an unadjusted basis, the Index increased 3 percent compared with the previous week. The seasonally adjusted Purchase Index increased 1 percent from one week earlier. The unadjusted Purchase Index increased 7 percent compared with the previous week and was 2 percent higher than the same week one year ago.
The Refinance Index decreased 3 percent from the previous week and was 42 percent higher than the same week one year ago.
The Pretenders’ lead singer Chrissie Hynde likely would have made a better Federal Reserve Chair and Treasury Secretary than Janet Yellen.
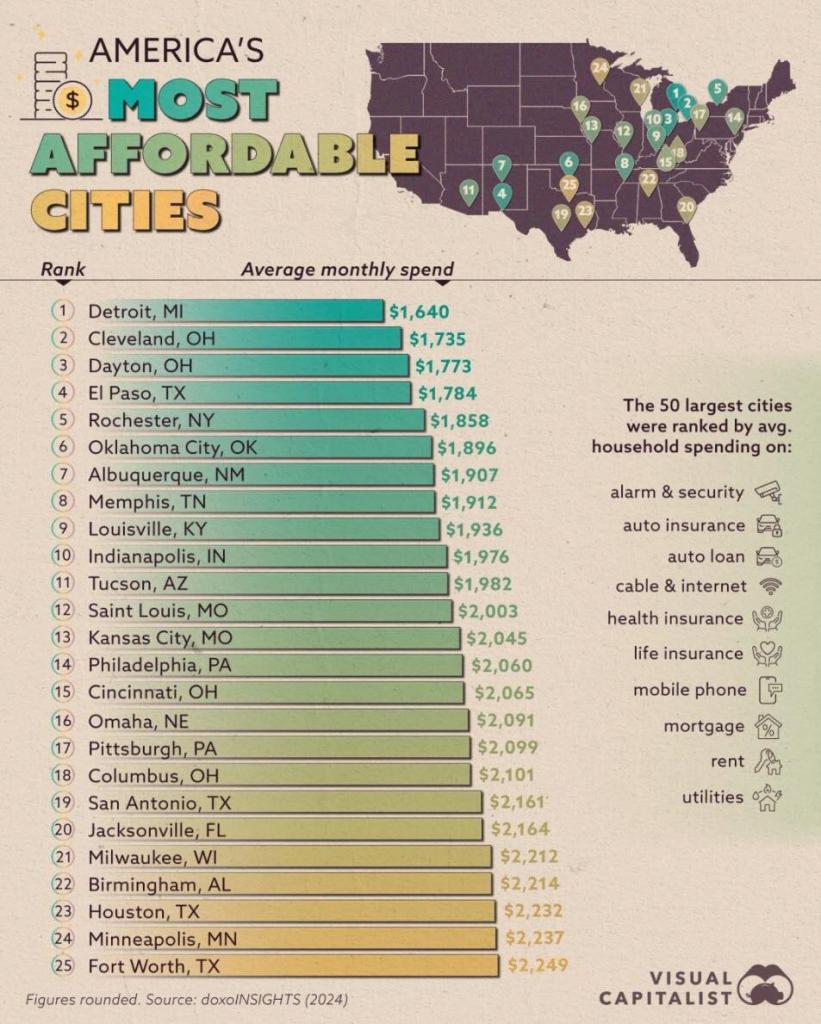
The Visual Capitalist calls most unaffordable cities as least affordable. San Jose California and New York City are the two most unaffordable cities in the USA. According to household spending.
Fortunately, I live in Columbus Ohio. the 18th most affordable city in the USA.
Much of the difference amongst cities is land use and construction restraints. And booming/dying local economies.
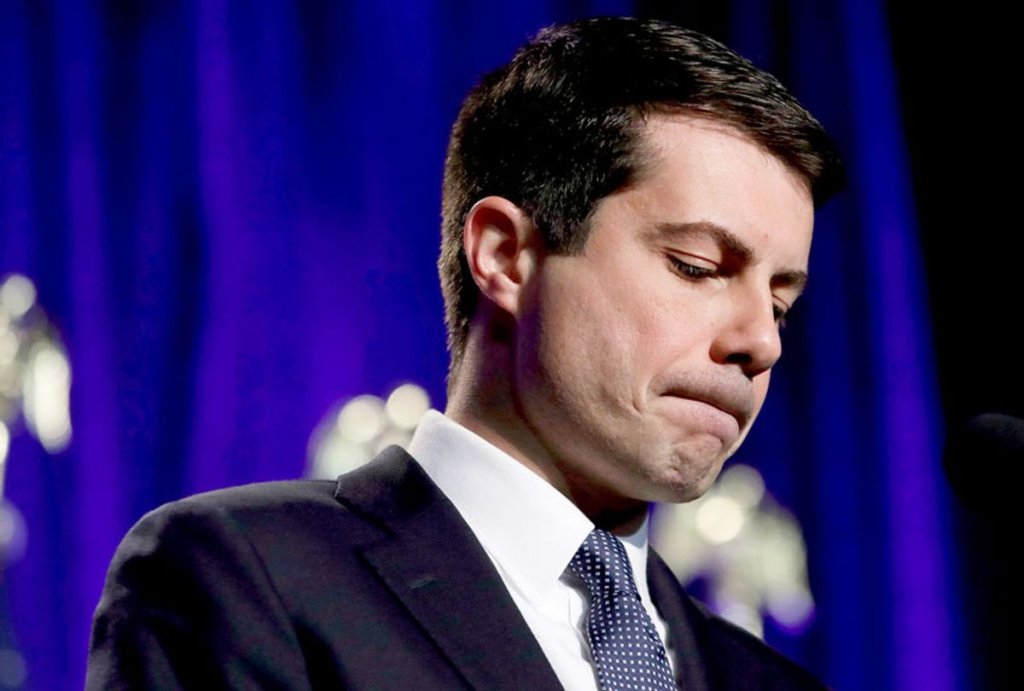
As a sad reminder about the last four years, Pete Buttigieg will leave his post as Transportation Secretary having spent $7.5 BILLION to build 8 EV charging stations.
I can’t wait for Billions Biden, The DC parasite who selectively shoves billions of dollars to his friends and nothing for the others. For example, bailing out the LA wildfires but stiffing the people of North Carolina and Florida for hurricane/flood damage. And funding Ukraine while real wage growth is negative. And heavy investment in green energy, the ultimate fool’s errand.
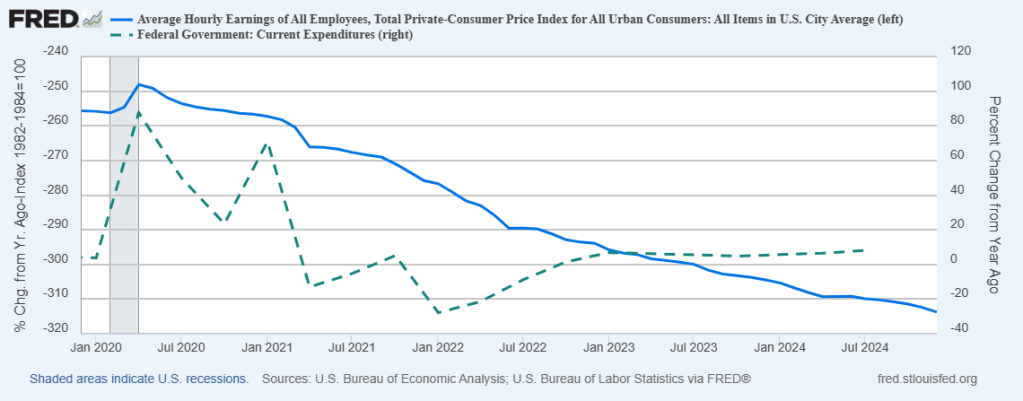
Let’s start with declining real wage growth under Biden/Harris (blue line). Meanwhile, Federal government spending (dashed green line) continues to grow causing inflation.
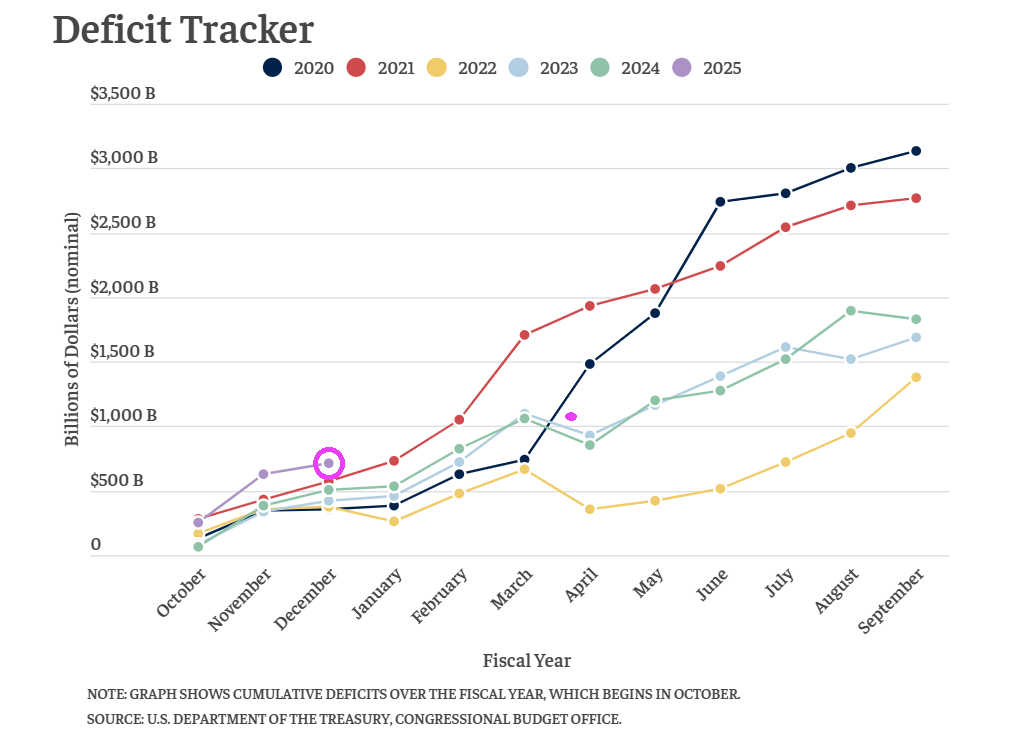
Meanwhile, Biden/Harris and Congress left Trump with the largest budget deficit in history. Like endlessly funding Ukraine and illegal immigration.
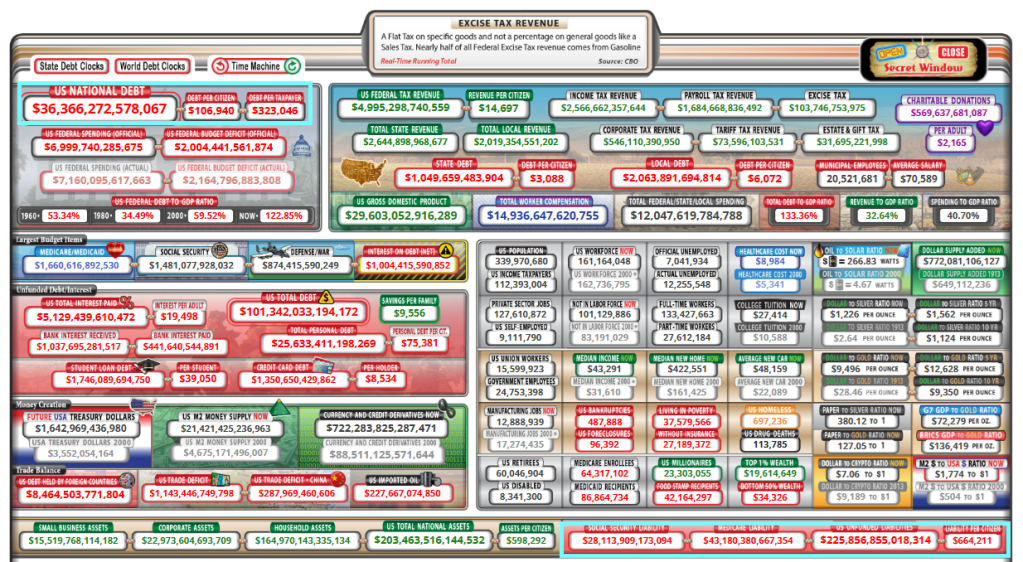
Leaving American taxpayers with growing Federal debt of $36+ trillion. And unfunded liabilities of $226 trillion, over 6 times the national debt.
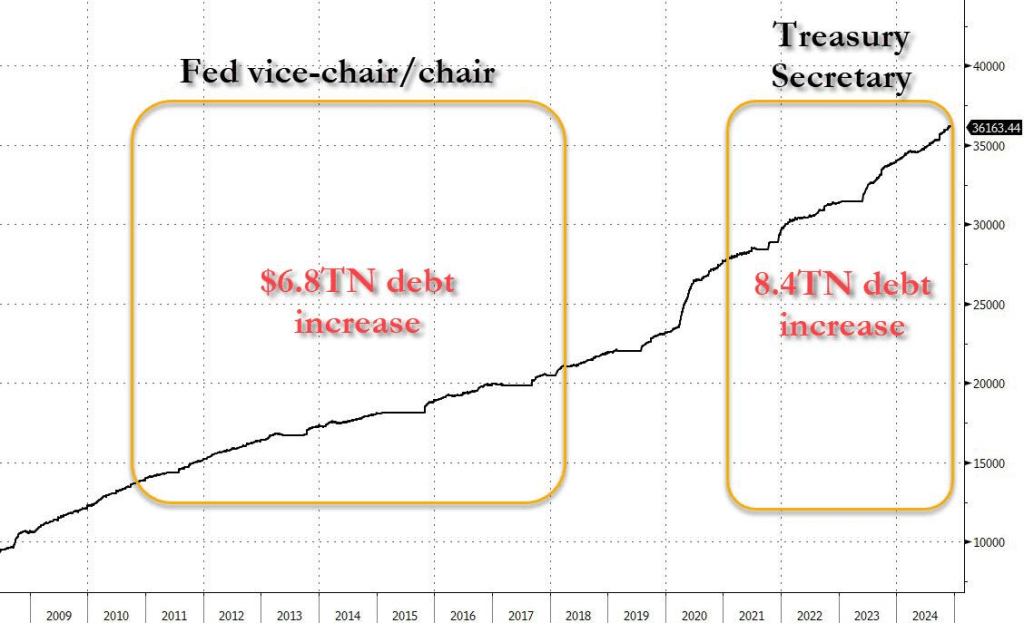
The US will hit its debt ceiling the day after President Trump is inaugurated, and Yellen said that the Treasury will launch “extraordinary measures” to stave off the threat of a national default. Bear in mind, Janet Yellen personally oversaw total debt increase by a staggering $15 trillion. Way to go, Janet!
I wonder how Trump’s Treasury secretary will handle this? At least better than Janet Yellen, I hope!


You must be logged in to post a comment.