The Mystery Of The Missing Housing Inventory For Sale (Elderly Americans Selling Less)

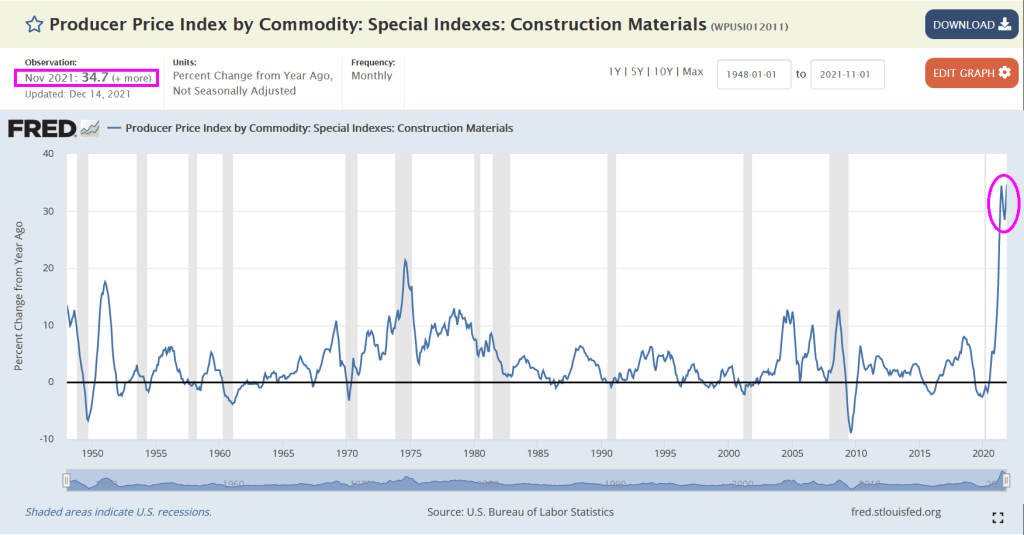
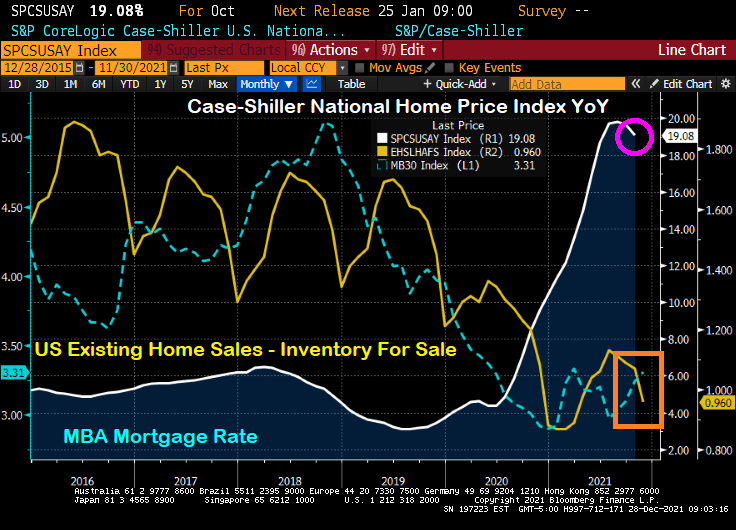
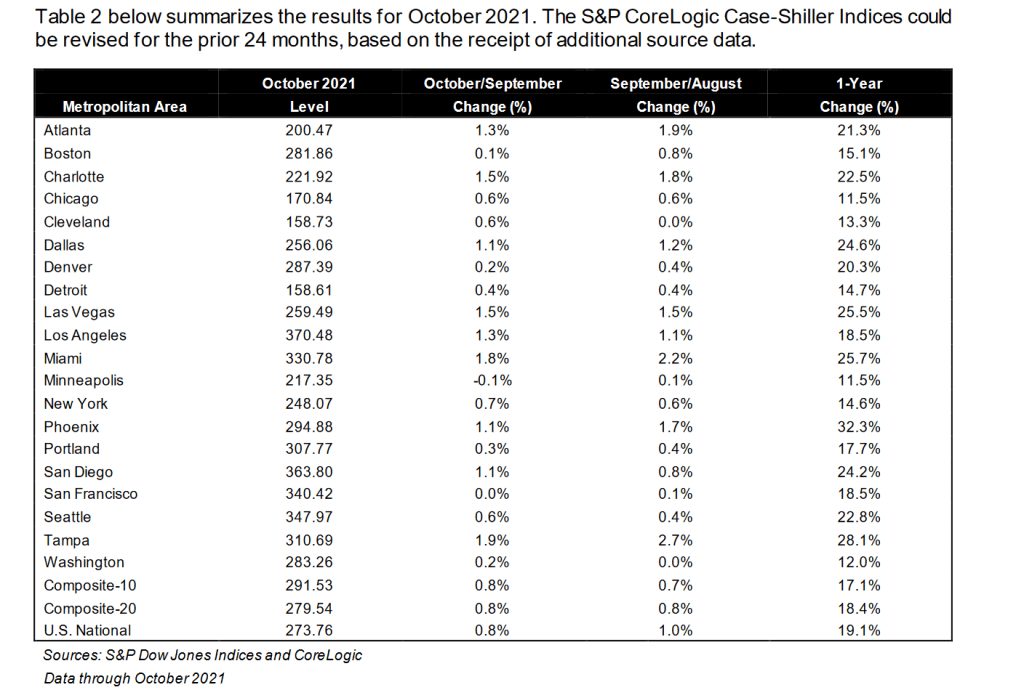
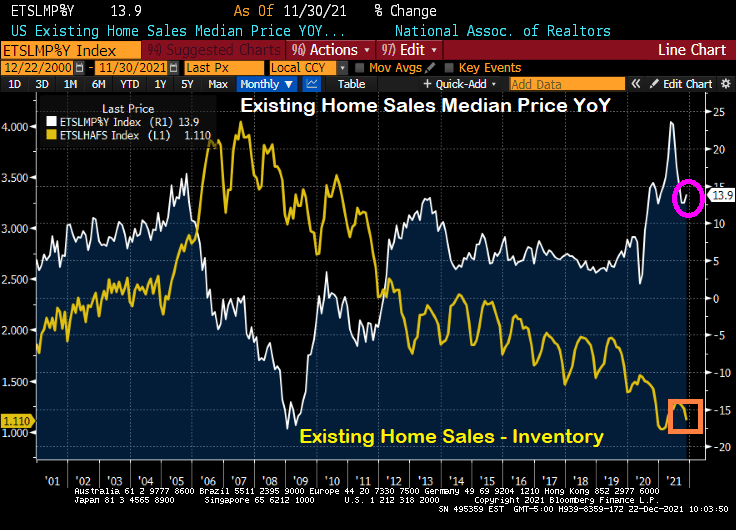
The inventory of existing homes for sale in the US is extremely low. The lack of available inventory to buy is helping drive home prices through the roof.

Available inventory for purchase peaked back in the 2007-2008 period during the dreaded housing bubble in the US. But inventory for sale has declined ever since. Why?

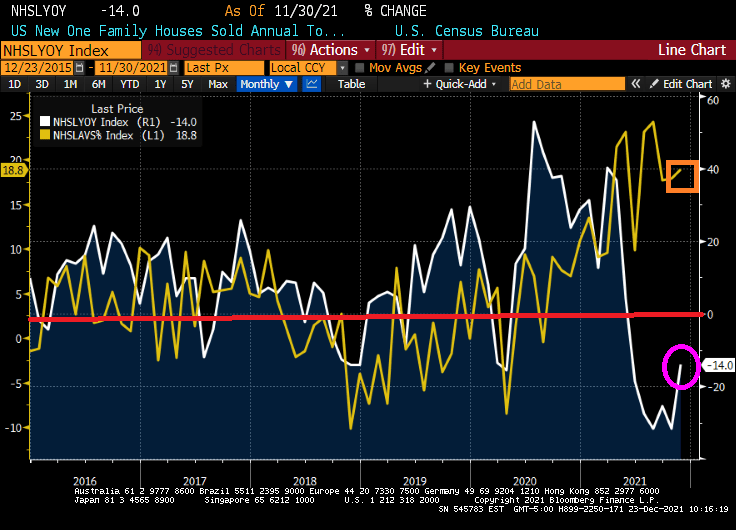
I think it has something to do with the aging of the US population. Look at this chart of Existing Home Sales Inventory against the growth 65+ years old.

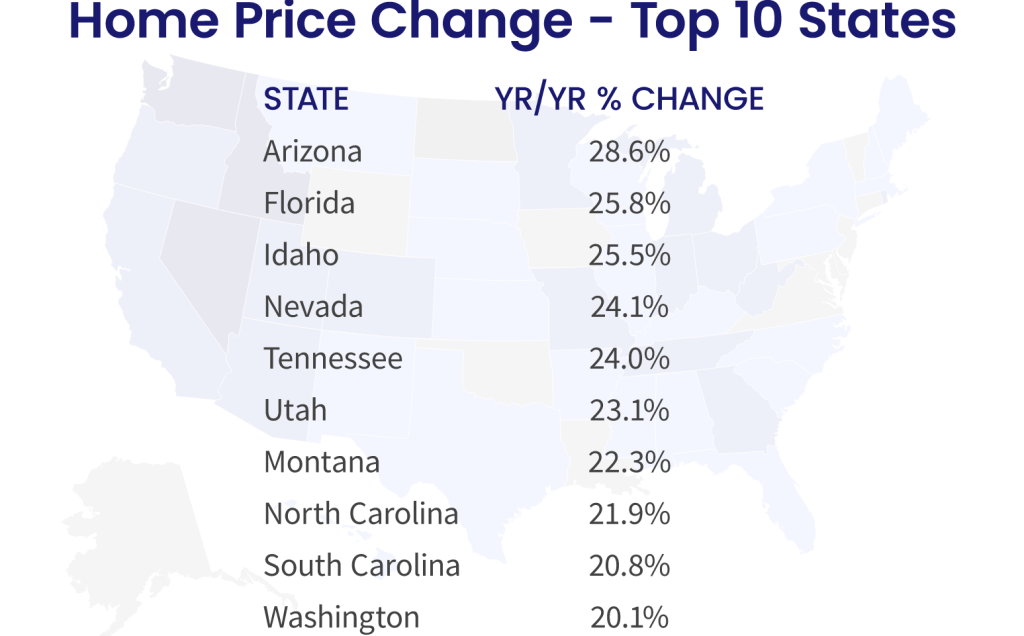
Perhaps households 65+ are resisting moving to states like Florida and Arizona as they had in the past, leaving them stationary in their dwelling.

Another reason for the bewildering lack of inventory is the growth of the HECM (Home Equity Conversion Mortgage) that allows elderly households to drain the equity in their home rather than have to sell to utilize it. But HECMs have not taken-off sufficiently to explain the mystery of the missing inventory.

So we know that housing inventory is very low and we know that the number of Americans 65 and over is increasing. But we do not know the reason for the decline in inventory.

Jack Guttentag has an excellent write-up in Forbes on the HECM. Particularly with rapidly growing home prices and equity.

CoreLogic: Home Prices Rise Record 18.1% In November (When Will Fed Take Its Foot Off The Pedal??)

  • Home price growth especially strong in Mountain West and Southeastern states
  • By November 2022, annual home price growth is predicted to slow to 2.8%

Yes, US home prices continue to rage with CoreLogic’s home price index rising 18.1% YoY.

Their forecast for 2022 is only 2.8% YoY likely due to forecast mortgage rate increases and fiscal stimulus wearing out.

Arizona, of course, is leading at 28.6% YoY. Florida is in second place followed by Idaho.

Slowdown? Let’s hope the slowdown doesn’t turn into a Matchbox and lead to declining home prices.

Bad Santa! 10Y Treasury Yields Jump Above 1.60% as Expectation Of Fed Hikes Grows (Mortgage Rates Expected To Rise)

Happy New Year! And Treasuries are off to fast start with investors bailing on Treasuries and buying stocks. AND the expectation that The Fed will raise rates 3 times this year.

The 10-year Treasury Note yield rose above 1.60% this morning.

And the US Treasury 10Y-2Y curve rose to 80.601 basis points.

Fed Funds Futures data is showing 3 rates hikes in 2022. May, September and December.

The Fed Dots project is definitely showing an upward trend in the Fed Funds Target rate with FOMC member forecasting the median target rate to be above 2% by 2024.

Of course, Fed reverse repo activity grew to an all-time high (but it is expected to pare-back).

How about mortgage rates? I expect mortgages rates to rise over 2022 as the 10-year Treasury Note rises.

While The Fed has been acting like Santa Claus with monetary easing since 2008, they are predicted to act like Bad Santas in 2022.

6 months of telling inflation in transitory stories. Now you know why.

What do you say to the Fed Open Market Committee that has resisted raising rates while inflation is the highest in 40 years?

Cautionary note: The Fed is likely to protect economic growth and ignore inflation. So I expect FOMC will continue to reinvest prepayments into Treasury and MBS, pro-rata to the current portfolio.

US Treasury Yield Curve Now Back Where It Stated With Biden At The Helm (Inflation Crushing America And The Yield Curve)

It has been almost a year since Joe Biden has been President of the United States and a Democrat majority took control of The House and Senate. And what has happened to the US Treasury yield curve slope over the past year?

The yield curve is back where it started. There was the “honeymoon effect” where the curve slope rose. After all, Biden was Obama’s Vice President for 8 years and The Democrats has promised so much in the 2020 election. But by early April, the reality of the massive Federal spending (combined with Fed Stimulypto) began showing what was feared: inflation (blue line) started to grow at a rapid rate of speed. With inflation now at 6.8% YoY,

In fairness to Biden, The Federal Reserve has been overstimulating the economy since The Federal Reserve since Ben Bernanke and the Fed Open Market Committee (FOMC) dropped the hammer on The Fed Funds Target Rate once the rate hit 5.25% in September 2007. They kept cutting it reached 25 basis points (or 0.25%) in December 2008. In August 2008, Bernanke and Company began their “Quantitative Easing” or asset purchasing programs. Between The Fed’s Target Rate and QE, The Fed has continued to overstimulate markets ever since. Under Biden, The Fed Funds Target Rate remains at 0.25% and The Fed’s Balance sheet has grown to $8.79 Trillion (bigger than the entire economies of Japan and Germany put together!).

How about housing? Home prices are growing at 19% YoY while rents are growing at 12.65% YoY.

Energy prices have risen dramatically under Biden. Gasoline is up 46% despite a slight reprieve recently. WTI crude prices are up 64%.

How about food? Beef prices are up 20% and chicken prices are up 10%.

On a positive note, the S&P 500 index has soared … thanks has soared during Biden’s term thanks to Fed stimulus and Federal spending on COVID.

The Build Back Better Act if passed (in its entirety or on a piecemeal basis) will lead to even MORE inflation.

Perhaps Biden’s spokesperson Jen Psaki can recreate the Biden Administration as a lovable, hilarious family like the comic strip Gasoline Alley with old Joe Biden as Skeezix. And insider-trading star, House Speaker Nancy Pelosi as the family matriarch.

Housing Inflation? Construction Materials Rising At 34.7% YoY In November While Median Price Of New Home Sales Rose 18.8%

Well, at least construction materials are growing more slowly than energy prices!

The Producer Price Index for Construction Materials rose at a 34.7% YoY pace in November.

So it is no surprise that the median sales price for new homes rose 18.8% YoY in November.

FOMO Housing Market: October Home Prices “Slow” To 19.08% YoY As Mortgage Rates Rise (Phoenix Fastest At 32.3% And Minneapolis And Chicago Slowest At 11.5%)

There is a lot going on in the US housing market. Excessive monetary stimulus keeping mortgage rates low, historically low inventory available for sale, and FOMO (fear of missing out … on rapidly rising home prices).

The Case-Shiller repeat sales index for October is out … and the national home price index “slowed” to 19.08% YoY as mortgage rates rose. Note that available inventory of homes for sales remains very low.

By metro area, Phoenix AZ once again leads with 32.3% YoY. Minneapolis MN is the slowest growing metro area in terms of home prices at 11.5% (tied with Chicago, IL).

A distant relative of Anthony Fauci.

The Great Distortion! Since COVID And Fed Hysteria, First Gold Then Bitcoin, Then Ethereum Surged While The US Dollar Declined Then Rallied

The global economy has certainly been turned on its head by the COVID outbreak in early 2020. Not so much by the virus itself, but by Central Bank hysteria in terms of rate lowering and balance sheet expansion. Which The Fed has not yet unwound.

Let’s look at what has happened since the mini-recession caused by COVID in early 2020. The shortest recession in US history, a measly 2 months. The Fed expanded its balance sheet from $4.17 million in February 2020 to $8.79 million today. That is, The Fed over doubled the size of their balance sheet in reaction to the shortest recession in US history. Overreaction much?

What has happened since the mini-recession and The Fed’s massive overreaction?

First, gold (gold line) surged then calmed down. Then cryptocurrency Bitcoin (while line) surged, then calmed down, then surged again only to calm down again. Then crypto Ethereum surged, calmed, surged, calmed. Meanwhile the US Dollar Index crashed only to start rising again.

The Fed’s overreaction and failure to withdraw excessive stimulus has led to the rise of alternatives to the deflating dollar due to inflation.

When will The Fed ACTUALLY start removing the overreaction stimulus? Let’s get it started.

Perhaps only April Ludgate can kill The Fed’s overreaction stimulus.

Simply Unaffordable! Housing Has Gotten More Unaffordable Over Past Year (Addicted To Gov)

Housing in the US is getting “simply unaffordable.” And it has gotten far worse over the past year. Thanks to BAD government policies.

While wage growth is positive, inflation is sucking the life from consumers. REAL average hourly earnings growth is -2.0133%. Even worse, home prices are rising at a 14.12% pace in REAL terms. So, wages are losing to inflation and housing is pulling away from renters in terms of affordability.`

This image has an empty alt attribute; its file name is realwagecs.png

So it is not surprising that the University of Michigan consumer survey for “Buying Conditions For Housing” remains below 100 (meaning that more people think buying conditions for housing are negative than positive). With the Case-Shiller National home price index growing at a 19.51% YoY pace, it is no wonder that consumers are getting scared of the housing market.

Yes, US inflation is at a 40-year high and the 30-year Treasury Inflation Protected (TIP) yields is at -0.424%. That says quite a bit about the pickle US consumers are in.

US consumer confidence overall has declined to the lowest level since just after the financial crisis and housing bubble burst of 2008-9.


Doctor, Doctor (Yellen), please don’t try to make housing more “affordable” which will result in housing being even LESS affordable.

But I do like how Biden took credit for lowering gasoline prices a little after his anti-energy policies drove up gasoline prices in the first place from $2.20 to $3.40 a gallon, a 55% price increase. Thanks for nothing, Joe!

And with Omicron raging (with few reported deaths), Anthony Fauci, President Biden’s top medical adviser, indicated support for making vaccinations a requirement for domestic fights.

More loss of personal freedom, more government control. We are truly addicted to gov.

US Existing Home Sales Rise In November While Median Price Rises 13.9% YoY Amidst Declining Inventory

While the Bureau of Labor Statistics uses a lame measure of house price inflation, US existing home sales MEDIAN PRICE YoY is growing at 13.9%.

US existing home sales rose by 6.46 million units SAAR, less than the expected 6.53 million units SAAR.

Where is the inventory increases that various talking heads were predicting would emerge? Maybe they meant SUBMERGE?

Here is a video of me looking for the increasing inventory.

Fed Reverse Repo Usage Rises to Record for Fourth Straight Day As Turkish Lira Volatility Hits All-time High And US Current Account Balances Rise To 2006 Levels

(Bloomberg) — The amount of money that investors are parking at a major central bank facility climbed to yet another all-time high as supply-demand imbalances continue to dog U.S. dollar funding markets. 

Eighty-one participants on Monday placed a total of $1.758 trillion at the Federal Reserve’s overnight reverse repurchase agreement facility, in which counterparties like money-market funds can place cash with the central bank. That surpassed the previous record volume of $1.705 trillion from Dec. 17, New York Fed data show.

Demand for the so-called RRP has climbed further as principal and interest payments from government-sponsored enterprises has entered short-end funding markets. However, that cash is expected to exit the overnight space by the end of the week as the Treasury ramps up its issuance of Treasury bills now that Congress has increased the debt limit. 

Overall volume has been rising this year as a flood of cash continues to overwhelm the U.S. dollar funding markets due to central-bank asset purchases and the drawdown of the Treasury’s cash account, which is pushing reserves into the system. The larger takeup looks set to persist even as the Fed tapers its asset-purchase program — something it began this month — because the supply-demand imbalances in short-end securities are likely to persist.

Then we have the Turkish Lira volatility hitting an all-time high.

And finally we have the US Current Account Balance rising to levels last seen in 2006 just after the peak of the US housing bubble.

Mele Kalikimaka!