Fed Talk,Talk! Mortgage Applications SURGE 56% WoW As Treasury Yields Tank (Purchase Apps Spike 28% WoW)

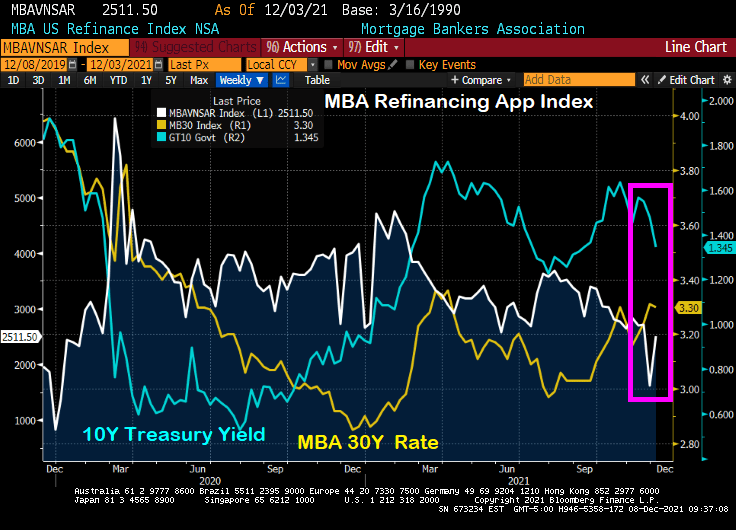
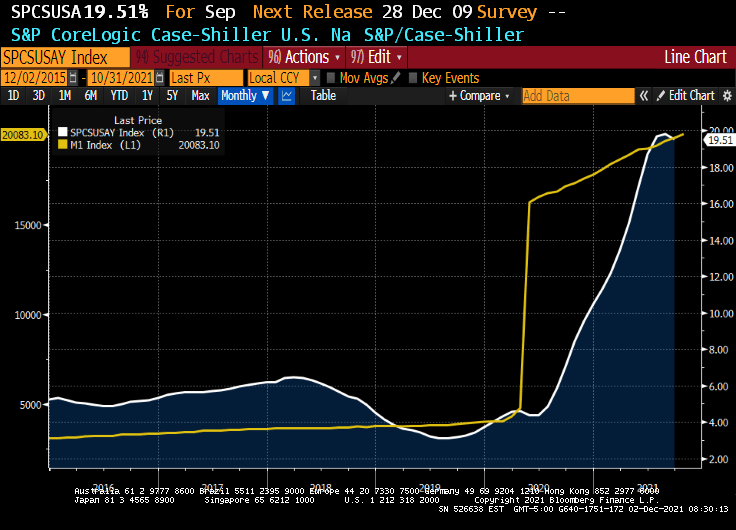
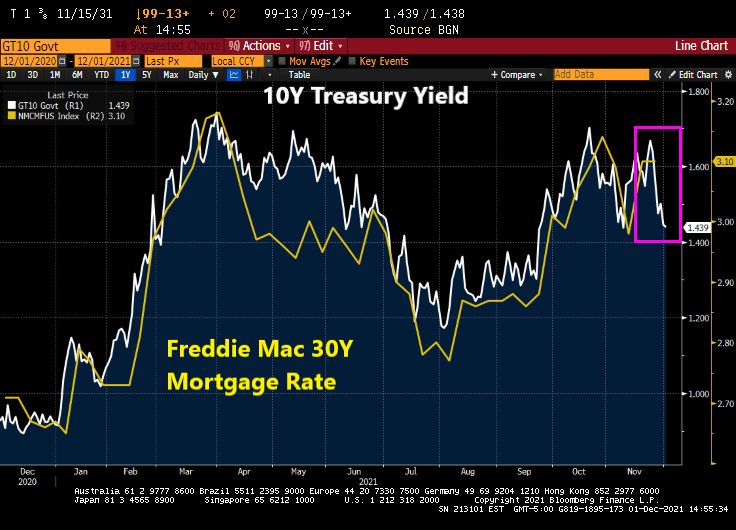
Despite the “Talk, Talk” from The Federal Reserve about balance sheet taper and rate “normalization,” we actually saw the 10-year Treasury yield fall from 1.6651% on 11/23/2021 to 1.343 on 12/3/2021. While the 30-year mortgage rate only fell from 3.31% to 3.3%, it is the SIGNAL that The Fed is sending that people should refinance their mortgages ASAP.

You can see the rise in mortgage refinancing applications of 56% week-over-week (WoW) (white line) with the drop in the 10-year Treasury yield (blue line) despite the relatively small drop in the Mortgage Bankers Association (MBA) tiny drop in their 30-year mortgage rate index.

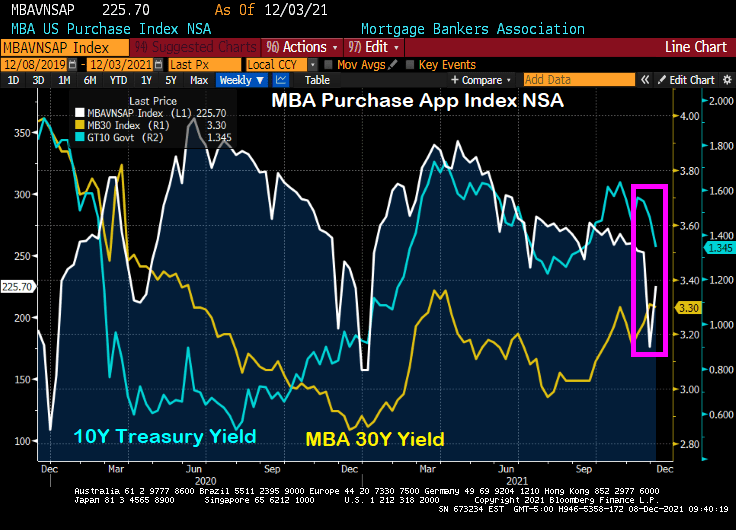
Ditto for the MBA mortgage purchase application index. The drop in the US Treasury yield (blue line) resulted in a 28% WoW increase in mortgage purchase applications.

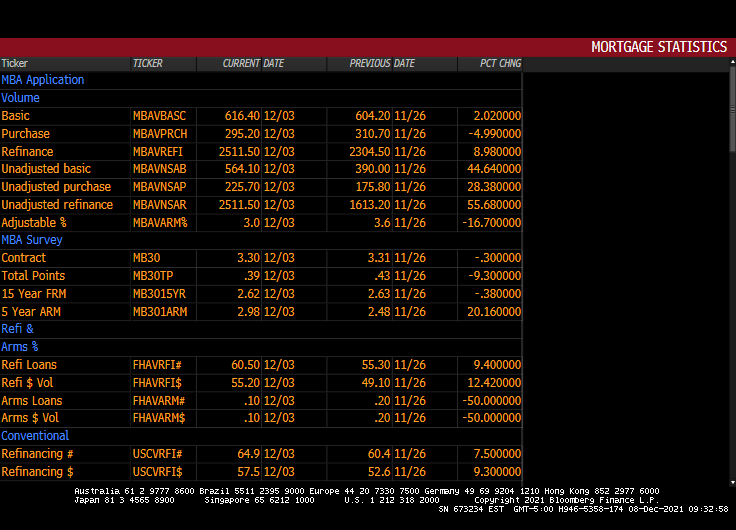
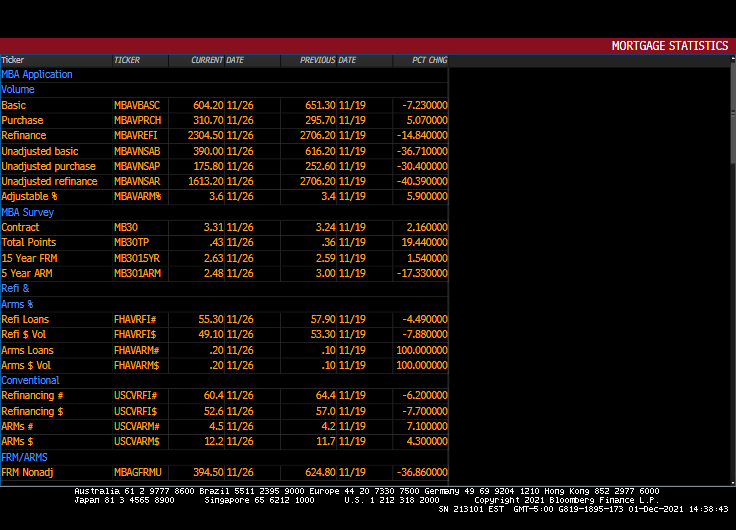
Here is the table of MBA data for the week of 12/03.

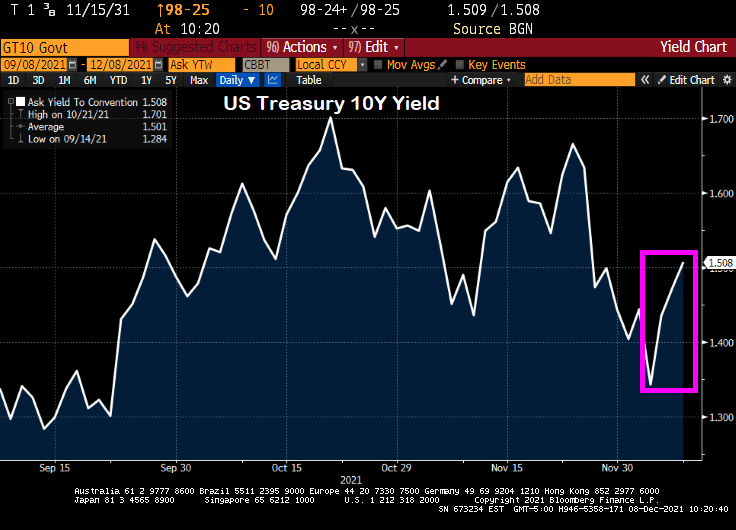
Please note that the 10-year Treasury yield have jumped since 12/03 indicating that mortgage application activity for the week of 12/10 will be lower.

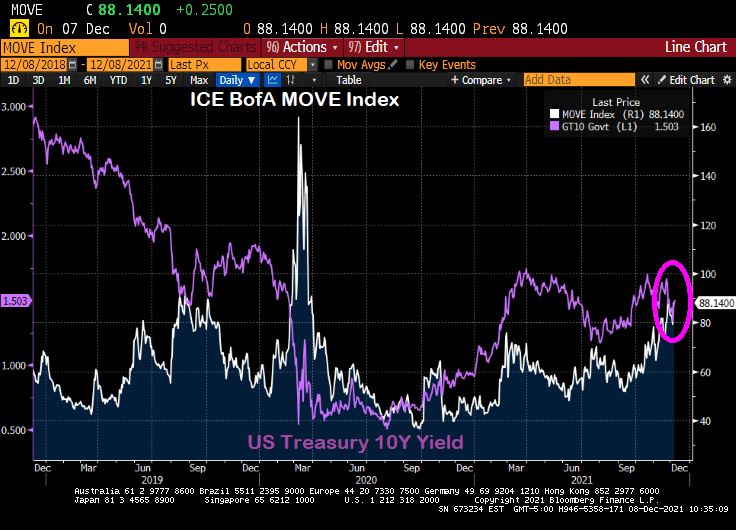
Here is the MOVE bond volatility index and the US Treasury 10-yield chart. Can you spot the COVID outbreak??

Here is a video of Fed Chair Jay Powell doing “Talk, talk” about tapering.

Annual U.S. Home Price Growth Hits 18% in October (Highest In Non-California West And Florida, Lowest In DC, NY And Illinois)

National home prices increased 18% year over year in October 2021, according to the latest CoreLogic Home Price Index (HPI®) Report . The October 2021 HPI gain was up from the October 2020 gain of 7.4% and was the highest 12-month growth in the U.S. index since the series began in 1976. The increase in home prices was fueled by low mortgage rates, low for-sale supply and an influx in homebuying activity from investors. Projected increases in for-sale supply and moderation in demand as prices grow out of reach for some buyers could slow home price gains over the next 12 months.

The non-California west (Arizona, Idaho, Utah, Nevada) and Florida have the strongest price growth while Washington DC has the slowest growth YoY.

Other “escape to” states like Vermont, Tennessee, North and South Carolina are also showing 20%+ rates of growth while the “escape from” states of Illinois, Louisiana, New York, and North Dakota are showing low growth as in 5-10% YoY.

Waiting for you in Florida!

Powell, Yellen Say They Underestimated Inflation And Supply Snarls (M1 Money Grew At 369% With Rates Near Zero Since COVID And They Didn’t See Inflation Coming???)

The Dream Team (Fed Chair Jay Powell and Treasury Secretary Janet Yellen) just can’t believe that inflation struck even after M1 Money Stock increased by 369% from March 2020 to today while interest rates remained near zero.

From The Hill: Federal Reserve Chairman Jerome Powell and Treasury Secretary Janet Yellen on Wednesday said they underestimated how quickly the U.S. economy would rebound from the COVID-19 recession and strain supply chains.

During a Wednesday hearing before the House Financial Services Committee, the top two U.S. economic policymakers acknowledged that high inflation has risen higher and lingered much longer than they expected.

“We understood demand would be strong,” Powell said. “We didn’t understand [the] significant problems of the supply side.”

Both Yellen and Powell said substantial fiscal and monetary stimulus played a role in stoking the higher demand that fueled inflation, but they called it a challenging side-effect of an otherwise fast recovery.

Seriously? The Fed and the Federal government dumped trillions of dollars into an economic system and didn’t think there would be negative consequences??

Look at the surge in M1 Money Stock at the same time asset-backed commercial paper rates are 0.08%. That is, about 1/3rd The Fed Funds Target rate (upper bound). None of this concerned The Dream Team?

An example of what The Dream Team didn’t see happening was the explosion of home prices. Home price growth was about 4% YoY prior to COVID, and is now 19.51% YoY.

Now we have the US Treasury Actives curve inverting like the US Dollar Swaps curve after 20 years.

Here is a composite photo of Jay Powell and Janet Yellen (to save space). Here is a video of Powell/Yellen composite trying to control inflation.

US Mortgage Refinancing Applications Index PLUNGES 40.3% WoW (Purchase Apps Index Plunges 30.4%)

Its that time of year for mortgage purchases applications! Purchase applications usually decline during December and start to rise after the beginning of the year.

Mortgage purchase applications (white line) dropped -30.4% from the previous week, not usual for December. But what is surprising is the drop in REFINANCING applications: down -40.3% from the previous week.

30-year mortgage rates rose 2.16% from the previous week.

But between Omicron (or as the French say, “Oh! Macron!”) and The Federal Reserve, there is a good chance that mortgage rates will fall this week putting a quick end to refi application plunge.

Purchase applications? Nope, it is that time of the season when purchase applications drop like a rock.

US Home Prices “Slow” To +19.51% YoY In September (Phoenix AZ Sizzles At +33.1%, Chicago Slowest At 11.8%)

When I told Benzinga’s Phil Hall in an interview a while back that I thought US home price growth would slow, I didn’t consider the never-ending COVID epidemic (now with the Omicron Variant taking the stage. But at least the CoreLogic Case-Shiller National home price index (HPI) “slowed” in September from +19.84% to +19.51%.

Once again, low available inventory of houses for sale coupled with outlandish Fed stimulus has resulted in a housing crisis where home price growth (+19.51%) exceeds hourly wage growth (+5.76%) by almost 4x.

Where are all the home prices above 10% YoY? Every one of the 20 metro areas covered by Case-Shiller. Phoenix AZ leads at +33.1%. Chicago IL is the “slowest” at 11.8%.

Although Columbus OH is the growth hub of the state, Case-Shiller only reports Cleveland. So here is Columbus’s all-transactions home price growth for Q3: +16.2% YoY placing Columbus at the top of the midwest metro areas of Detroit, Chicago, Minneapolis and Cleveland.

With the latest Omicron Variation (sounds like a Star Trek TV show episode), I will bet that The Fed will stay a little longer and keep rates low, leading to home price growth (with limited available inventory) to continue to grow at double digit speeds.

The Fed is printing SOOOO much money that the dollar should have a double eagle on it.

U.S. Pending Home Sales Rebound (+7.5% MoM) To Highest Level Of The Year, BUT 5th Straight Month Of Negative YoY)

A forward-looking gauge of U.S. home purchases rebounded in October to a 10-month high, signaling steady housing demand despite growing affordability concerns among many prospective buyers.

The National Association of Realtors’ index of pending home sales increased 7.5% from a month earlier to 125.2, according to data released Monday. The median estimate in a Bloomberg survey of economists called for a 1% advance.

But it is the fifth straight month of year-over-year declines.

Low mortgage rates and solid job growth have supported housing demand this year as pandemic-weary buyers seek more spacious accommodations. Existing home sales are on track to exceed 6 million in 2021, which would be the strongest in 15 years, Lawrence Yun, NAR’s chief economist, said.

Yes, humongous stimulus from The Federal Reserve will help push existing home sales to exceed 6 million in 2021.

Still, competition over a scant number of listings — particularly on the lower, more affordable end of the resale market — has pushed prices out of reach for many prospective buyers. Builders have struggled to fill the void as supply-chain delays and labor shortages upend construction schedules, exacerbating the inventory crunch

Yes, inventory of homes available for sale is almost 1/3rd of the homes available in 2010.

Ten years after ... and we have progressively less inventory available.

How The Banking Crisis And Covid Lockdowns Killed Money Velocity (Death Of King Dollar)

I have written numerous times about nothing has been the same since the housing bubble burst and ensuing financial crisis of 2008. The crisis led to bank bailouts (TARP) and banking legislation (Dodd-Frank) giving The Federal Reserve even more power. And then the COVID lockdowns led to even MORE power for The Fed. And a horrid decline in money velocity (the ability of printing money to increase economic growth … or GDP).

But let’s take one step backwards. One the causes of the housing bubble that burst was President Clinton’s infamous National Homeownership Strategy that encouraged “partners” with the Federal government to soften underwriting standards for mortgage lending, particularly for minority households. The intent was to increase the homeownership rate in the US and it worked! Too well. Along with increasing the homeownership rate came rising home prices, culminating with home price growth reaching 14.5% YoY in September 2005. Only to start slowing to a crash.

Of course, the housing bubble was associated with no/low documentation and subprime mortgage lending. But the relaxing of underwriting standards by the National Homeownership Strategy helped fuel the no/low doc and subprime lending crisis. But weakening underwriting standards to increase homeownership rates is a dangerous strategy.

Note the surge in M1 Money Velocity (GDP/M1) starting in 1994. M1 Velocity grew until Q4 2007, then crashed along with home prices. The second and more sudden crash in M1 Velocity occurred with the COVID outbreak in March 2020 and the ensuing economic lockdowns and the intervention of The Federal Reserve in terms of money printing. M1 Money surged 173% from October 2008 to February 2020 and then another 369% from March 2020 to today. THAT is a Fed Storm Surge!!

M2, the broader definition of money, has not grown as rapidly as M1, but it still grew at an alarming rate. Atlanta Fed President Raphael Bostic blamed inflation on COVID but not The Fed’s insane money printing or government lockdowns. C’mon man!

Finally, the banking crisis (and TARP bailouts) along with COVID have made consumer purchasing power of King Dollar even worse.

Be careful of government strategies to make housing more “affordable” because they seem to make housing more expensive and can help crash the financial system.

Renter Misery Index At 17.42% With Traditional Misery Index At 10.80% (Biden Says $5 TRILLION “Build Back Better Boondoggle” Will Relieve Inflation Over 10 Years)

Renters in the US are getting clobbered by inflation.

The US Zillow Rent Index All Homes YoY + CPI YoY is one measure of renter misery.

The classic misery index (CPI YoY + U-3 unemployment rate) is 10.80%.

Then there is inflation in food prices, gasoline, heating oil, natural gas, etc.

While Biden is releasing the Strategic Petroleum Reserves (SPR) in order to mitigate the problem that he created by terminating the energy pipelines and oil/natural gas drilling permits in the name of “Going Green!” But on the announcement of tapping the SPR, crude oil futures actually rose.

But never fear! Biden claims that his $5 TRILLION Build Back Better Boondoggle (BBBB) will ease inflation … over 10 years. And he claims that “17 Nobel Prize winners in economics have said that my plan will “ease inflationary pressures.”” I sincerely doubt that any of them actually read the 2,500 page BBBB. Rather, they likely just read the White House talking points and said “Hey, that sounds good!” Mo money, less problems?

Here is Joe Biden breaking the legs of America’s renters. Or is that multi-millionaire Nancy Pelosi?

Home Sales Rose 0.8% MoM In October As Investors Rushed Into The Market (Inventory Remains Thin, Median Price +13.1% YoY)

Fools rush in … or at least investors rush into the US housing market. Investors made up 17% of existing home purchases in October.

Inventory of homes remains depressed and with investors picking up 17% of homes for sale, the median price of existing homes rose to 13.1% YoY.

While existing home sales rose 0.8% MoM, they fell -5.79% on a YoY basis as M2 Money slowed.

It is lonesome town for inventory. But it will be a poor little fool for those buying into this thin inventory market if home prices correct.

President Biden has decided to nominate Fed Chair Jerome Powell for a second term in an effort not to rock the boat. Lael Brainard is nominated for Deputy Chair.

Bernie’s & Biden’s Build Back Better Bill Balloons To $5 TRILLION From $2.4 TRILLION (More Than Biden’s Quote Of $0)

To quote Gomer Pyle USMC, “Surprise, surprise, surprise!”

The humongous spending bill awaiting Joe Manchin to sign off on it will cost almost double what the CBO said it would. Why? Because spending programs in Washington DC never get cancelled, they only grow.

The Committee For A Responsible Federal Budget estimates that the true cost of Build Back Better is $4.91 TRILLION, up from the stated $2.39 TRILLION. Once they assumed that the programs don’t sunset and get extended.

According to their analysis,

“We estimate the House Build Back Better Act includes roughly $2.4 trillion of spending and tax cuts along with roughly $2.2 trillion of offsets.However, the bill relies on a number of sunsets and expirations to keep the official cost down. If the plan’s temporary policies were made permanent, we find the cost would increase by as much as $2.5 trillion.As a result, the gross cost of the bill would more than double from $2.4 trillion to $4.9 trillion.

The Build Back Better Act relies on a number of arbitrary sunsets and expirations to lower the official cost of the bill. These include extending the American Rescue Plan’s Child Tax Credit (CTC) increase and Earned Income Tax Credit (EITC) expansion for a year, setting universal pre-K and child care subsidies to expire after six years, making the Affordable Care Act (ACA) expansions available through 2025, delaying the requirement that businesses amortize research and experimentation (R&E) costs until 2026, and setting several other provisions – from targeted tax credits to school lunch programs – to expire prematurely.

Excluding changes to the state and local tax (SALT) deduction, we estimate the Build Back Better Act would cost $2.1 trillion as written. We estimate making all of these temporary policies permanent would cost roughly $2.2 trillion, more than doubling the gross cost of the bill to $4.3 trillion through 2031.”

When asked about the Center for a Responsible Budget saying the bill could be twice as expensive, Manchin replies “it’s concerning. Sure. It’s concerning.”

Surprise, surprise, surprise! And it is certainly more expensive than the estimate Biden gave: $0.