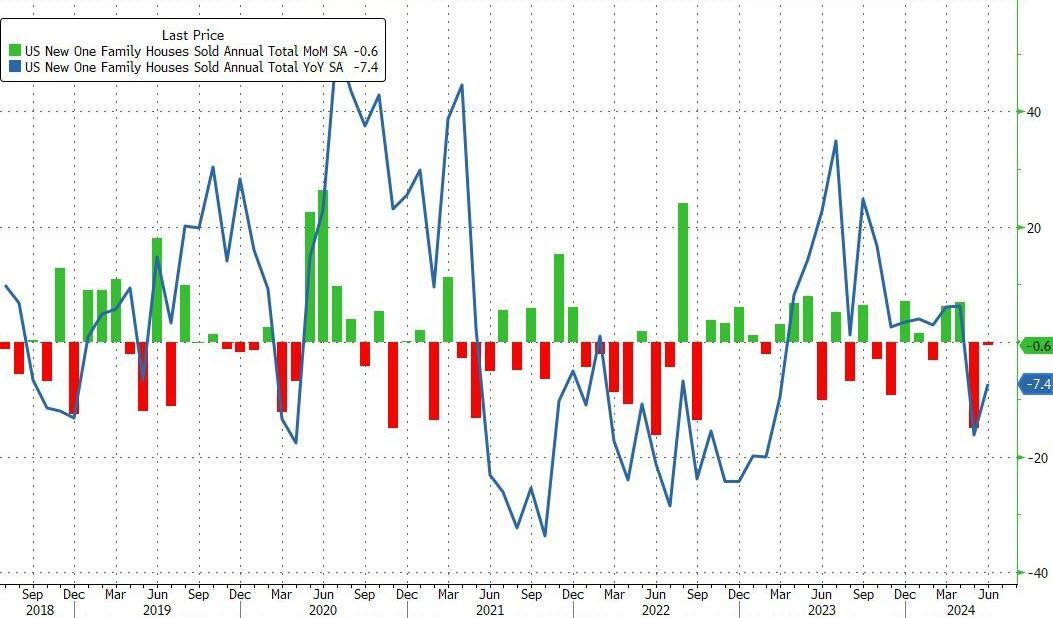
After a disappointing dump in existing home sales in June, new home sales just confirmed the slowdown, dropping 0.6% MoM (notably below the 3.4% MoM expected) and also saw a major downward revision in May from -11.3% MoM to -14.9% MoM. That leaves new home sales down 7.4% YoY…
Source: Bloomberg
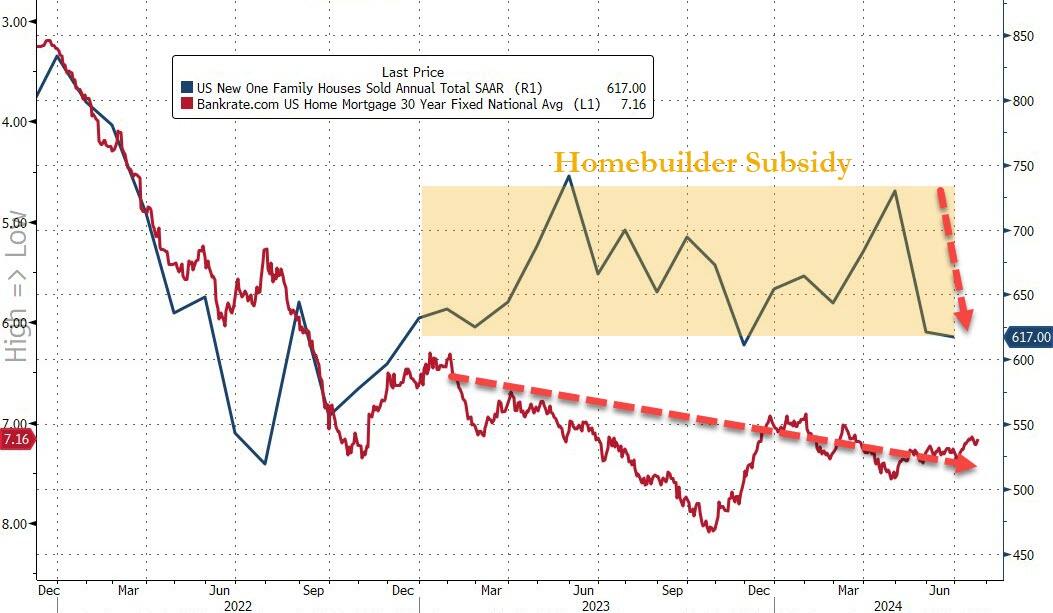
That shift dragged the new home sales SAAR down to 617k – basically unchanged since 2016…
Source: Bloomberg
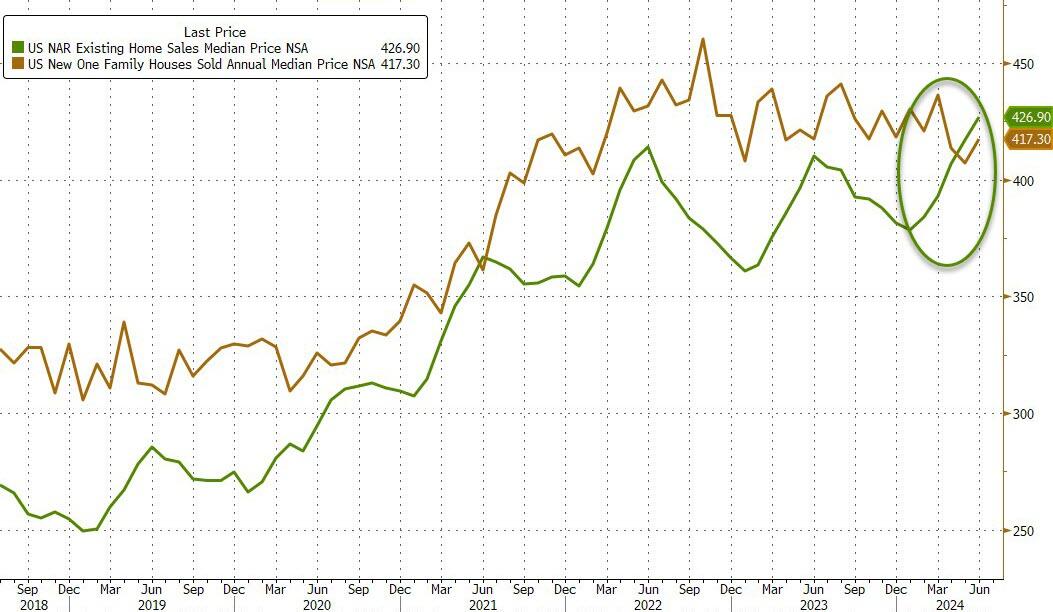
While the median new home price rose in June, it remains below the median existing home price…
Source: Bloomberg
It appears the homebuilder subsidy fad is wearing off as mortgage rates show no signs of easing significantly…
Source: Bloomberg
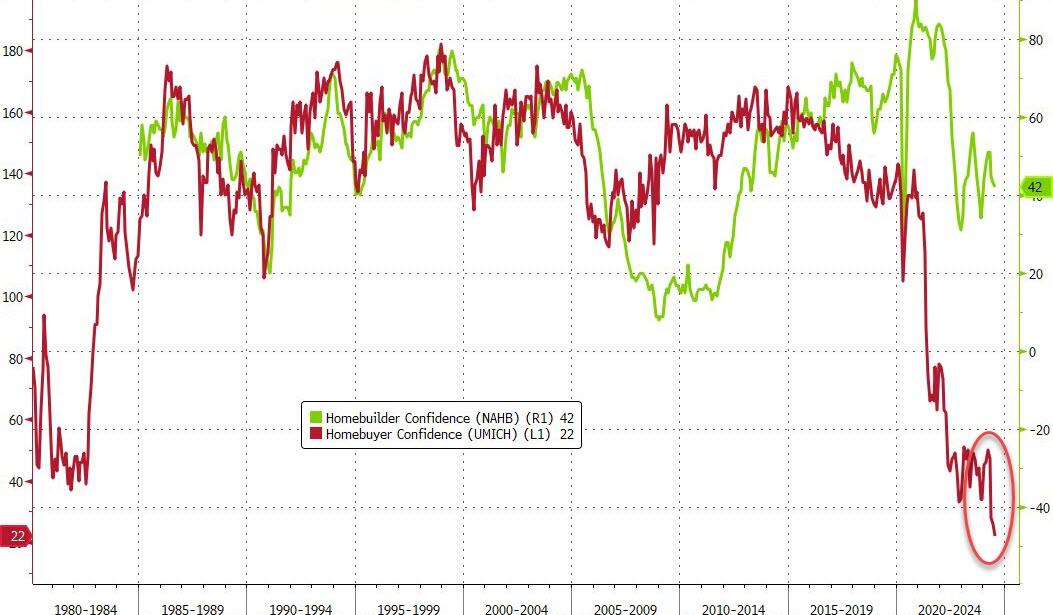
Of course, none of this should be a surprise as homebuyer confidence has collapsed to an all-time record low…
Source: Bloomberg
Will cutting rates help?
Probably not. Bidenomics is now called Harrisnomics (or Cacklenomics) since Harris as VP was the tiereaker in the US Senate. So, she holds some responsibility for the outrageous, wasteful spending in Washington DC.
Here is a chart of Non-commerciak net positions for US Treasuries, currently showing more bailing out of Treasury positions. Has the world sours on DC’s fiscal train wreck and The Fed?
Of course, budget deficits are a disaster with Biden/Congress spending like drunken sailors in port and showing no signs of letting up. The good news? At least a court struck down Biden’s illegal cancelation of student debt (a desperate attempt to win votes). That would have spiked the budget deficit.
As I pointed out yesterday, the UNFUNDED entitlements promised by the Federal government are now larger than that total national assets (business, household). In other words, if the US liquidated ALL assets, they couldn’t pay off the UNFUNDED entitlements. And good luck taking away the entitlements!
President Biden was expected yesterday to propose a cap of 5% on annual rent increases for tenants of major apartment landlords, and he did. Whether it can happen is something else.
As the White House communicatedon Tuesday, the administration is looking for Congress to pass legislation for landlords with more than 50 units in their portfolios, that being the proxy for institutional owners, although it would also affect private investors, family offices, and others that might own at least that many units. According to administration calculations, the total pool would cover 20 million rental units.
The law would then give landlords a choice. They could either restrict annual rent increases to no more than 5% a year or they would forfeit the ability to take fast depreciation of rental housing. There would be an exception for new construction or “substantial renovation or rehabilitation.”
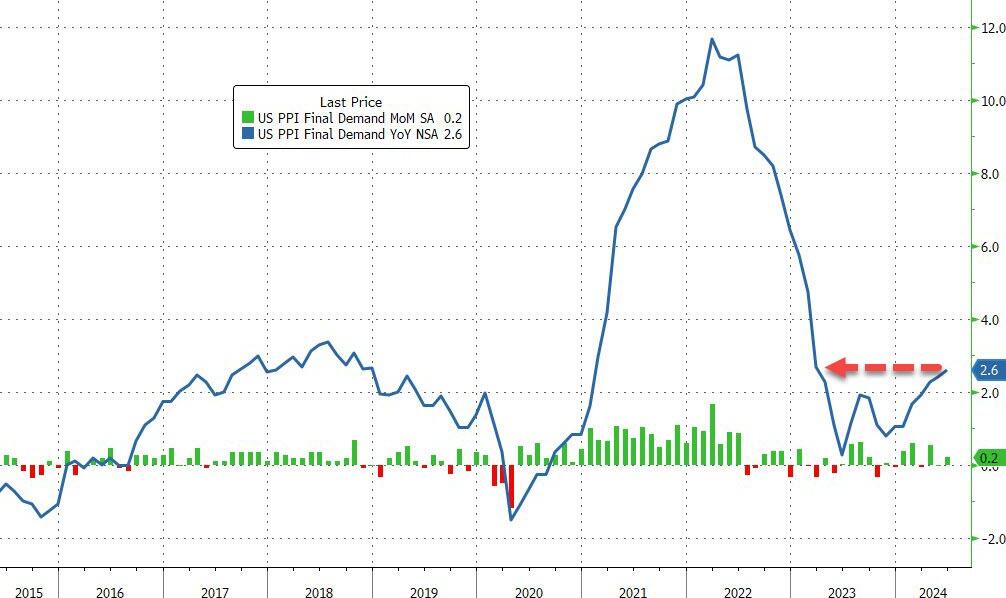
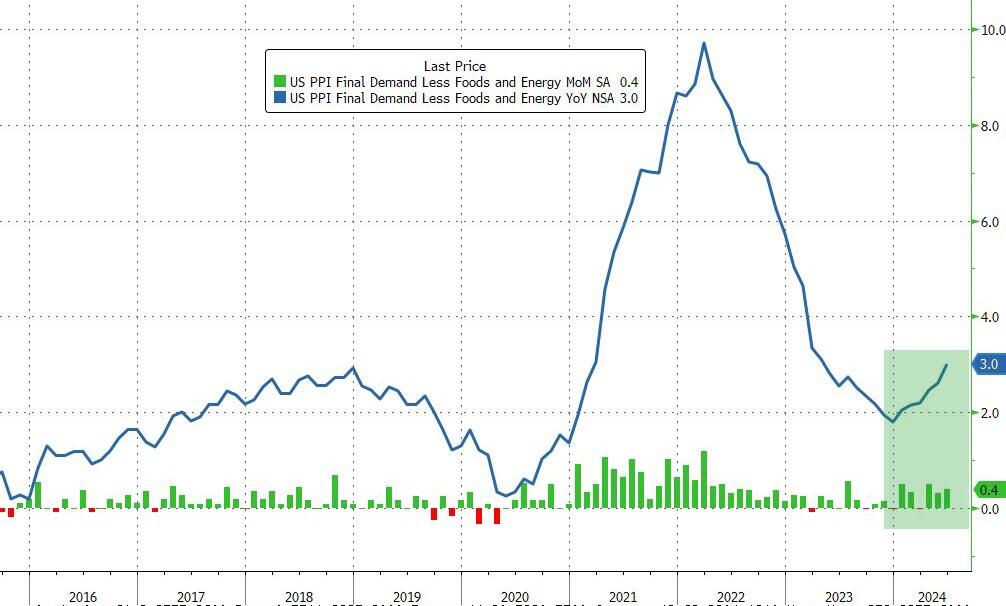
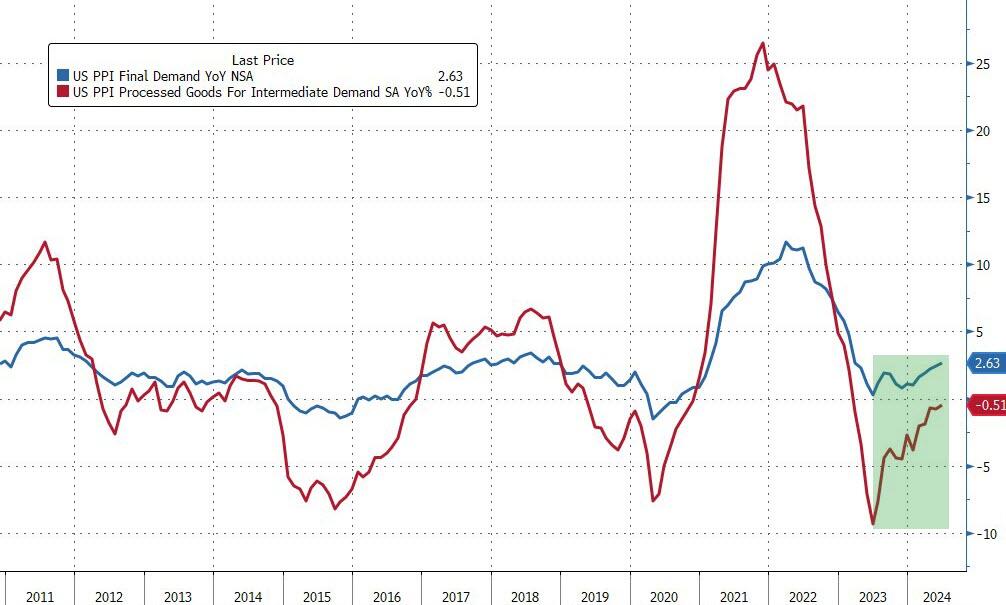
Core PPI rose by 0.4% MoM (double the 0.2% exp), sending the YoY price rise up by 3.0% (also the hottest since March 2023)…
Source: Bloomberg
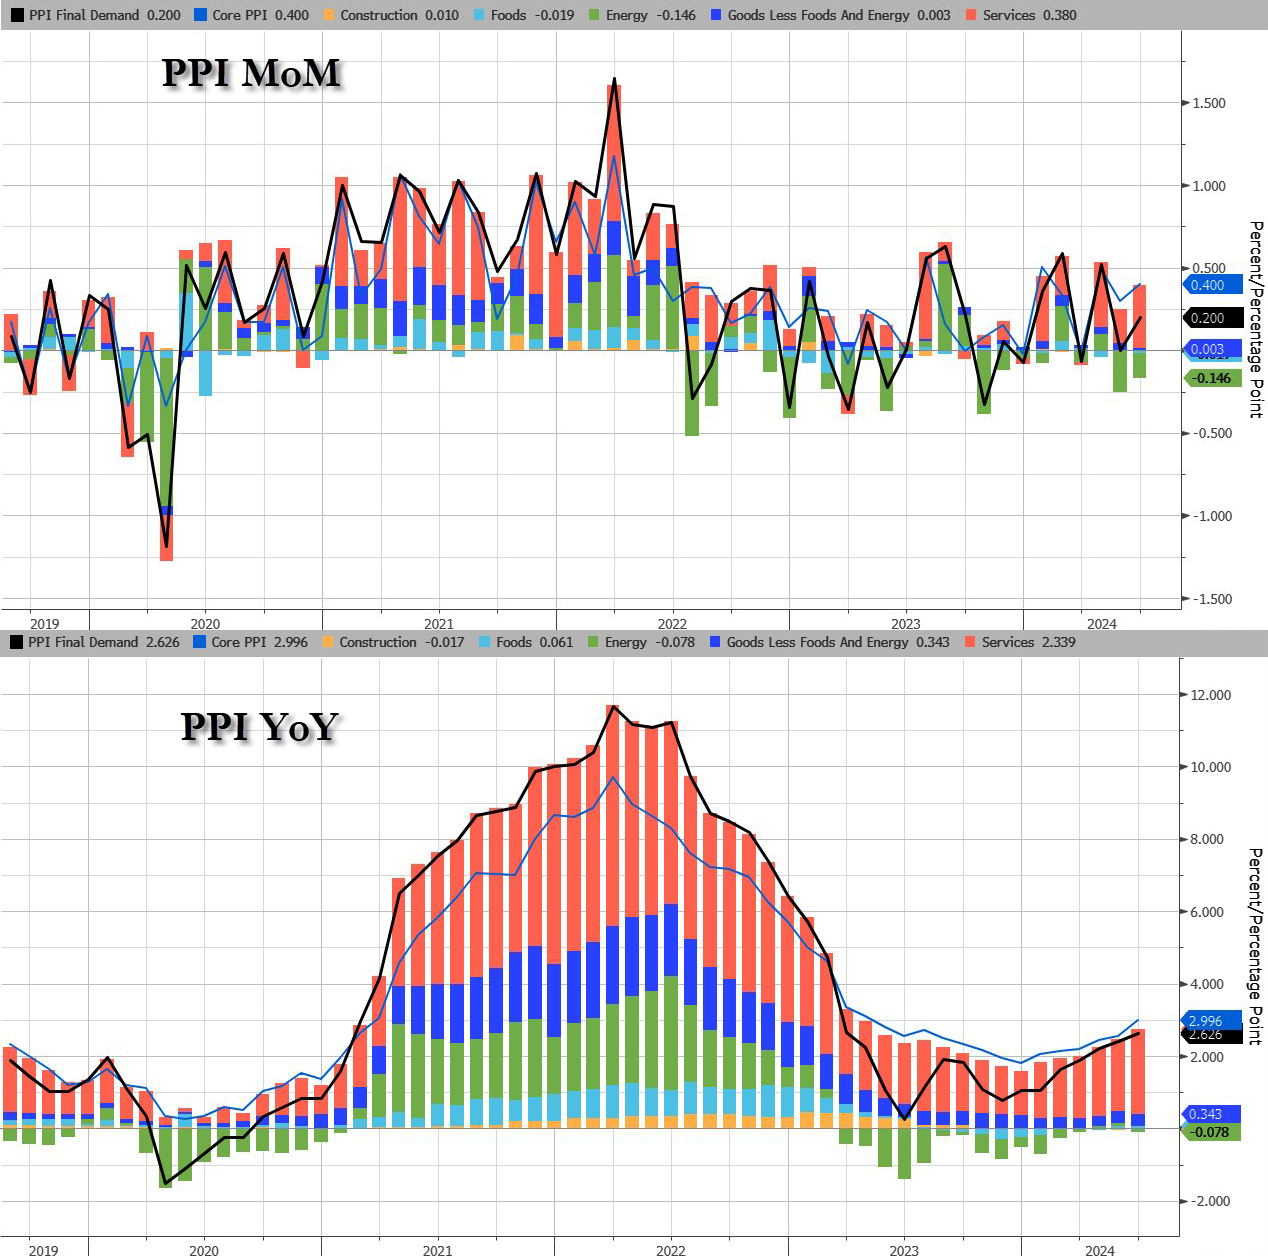
The jump in PPI was driven by a resurgence in Services costs as Energy remains deflationary (for now)…
Source: Bloomberg
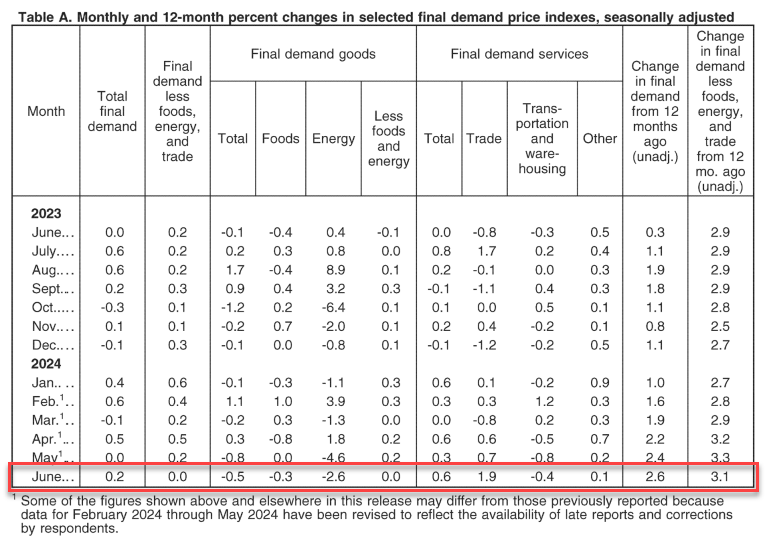
The June rise in the index for final demand can be traced to a 0.6-percent increase in prices for final demand services. In contrast, the index for final demand goods decreased 0.5 percent
Perhaps worse still, the pipeline for PPI (intermediate demand) is accelerating…
Source: Bloomberg
On the housing side, buying conditions for housing tanks to all-time low.
Are you ready? You can tell an election is on the radar since inflation numbers are settling down for the most part. According to the BLS, overall inflation fell slightly in June to 3.0%.
Shelter CPI is up 5.14% YoY as M2 Money growth has been rising slowly … again.
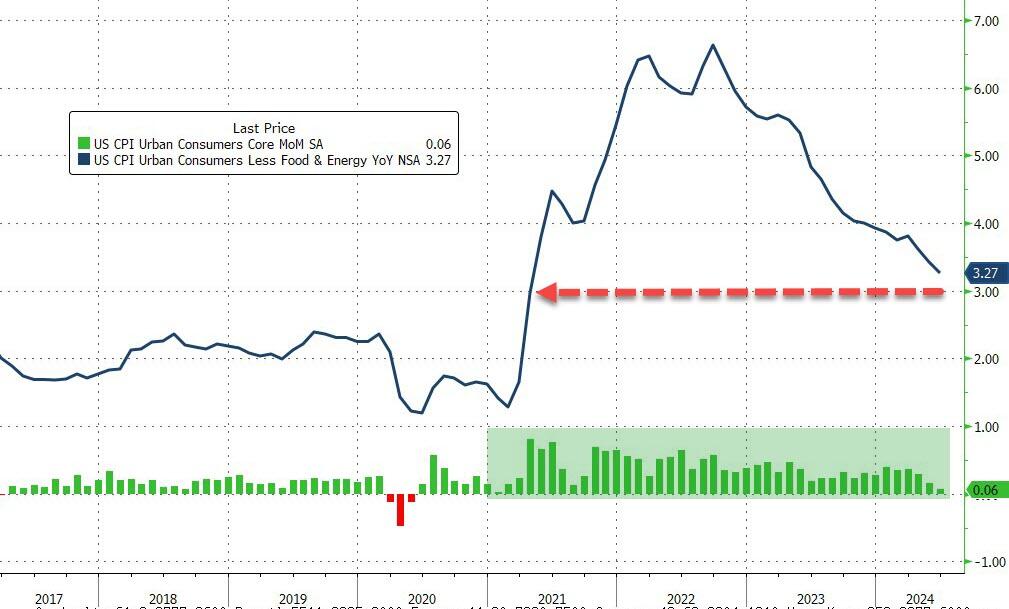
Core CPI also ‘missed’, rising just 0.1% MoM (vs +0.2% exp), dragging the YoY Core CPI down to +3.27% – its lowest since April 2021…
Source: Bloomberg
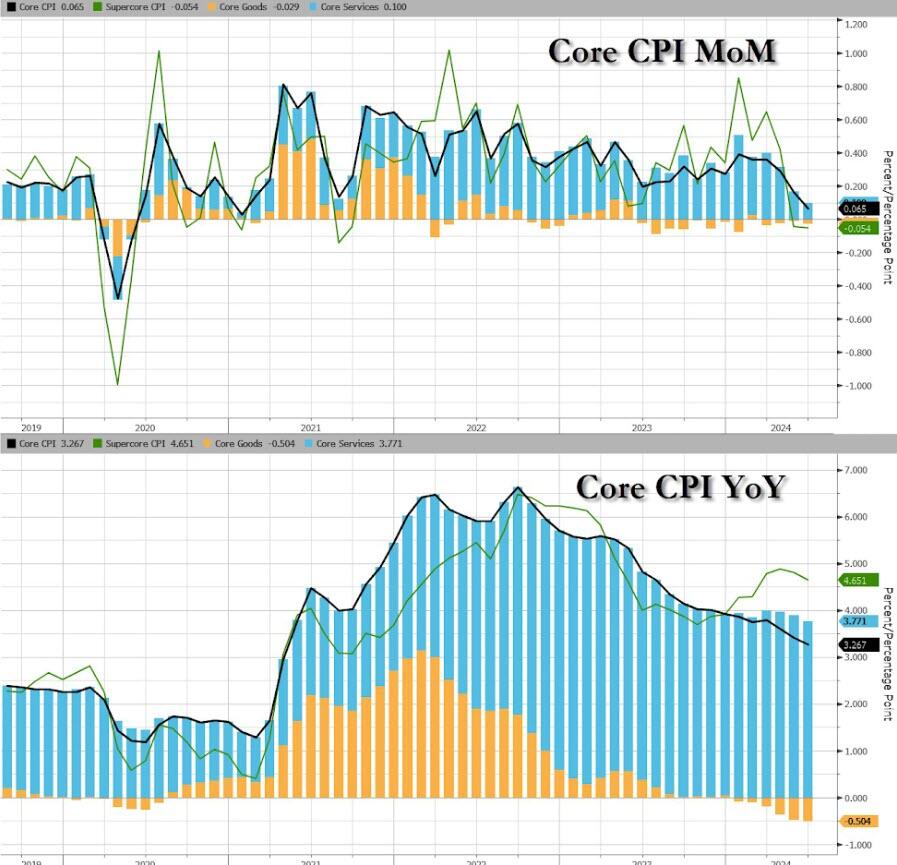
Goods deflation also dominates core prices disinflationary trend…
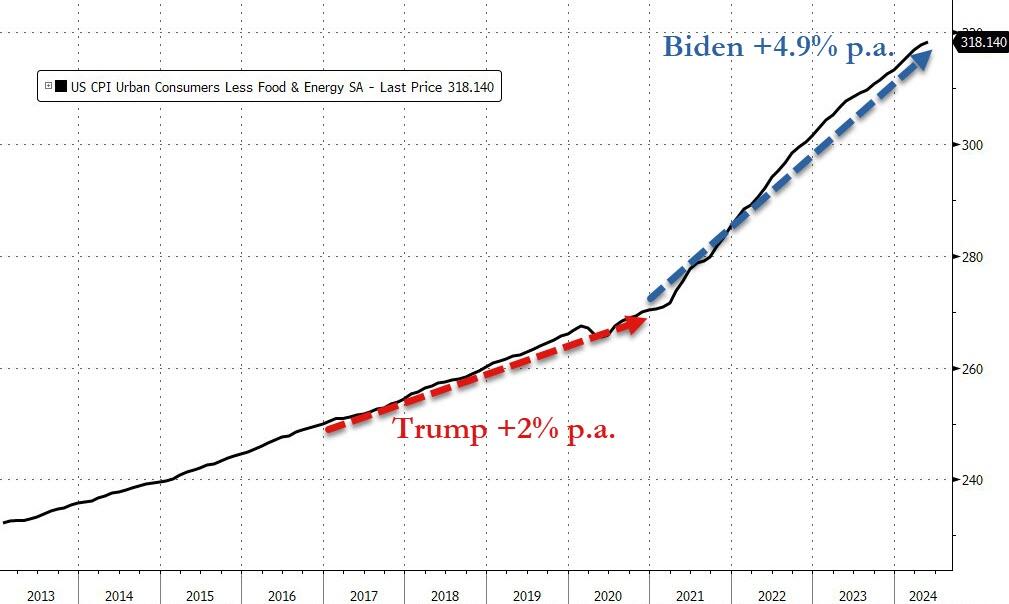
We do note that Core consumer prices have still not seen a single monthly decline since Bidenomics began.
Core consumer prices are up just under 18% since Bidenomics began (+4.9% per annum) – that is dramatically higher than the 2.0% per annum Americans experienced under Trump…
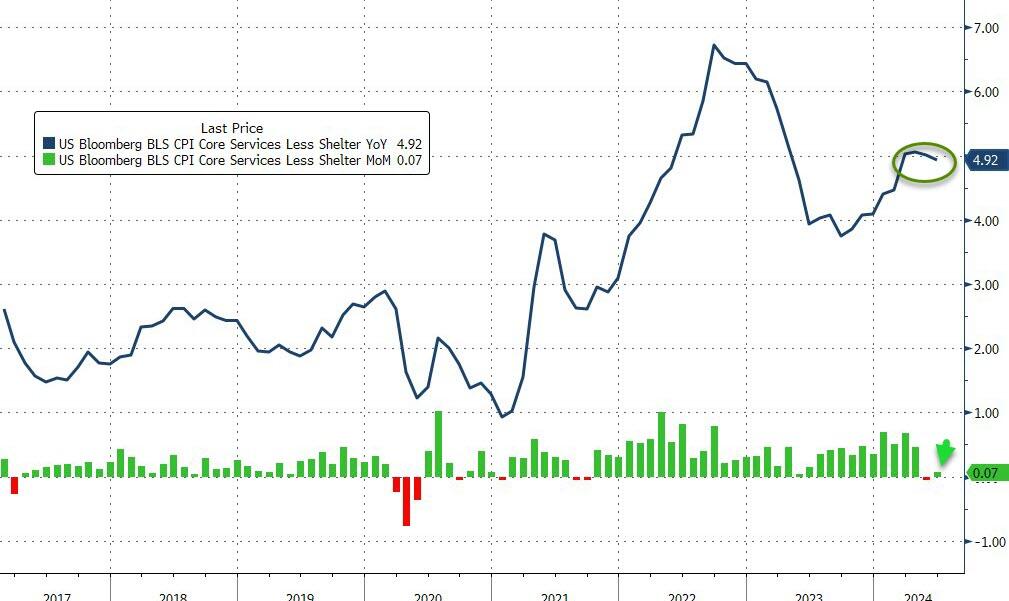
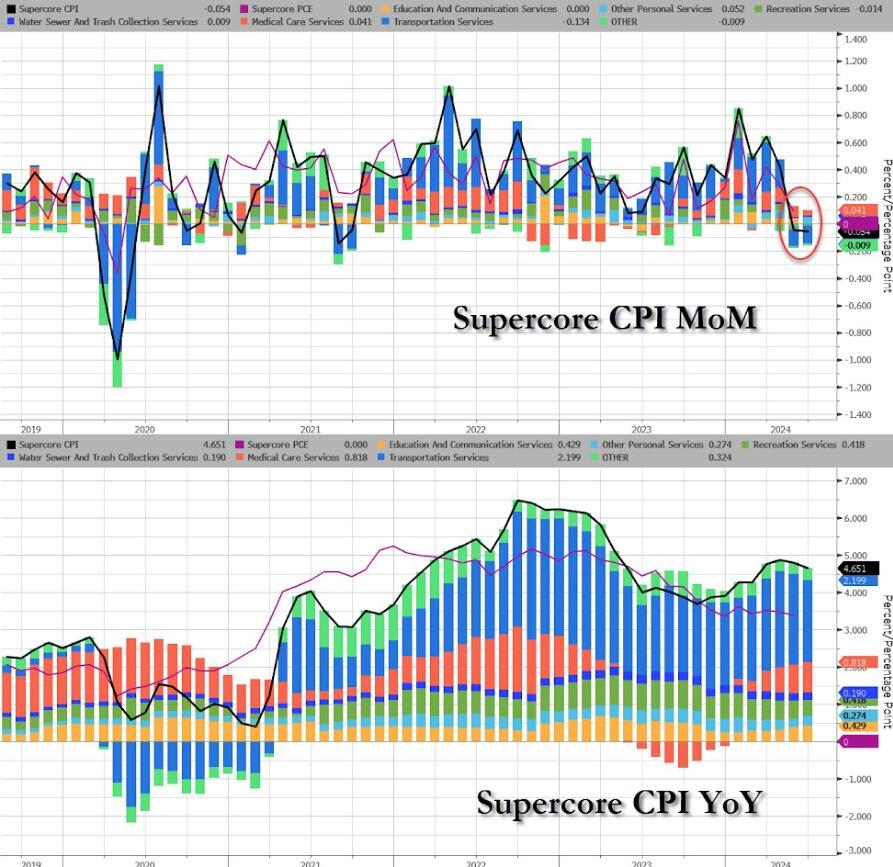
The much-watched SuperCore CPI rose on a MoM basis but declined (back below 5.0%) on a YoY basis (but obviously remains extremely elevated)…
Source: Bloomberg
Transportation Services are seeing prices fall…
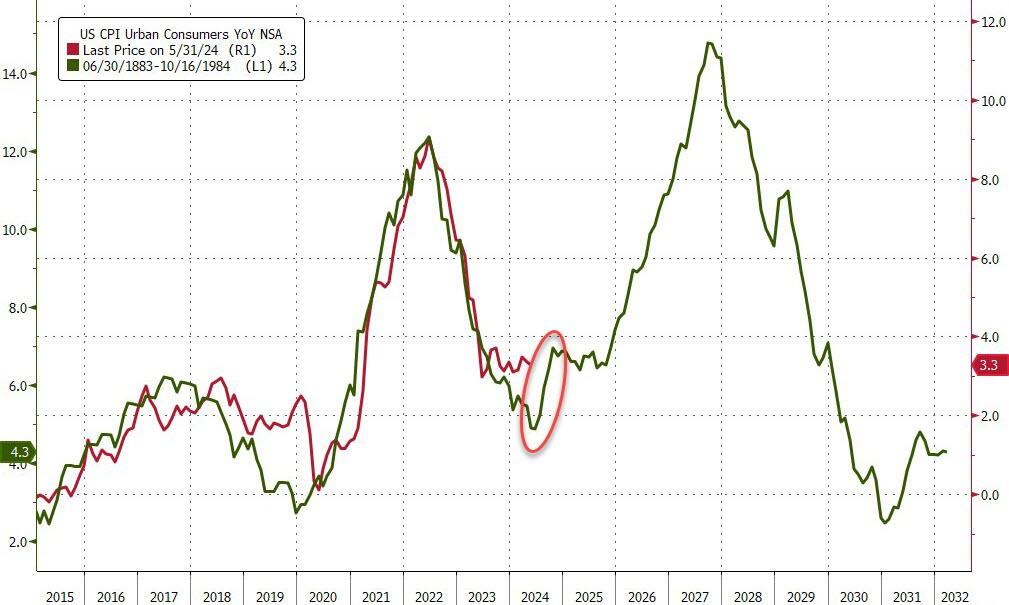
Finally, we can’t help but get a sense of deja vu all over again here. What if… The Fed cuts (because bad – recession – data), Biden loses (because dementia), and inflation re-accelerates (just like in the 80s)…
Source: Bloomberg
Challenger job cuts in construction we the highest since 2008 putting downward pressure on wages.
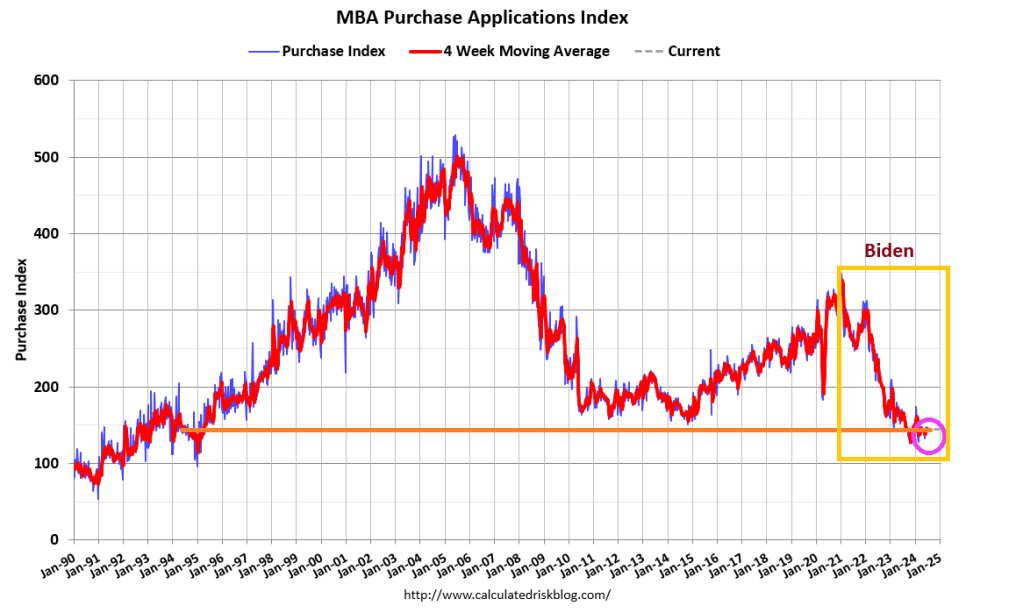
Mortgage applications decreased 0.2 percent from one week earlier, according to data from the Mortgage Bankers Association’s (MBA) Weekly Applications Survey for the week ending July 5, 2024. Last week’s results included an adjustment for the July 4th holiday.
The Market Composite Index, a measure of mortgage loan application volume, decreased 0.2 percent on a seasonally adjusted basis from one week earlier. On an unadjusted basis, the Index decreased 20 percent compared with the previous week. The seasonally adjusted Purchase Index increased 1 percent from one week earlier. The unadjusted Purchase Index decreased 19 percent compared with the previous week and was 13 percent lower than the same week one year ago.
The Refinance Index decreased 2 percent from the previous week and was 28 percent higher than the same week one year ago.
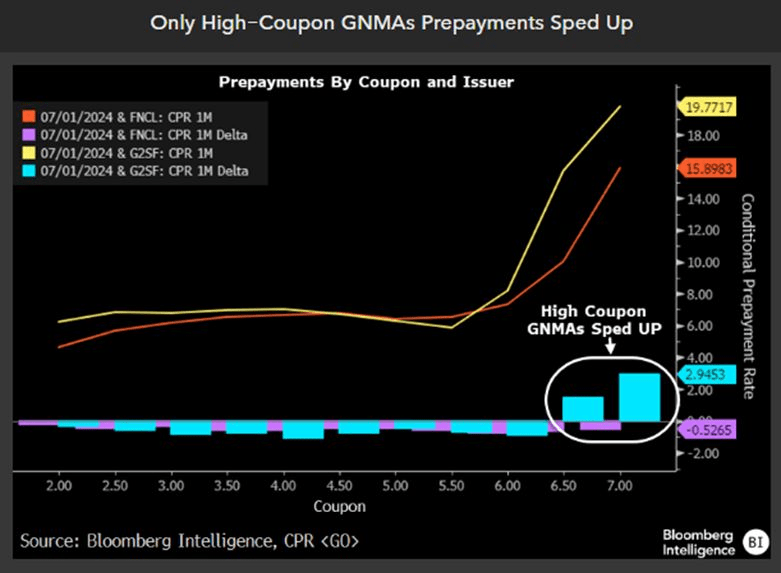
Mprtgage prepays fell less than daycoiunt.
But on;y high-coupn GNMAs prepayments sped up.
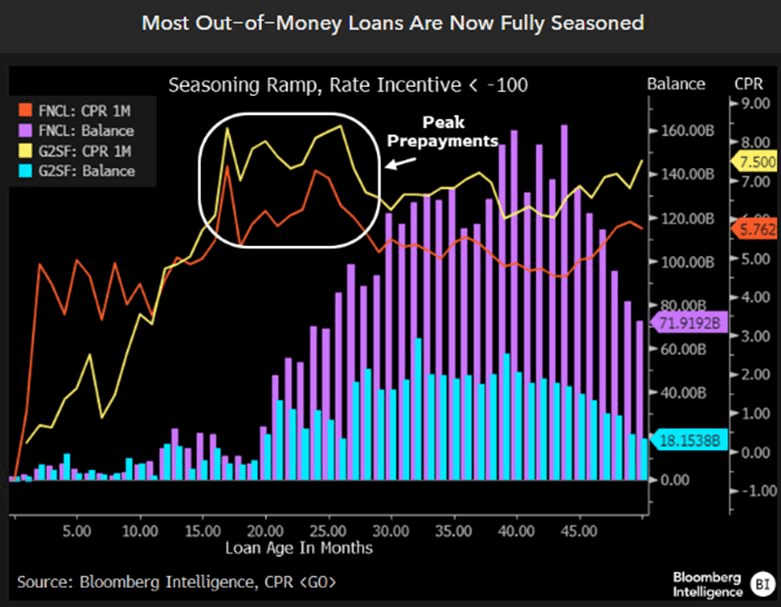
Finally, most out-of-the-money loans are now fully seasoned.
MMT is mostly magic! The Federal Reserve relies on “The Power of Magic” to fool people. For example, the massive increase in money printing following Covid and Biden’s disastrous economic policies (or FOLLICIES).
But there is also a fair amount of hypocrisy in the non-Austrian (e.g., mainstream, Keynesian, monetarist) critiques of MMT by mainstream economists. The truth is that most, if not all, of these economists share the same faulty presuppositions regarding what is euphemistically called “monetary policy.” The difference between mainstream and MMT economists is usually one of degree, not of kind.
Alan Greenspan, former Federal Reserve chairman (1987–2006) and most definitely not an MMT proponent, made a very MMT-friendly claim: “The United States can pay any debt it has because it can always print money to do that, so there is zero probability of default.” While this is literally true, and points to the fact that the nominal debt and dollars are not the issue, it overlooks the distortionary consequences from this manipulation on the entire structure of production. Nevertheless, such a claim is often also repeated by proponents of MMT, as if it contains some magic missing ingredient to unlock greater stores of wealth.
In fact, MMT provides a warranted critique to other schools of economic thought that share an underlying premise while not arriving at the same conclusions. That assumption is so-called monetary policy—that governments via a central banking monopoly ought to be the sole entity that issues and controls money as a policy instrument. The dubious justifications for this are that it provides greater economic stability and expansion of money and credit according to the needs of trade. (Both of these are false, theoretically and empirically.) That said, MMT and mainstream economics both share this presupposition, assuming the validity of monetary policy.
As an example of presenting the broad mainstream on the definition of “monetary policy,” the popular financial encyclopedia Investopedia has previously stated the following:
“Monetary policy is a set of tools that a nation’s central bank has available to promote sustainable economic growth by controlling the overall supply of money that is available to the nation’s banks, its consumers, and its businesses. . . . The main weapon at its disposal is the nation’s money (italics added).”
The casual use of the word “weapon” is apt. In the hands of a state monopoly, money can indeed be “weaponized.” Inflation is the artificial expansion of money and credit that has the effect of transferring wealth from all money holders to the inflater(s). This may be done under the guise of “policy”—appearing official, orderly, and legitimate—but it involves elites in power taking actions that would otherwise be criminal behavior (e.g., fraud and counterfeiting).
Even without the ethical-philosophical discussion on whether changing the money supply is fraudulent, economically, the consequences remain. The inflation of money and fiduciary media (artificial credit) causes economic miscalculations and boom-bust cycles, distorts the structure of production, encourages capital consumption, undermines the actions of individuals, discourages saving, transfers wealth from the citizenry to the government and those who are politically connected, affects money’s purchasing power, and has a whole host of other unintended effects. All this, of course, is done under the legal cover of “policy” to achieve “stable economic growth,” as well as ambidextrously maintaining the false dichotomy between full employment and inflation.
Enter MMT, which takes “monetary policy” concepts to their logical conclusions, demonstrating the consequences in a striking way, and mainstream economists quickly want to disassociate themselves from this “crazy” new idea. People may not appreciate some MMTers claiming what they do about inflation, government spending, full employment, and debt; yet politicians and monetary bureaucrats sure seem to act like they believe MMT.
MMT correctly observes that government—through a balance of taxation, deficit spending, inflation, and monetary policy—attempts to centrally control an economy and does, in fact, direct real resources toward its ends. These are common policy tools of the state and central banks. MMT would just like to leverage these tools to a greater extent and direct them toward different ends. Likewise, Investopedia had further clarified:
“The Federal Reserve is in charge of monetary policy in the U.S. The Federal Reserve (Fed) has what is commonly referred to as a dual mandate: to achieve maximum employment while keeping inflation in check.”
Is this above statement not basically a statement of the goals of MMT? Other economic schools of thought that accept the underlying presuppositions of the necessity of monetary policy are not fundamentally in disagreement with MMT on this point; in fact, they are in fundamental agreement. This undermines the ability of these schools to effectively deliver a fundamental critique of MMT rather than just disagreements about how and to what extent monetary policy is to be utilized.
Economic criticism on these points—whether from MMT to the “other side” or from the “other side” to MMT—involves inconsistency. By condemning the other, they condemn themselves because they share core presuppositions. The existence of MMT is effectively a reductio ad absurdum of so-called monetary policy. MMT reasonably asks: What if we did more of the same? Obviously, the degree to which something is done can be critiqued without abandoning the whole thing, but the flawed assumptions are twofold: (1) that there is “just the right amount” of monetary policy and (2) that there are certain enlightened experts who know what it is and only need monopoly over the money supply to achieve it.
Whether MMT or otherwise, proponents of so-called monetary policy essentially believe that money is a policy instrument (or weapon) to be wielded by government elites to rearrange prices, resources, and the structure of production contrary to the demonstrated preferences of millions of individuals. Therefore, the United States has been under a monetary policy regime of “stabilizers” who have argued about how to implement a fundamentally flawed “policy” for over a century.
Whenever this fails and destabilizes the economy, we are treated to critics who blame the free market and deregulation and who want to use monetary policy to “run the economy” differently.
Instead, we ought to abandon the fraud of monetary policy and heed the words of F.A. Hayek concerning the results of monetary policy that led to America’s Great Depression:
“We must not forget that, for the last six or eight years [up to 1932] monetary policy all over the world has followed the advice of the stabilizers. It is high time that their influence, which has already done harm enough, should be overthrown.”
Mortgage rates have actually risen as The Fed has increased M2 Money printng. Like DARK magic.
Housing in the US is simply unaffordable. Particularly since home prices and mortgage rates have soared undier Biden.
.Owning a house is less affordable for average earners in the US than at anytime in 17 years.
The costs of a typical home — including mortgage payments, property insurance and taxes — consumed 35.1% of the average wage in the second quarter, the highest share since 2007 and up from 32.1% a year earlier, according to a new report from Attom.
Growth in expenses, along with mortgage rates hovering around 7%, have outpaced income gains as a persistent shortage of listings pushed the median home price to a record-high $360,000, Attom said. In more than a third of US markets, ownership costs ate up 43% of average local wages, far above the 28% considered to be a guideline for affordability.
The latest data “presents a clear challenge for homebuyers,” Rob Barber, chief executive officer of Attom, said in a statement. “It’s common for these trends to intensify during the spring buying season when buyer demand increases. However, the trends this year are particularly challenging for house hunters.”
Pricey markets in the West and Northeast had the biggest declines in affordability, including Orange and Alameda counties in California, and Brooklyn and Nassau County in New York.
Among the 589 counties analyzed, 582, or 98.8%, were less affordable in the second quarter than their historic affordability averages, Attom said.
On the mortgage side, mortgage applications decreased 2.6 percent from one week earlier, according to data from the Mortgage Bankers Association’s (MBA) Weekly Applications Survey for the week ending June 28, 2024.
The Market Composite Index, a measure of mortgage loan application volume, decreased 2.6 percent on a seasonally adjusted basis from one week earlier. On an unadjusted basis, the Index increased 8 percent compared with the previous week. The Refinance Index decreased 2 percent from the previous week andwas 29 percent higher than the same week one year ago. The seasonally adjusted Purchase Index decreased 3 percent from one week earlier. The unadjusted Purchase Index increased 7 percent compared with the previous week and was 12 percent lower than the same week one year ago.
Gimme two steps to sell my house. Are people getting out of dodge?? Calfornia Gpvernor “Greasy Gavin” Newsom sold his Sacramento home and moved to Marin County for better schools. Sacrramento active housing inventory is up 65.6% YoY.
Active housing inventory in May is up 27.5% YoY nationally, with Denver leading at 75.2% YoY. I highlight Columbus Ohio at +32.9% since that is where I live.
A new report from Construction Coverage has revealed where the largest increases in real estate inventory in the U.S. are taking place.
The report notes that the current housing shortage—which is now estimated to be between four million and seven million homes—can trace its beginnings to long before the COVID-19 pandemic. In the 10 years following the Great Recession, the United States constructed fewer new homes than in any other decade since the 1960s.
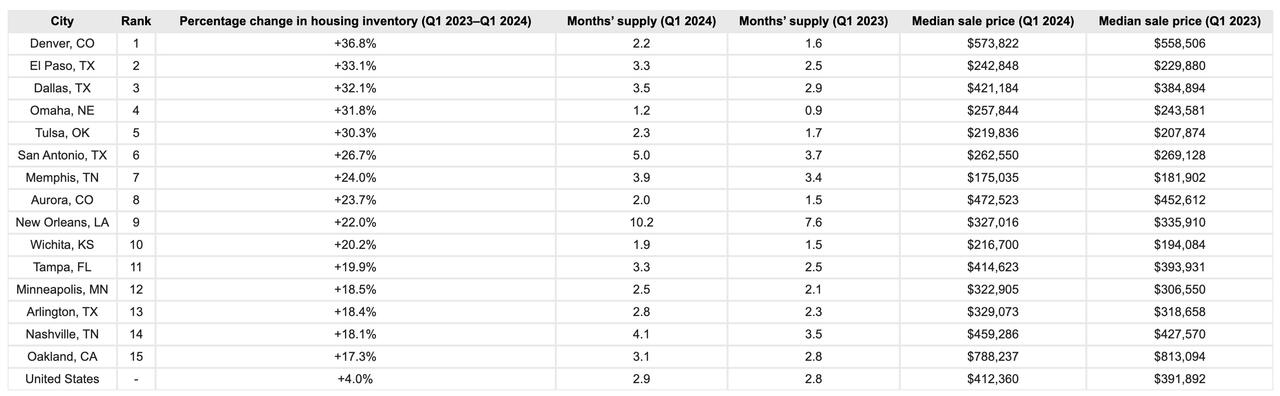
They write that the lack of housing affects certain areas more severely than others. Researchers ranked locations based on the percentage change in the average monthly housing inventory—the total number of active listings plus pending sales at the end of the month—between Q1 2023 and Q1 2024.
Data from a national level showed that U.S. housing inventory decreased from more than two million in 2012 to a low of approximately 630,000 at the start of 2022.
Over the same period, months’ supply—a measure of how long it would take existing inventory to sell if no new homes came on the market—plummeted from a national high of 7.5 months to a historic low of 1.1 months, the report adds.
It also noted that inventory has rebounded slightly since early 2022: throughout the first quarter of 2024, the national inventory hovered around 970,000 homes for sale, marking a 4.0% year-over-year increase.
Despite this uptick, existing inventory would sustain the current sales pace for just 2.9 months—a marginal increase from the 2.8 months’ supply recorded last year.
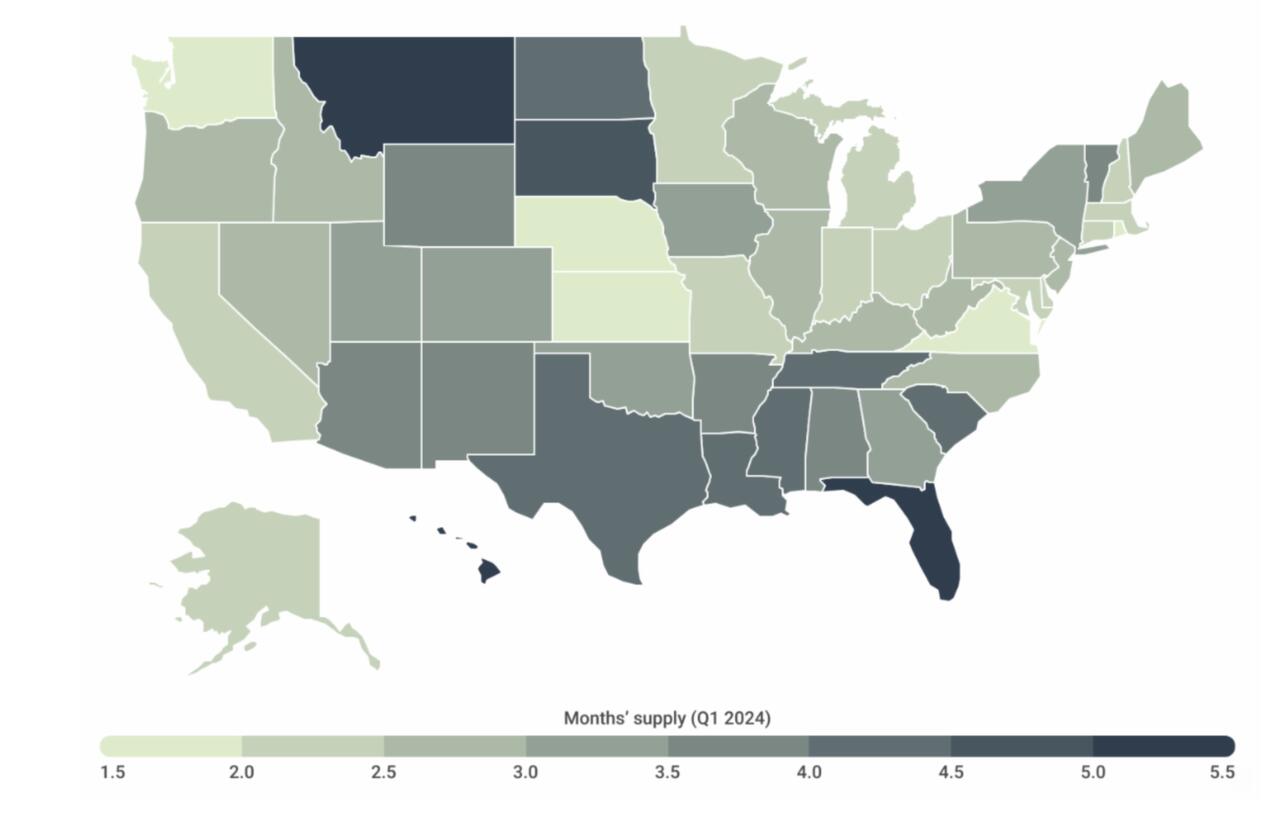
The report broke down trends by cities and states, finding that as of the first quarter of 2024, states with the lowest levels of supply are concentrated in and around the Midwest (such as Kansas with 1.5 months of supply) and the Northeast (including Rhode Island with 1.8 months of supply).
However, Washington also stands out for having some of the lowest levels of available housing nationally, with just 1.9 months of supply.
In contrast, several states in the South, led by Florida (5.2 months of supply), along with Hawaii (5.2 months) and Montana (5.1 months), present notably more favorable conditions for buyers.
Among the nation’s largest cities, Denver, El Paso, and Dallas recorded the largest year-over-year increases in housing inventory. At the opposite end of the spectrum, Las Vegas, Raleigh, and Chicago recorded the biggest declines.
The data is hardly a 2008-style collapse, but that doesn’t mean it isn’t noteworthy.
While the ‘turning of the tide’ still remains muted, the housing market is so large it rarely corrects swiftly. It’s important to notice, however, that rising inventory ticking higher – combined with mortgage rates now over 7% – could easily be telegraphing a correction in prices heading into 2025.


You must be logged in to post a comment.