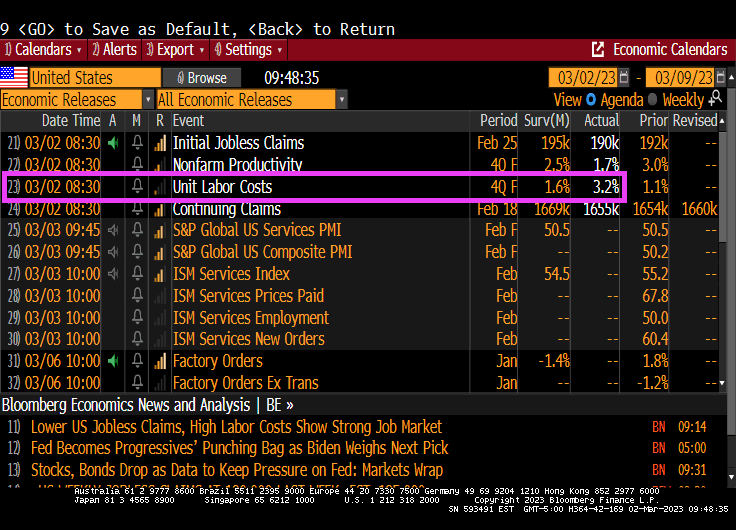
Despite Treasury Secretary Janet Yellen claiming that inflation was only transitory and likely to disappear, we are seeing continued inflation. Now we see that Unit Labor Costs are up 3.2% QoQ for Q4 2022.
Even worse, US unit labor costs rose 6.5% on a year-over-year (YoY) basis, the WORST since 1982.
And yes, Q4 2022 unit labor costs are up 2x the expectations.
In normal times, The Federal Reserve would raise rates to cool down the economy. The Taylor Rule suggests a Fed target rate of 10.59% versus the current Fed rate of 4.75%. A long way to go!!
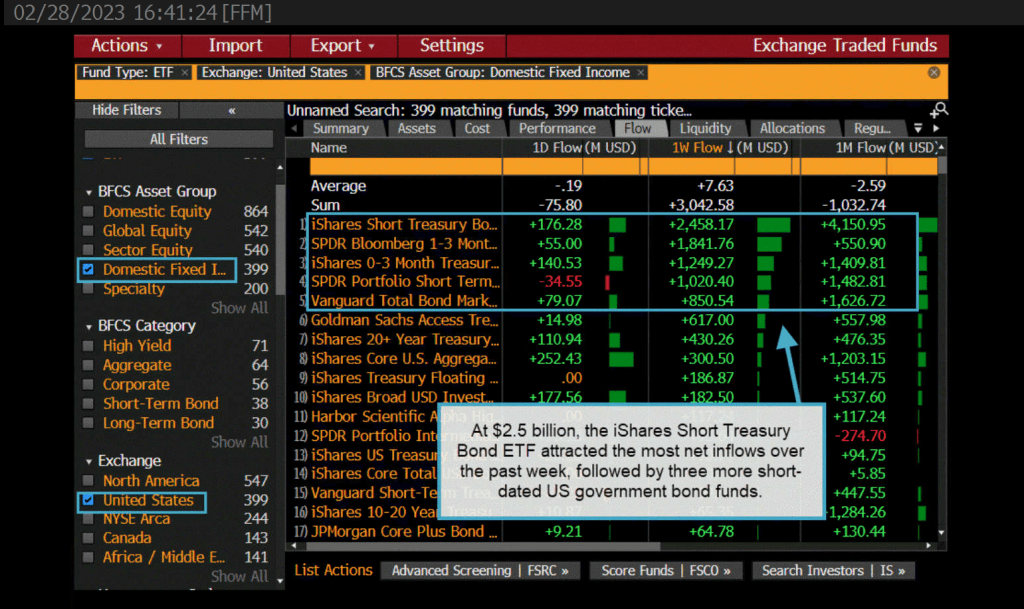
As The Federal Reserve reaffirms their draining of the monetary punch bowl, we are seeing investors flock towards the bond market. Particularly the iShares Short Treasury ETF. $2.5 BILLION to be exact.
Meanwhile, credit ETFs are hammered by record outflows of almost $12 Billion.
The reason why? Inflation remains elevated which is leading The Fed to keep their foot on the monetary brake pedal.
Today’s mortgage application (demand) numbers from the Mortgage Bankers Association was disappointing to say the least. Mortgage purchase demand just sank to it lowest level since 1995.
Typically, mortgage purchase applications peak in May or June of each year before beginning their annual lemmings drive downwards. But this year is seeing a early turn for the worse.
The unadjusted Purchase Index decreased 3 percent compared with the previous week and was 44 percent lower than the same week one year ago. The Refinance Index decreased 6 percent from the previous week and was 74 percent lower than the same week one year ago.
The Fed is hell bent on removing the punch bowl to fight inflation. Looks like Biden’s economic plan is turning the punch bowl into a dust bowl.
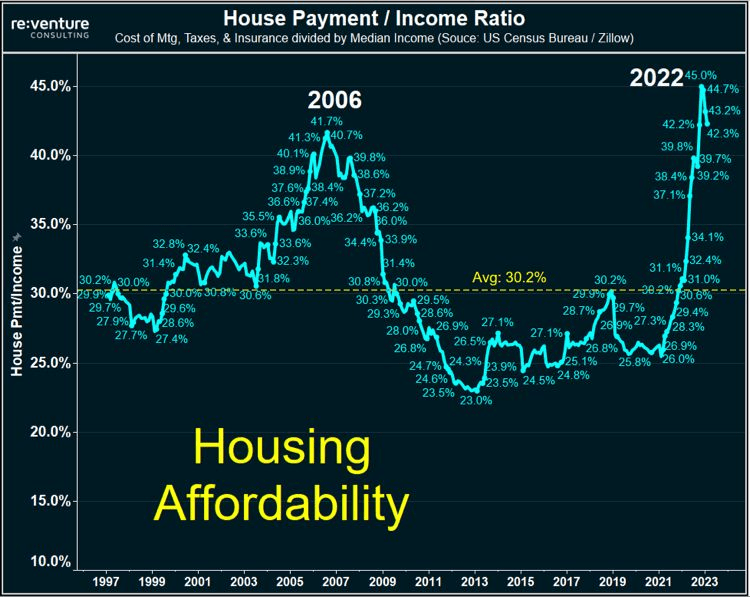
Janet Yellen and The Federal Reserve held rates too low for too long and now we are paying for it. Now, after a massive run-up in home prices, The Fed is raising rates helping make US housing the most unaffordable in history (or at least since the early 1980s).
And negative real wage rate growth for 22 straight months isn’t helping!
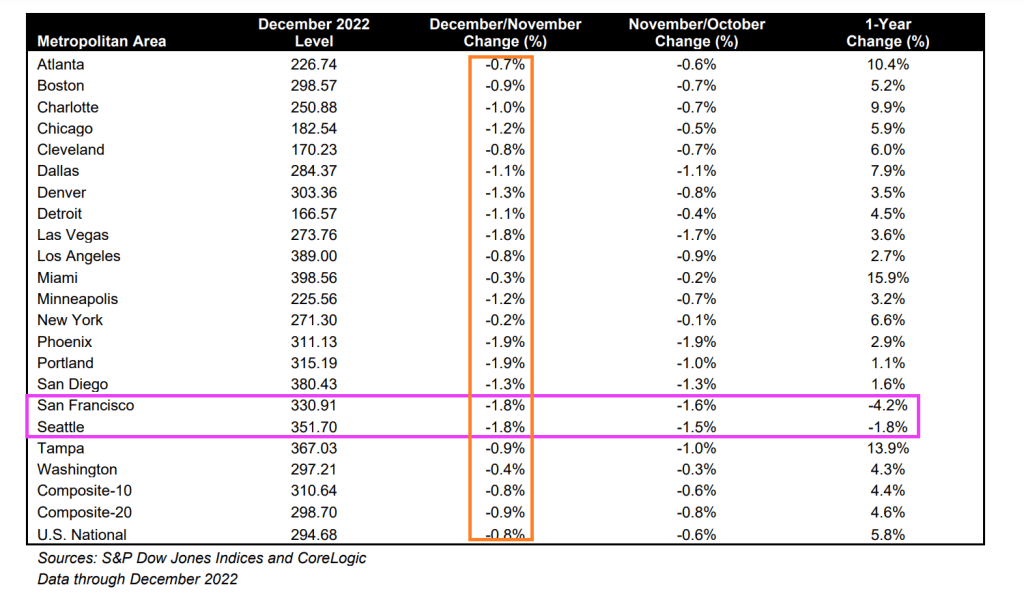
Only Seattle and San Francisco experienced negative growth in home prices on a year-over-year basis. All of the top twenty metro areas experience negative month-over-month price declines from November to December.
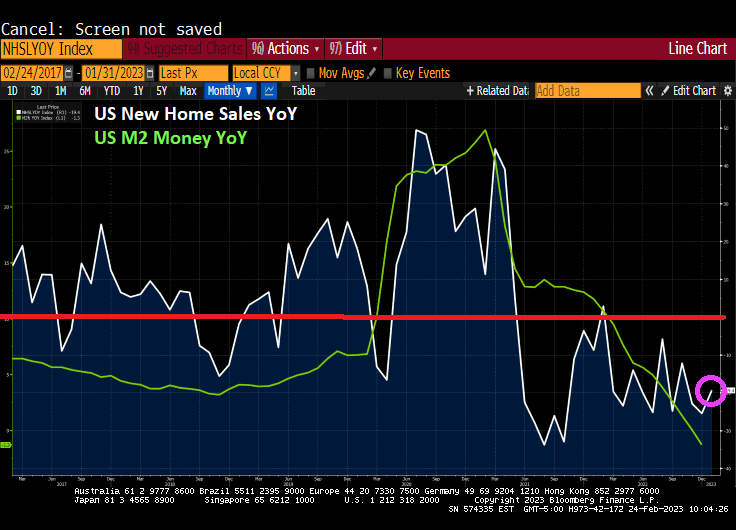
Another sign of a not healthy economy is housing. New Home Sales collapsed -19.4% from January 2022 (aka, year-over-year or YoY).
If I were Joe Biden, I would be touting the month-over-month numbers, up 7.20% from December to January. But the reality is that year-over-year new home sales are down -19.4%.
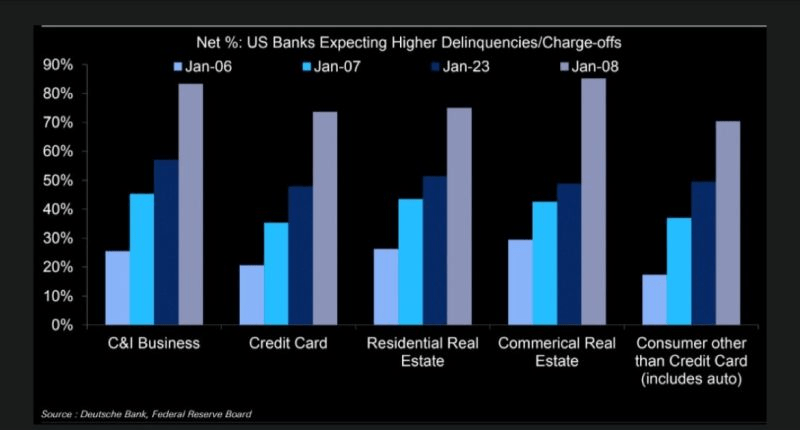
Also, on the “Alarm!” front, US banks are expecting higher delinquencies, including on residential mortgages.
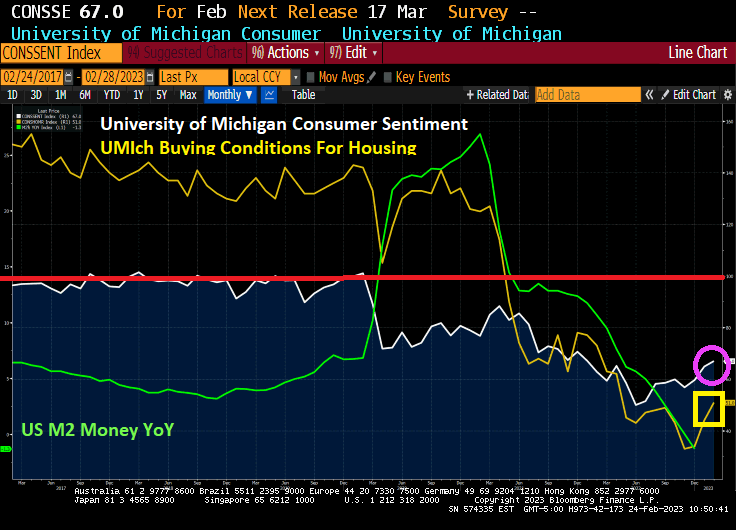
University of Michgan consumer sentiment for housing is rising, but still woefully below the 100 benchmark.
Bull steepenings in the yield curve are generally seen as a precursor to a recession, but they are often preceded by bear steepenings. The 3m30y curve is currently bear steepening, indicating a recession could begin as early as the summer. In fact, the 3m30y curve is now inverted at -94.628 basis points pointing to a recession in summer 2023.
This is happening as the US house payment to income ratio near all-time highs.
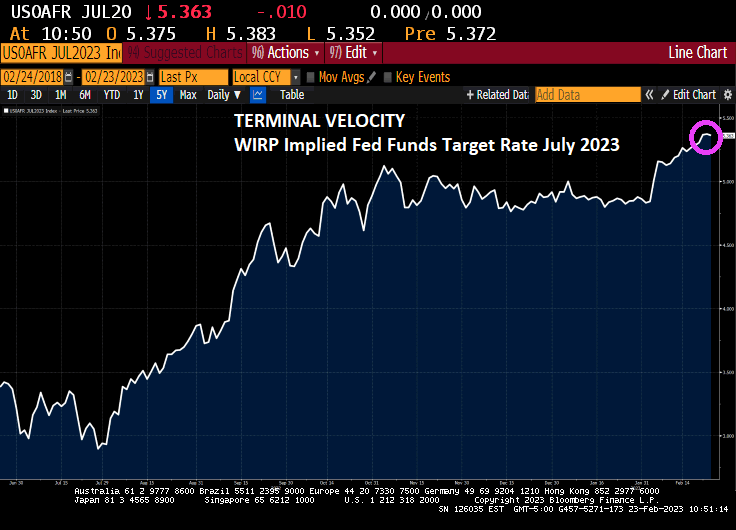
The terminal Fed Funds target rates is now 5.363% for the July FOMC (Fed Open Market Committee) meeting in 2023.
This comes as US Q4 GDP was revised lower on weaker consumer spending, revised downward to 1.4%
With the revision of Personal Consumption, real GDP was revised downward to 2.7% annualized QoQ.
The Taylor Rule estimate for The Fed Funds Target rate is 10.15%. The Fed is only at 4.75%, so there is a long way to go! Except that The Fed doesn’t follow any useful rule like the Taylor Rule. Just the “seat of the pants” rule.
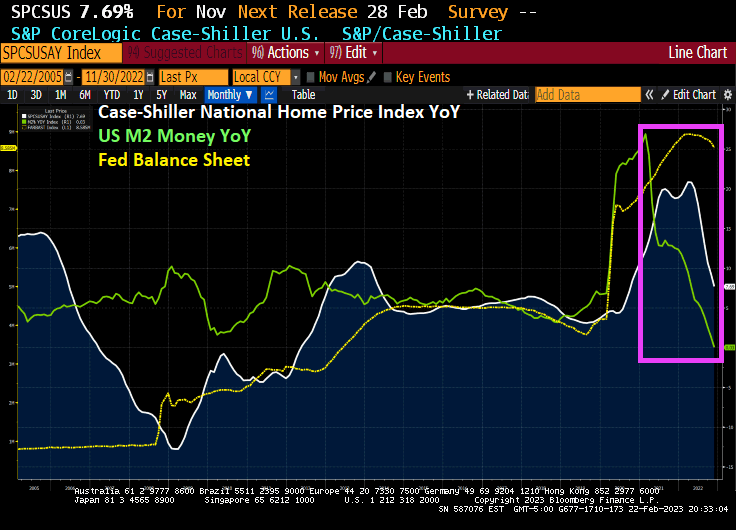
The value of the US housing market shrunk by the most since the 2008 as the pandemic boom (and M2 Money growth) fizzled out.
After peaking at $47.7 trillion in June, the total value of US homes declined by $2.3 trillion, or 4.9%, in the second half of 2022, according to real estate brokerage Redfin. That’s the largest drop in percentage terms since the 2008 housing crisis, when home values slumped by 5.8% from June to December.
Homebuyers, already facing record-high prices, took an additional hit from mortgage rates that more than doubled last year. With less competition in the market, the median US home sale price was $383,249 last month, down from a peak of $433,133 in May.
To be sure, home prices are not collapsing. In December, the total value of US houses was still 6.5% higher than it was a year earlier.
Florida Gains
How much homeowners lost depends on where they bought. The biggest declines were in pricey cities like San Francisco and New York, while buyers who moved to pandemic boomtowns are still seeing the returns on their investment, particularly in Florida.
That was especially true in Miami, where the total value of homes ballooned 20% year-over-year to $468.5 billion in December, the largest annual percentage increase among the top metro areas. While the overall US housing market is down, Miami’s market has about the same value as when it peaked at $472 billion in July. Meanwhile, homeowners in North Port-Sarasota, Florida, Knoxville, Tennessee, and Charleston, South Carolina, all saw annual gains above 17% in 2022.


You must be logged in to post a comment.