What do you do with The Federal Reserve who keep printing money?
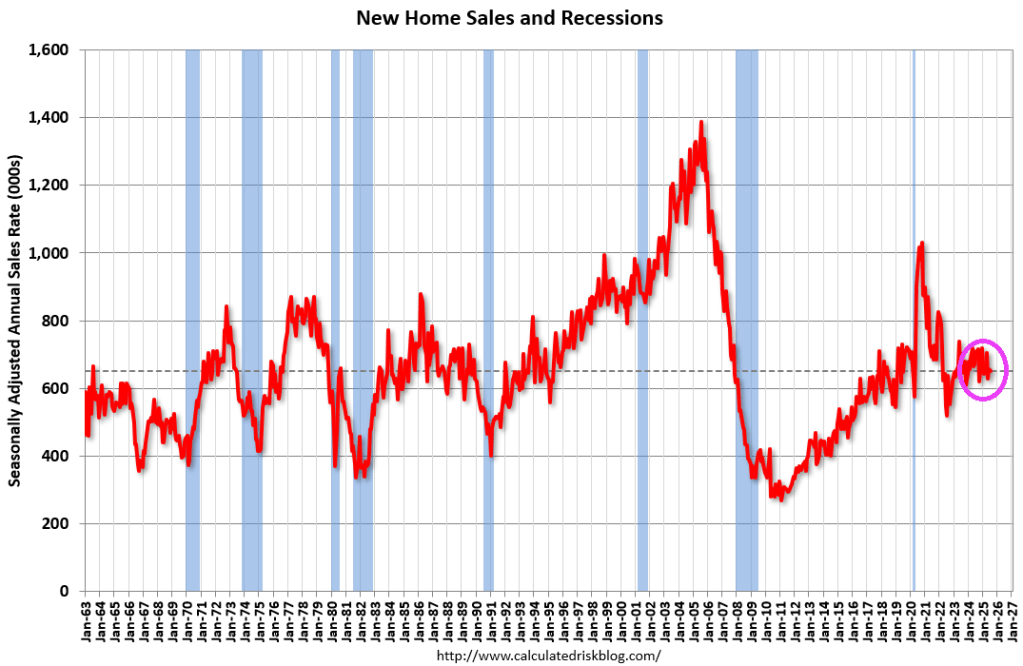
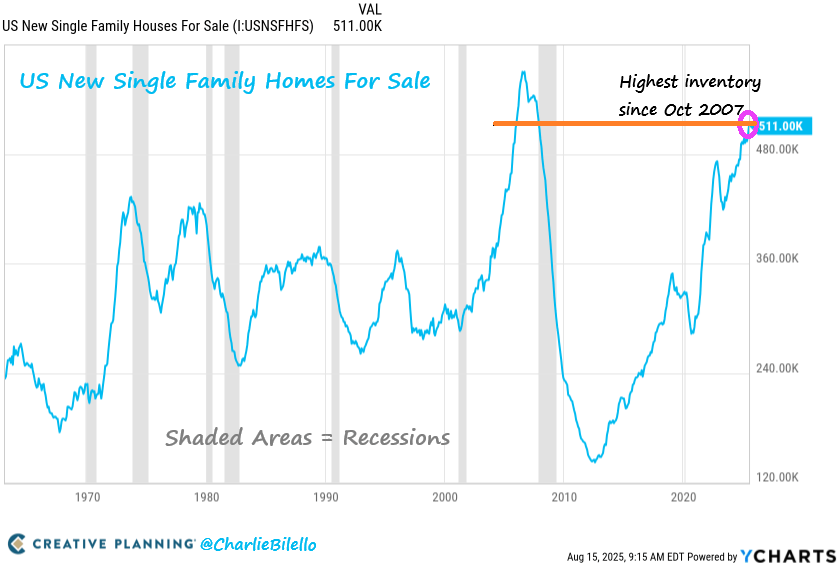
According to the US Census Bureau, New Home Sales of new single-family houses in July 2025 were at a seasonally-adjusted annual rate of 652,000, according to estimates released jointly today by the U.S. Census Bureau and the Department of Housing and Urban Development.
This is 0.6 percent (±15.5 percent)* below the June 2025 rate of 656,000, and is 8.2 percent (±14.0 percent)* below the July 2024 rate of 710,000.
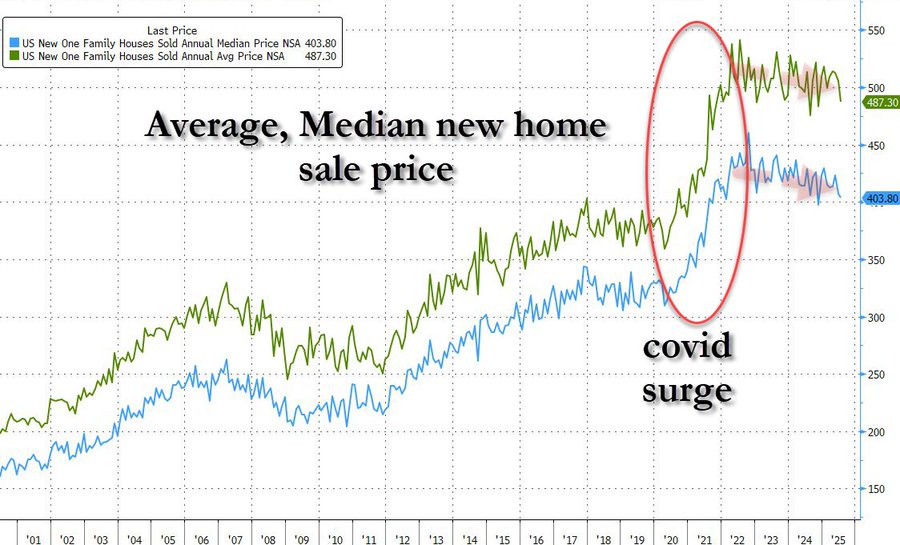
Median and Average Sales Price
The median sales price of new houses sold in July 2025 was $403,800. This is 0.8 percent (±5.9 percent)* below the June 2025 price of $407,200, and is 5.9 percent (±8.5 percent)* below the July 2024 price of $429,000. The average sales price of new houses sold in July 2025 was $487,300. This is 3.6 percent (±8.0 percent)* below the June 2025 price of $505,300, and is 5.0 percent (±8.6 percent)* below the July 2024 price of $513,200.
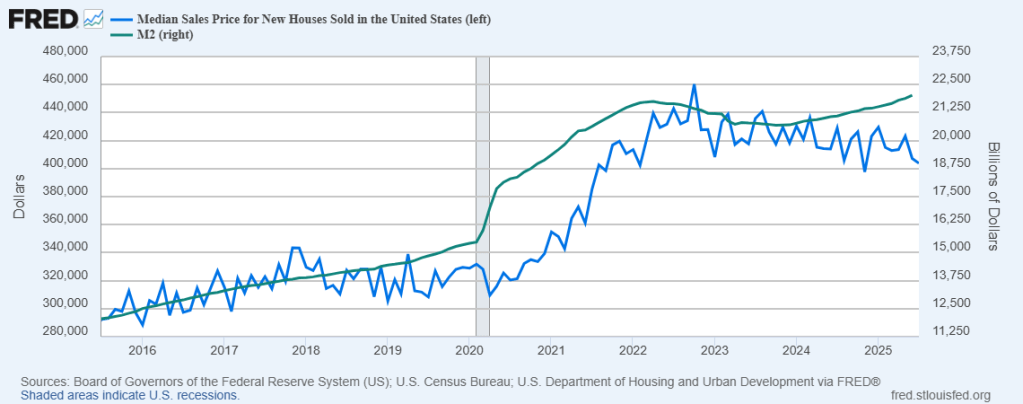
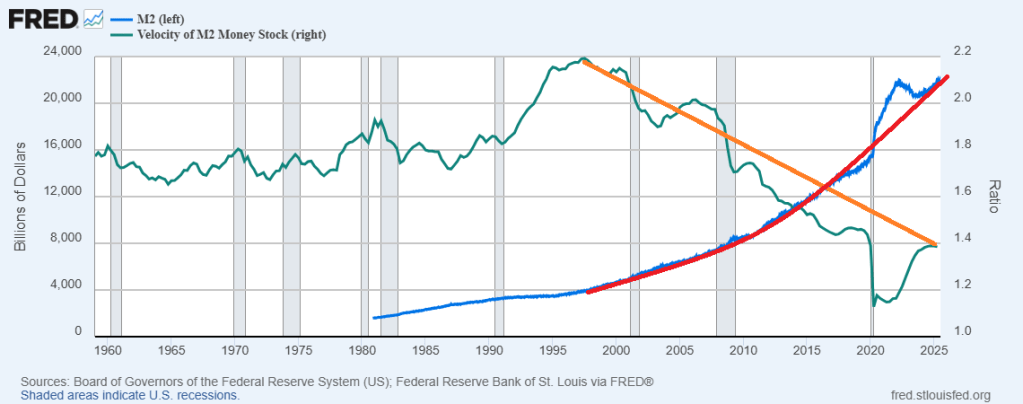
Here is a chart of median sales price of new homes against Fed money printing (M2).


You must be logged in to post a comment.