Simply Unaffordable! The Most Unaffordable And Most Affordable Cities In USA (San Jose/New York City Are Least Affordable, Detroit/Cleveland Are Most Affordable)

Some cities in the USA are simply unaffordable.

The Visual Capitalist calls most unaffordable cities as least affordable. San Jose California and New York City are the two most unaffordable cities in the USA. According to household spending.

On the flip side of the affordability coin is … Detroit Michigan and Cleveland Ohio. Followed closely by Dayton Ohio and El Paso Texas.

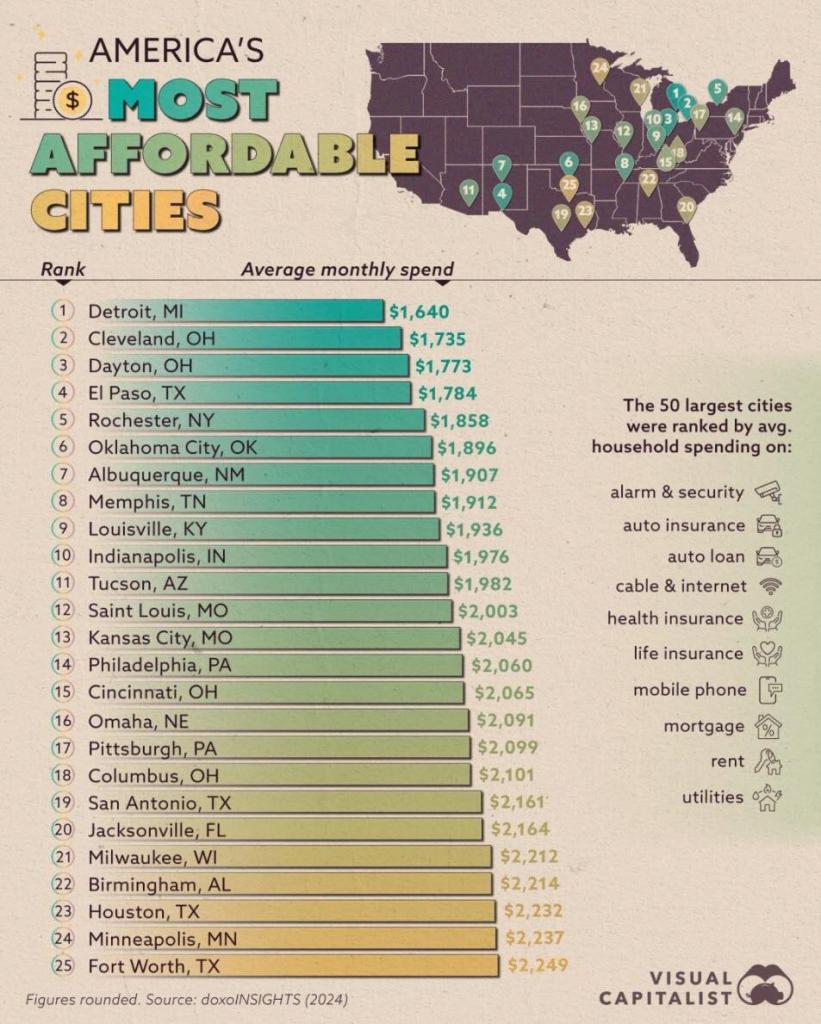
Fortunately, I live in Columbus Ohio. the 18th most affordable city in the USA.

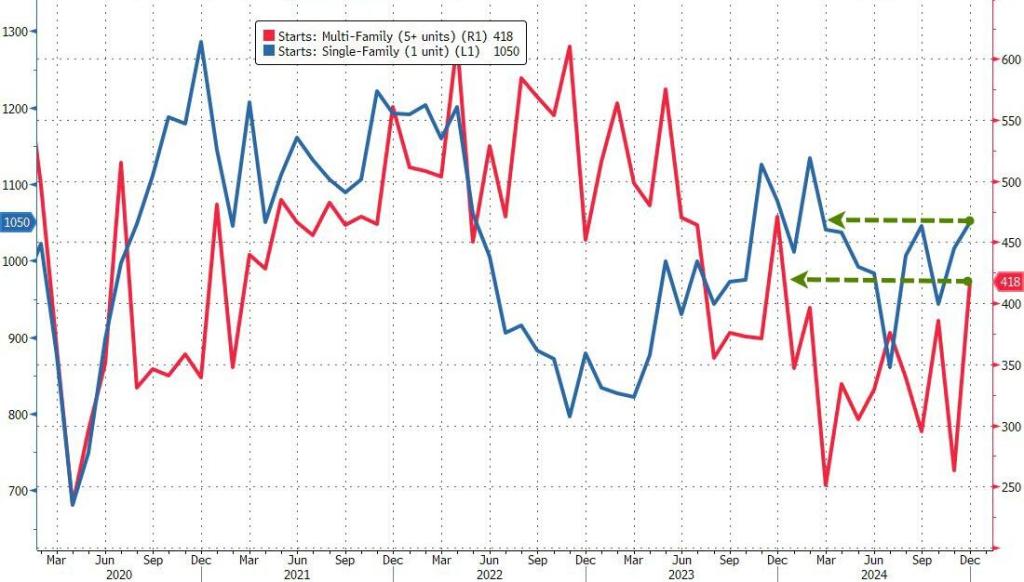
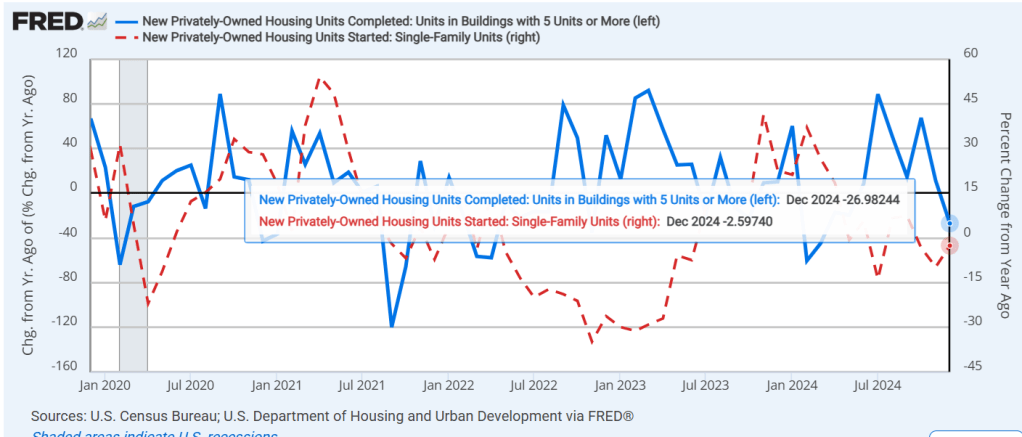
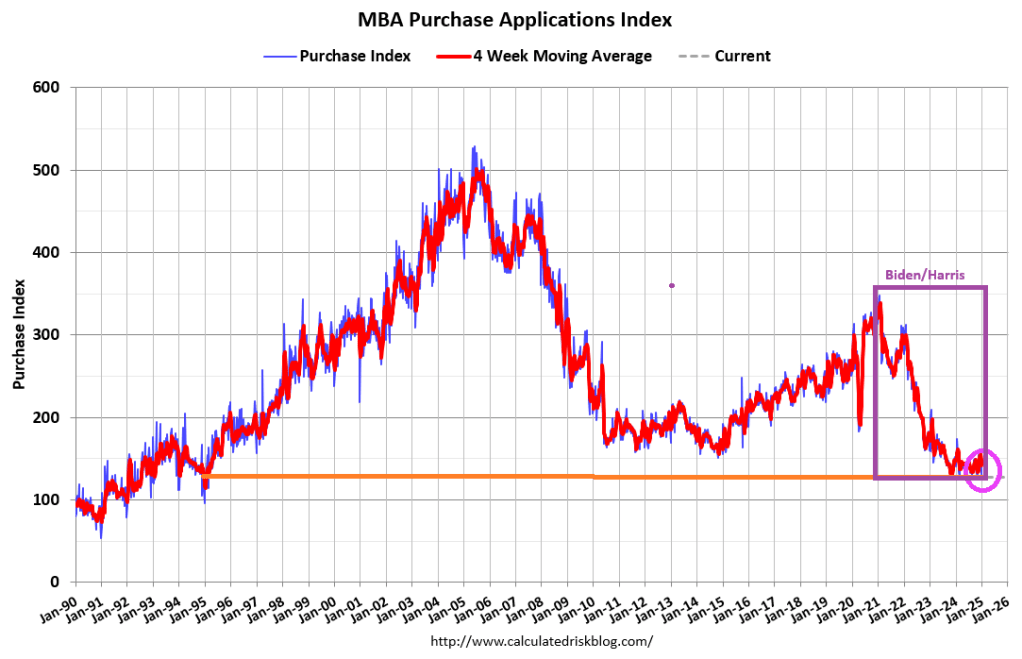
Much of the difference amongst cities is land use and construction restraints. And booming/dying local economies.

As a sad reminder about the last four years, Pete Buttigieg will leave his post as Transportation Secretary having spent $7.5 BILLION to build 8 EV charging stations.

Shocker! Under Biden, Home Prices Rose 38.3% While US Population Rose 3.3% (Housing Starts 5+ Unit Multifamily Surged The Most Since 2016)

I remember giving a speech to Federal regulators in Washington DC and discussing the rise of housing rentership in the US. I said the US is veering towards a renter nation.

Today’s housing starts report revealed the biggest MoM jump in multi-family starts since 2016, and the highest SAAR for ‘renter nation’ since Dec 2023.

On a year-over-year basis, 5+ unit (multifamily) starts are are up while 1-unit housing starts are negative.

Unfortunately, the percentage change on a year-over-year basis were negative. -2.6% for 1-unit starts and -27% for 5+ unit (multifamily) starts.

Under Biden, home prices rose a whopping 38.3% while population (if you believe the US Census Bureau) rose 3.3%.

Shocker!

Brace For Impact! Great Jobs Report Likely To Be Revised Downwards … A Lot!

Time to take a break from the Gavin Newsom/Karen Bass LA fire fiasco. And refocus on the Biden/Harris employment fiasco.

After a year of ‘robust’ job growth private payrolls were subsequently revised by nearly 1 MILLION for April 2023 – March 2024.

The most recent data points to additional huge revisions in Q2 and Q3.

In a normal world, Newsom and Bass would be toast politically. But this is far left Commiefornia!

Off To A Bad Start! Mortgage Purchase Applications Declined 7% Since Last Week, Down 15% Since Same Week Last Year

Mortgage applications decreased 3.7 percent from one week earlier, according to data from the Mortgage Bankers Association’s (MBA) Weekly Mortgage Applications Survey for the week ending January 3, 2025. This week’s results include an adjustment for the New Year’s holiday.

The Market Composite Index, a measure of mortgage loan application volume, decreased 3.7 percent on a seasonally adjusted basis from one week earlier. On an unadjusted basis, the Index increased 47 percent compared with the previous week. The seasonally adjusted Purchase Index decreased 7 percent from one week earlier. The unadjusted Purchase Index increased 43 percent compared with the previous week and was 15 percent lower than the same week one year ago.

Purchase application activity is up about 2% from the lows in late October 2023 and is now 15% below the lowest levels during the housing bust.  

The Refinance Index increased 2 percent from the previous week and was 6 percent lower than the same week one year ago.

Then we have this diddy from The Epoch Times where a mortgage company allegedly provided a loan to a household that had 33 debts in collection. Hey, I thought under Senator Elizabeth Warren’s brainchild these reckless lending practices were over!

One will be gone on January 20 and I wish the other one would be gone too.

Going Down? US Yield Curve Inverts To Positive After Longest Inversion Since Carter (Predictor Of Recession)

Was Freddie King correct? Is the US economy going down??

The US Treasury yield curve (10Y-2Y) has inverted to the positive side after a prolonged NEGATIVE inversion (from July 6, 2022 to Sept 5, 2024) marking the longest period of negative inversion since August 18, 1978 – May 1, 1980. Each negative inversion was followed by a recession.

The UST 10Y-3M yield curve tells a similar tale. The 10Y-3M curve inverts prior to recessions but goes positive just prior to recessions.

Yes, if the yield curve is a good predictor of recession, the US economy is going down.

Freddie King is playing a Gibson ES-355TDC guitar.

Riders On The Storm! Buying Conditions For Housing Rises To 39, But Remains In The Doldrums (Home Prices UP 35.4% Under Biden, Mortgage Rates UP 148%)

We are all riders on the Biden housing storm.

Existing-home sales have finally started to improve on a seasonally adjusted basis after a three-year decline.

Cause? Raging home prices combined with higher than normal mortgage rates. Home prices are up 35.4% under Biden while conforming 30Y mortgage rates are up 148%.

Mortgage Applications Decreased 21.9% From Two Weeks Earlier, Purchase Applications Down 48% From Two Weeks Earlier

Well, its that time of year again. Mortgage applications drop to their lowest levels after Christmas until New Years Eve. Then mortgage applications pick up in the new year.

Mortgage applications decreased 21.9 percent from two weeks earlier, according to data from the Mortgage Bankers Association’s (MBA) Weekly Mortgage Applications Survey for the week ending December 27, 2024. The results include an adjustment to account for the Christmas holiday.

The Market Composite Index, a measure of mortgage loan application volume, decreased 21.9 percent on a seasonally adjusted basis from two weeks earlier. On an unadjusted basis, the Index decreased 55 percent compared with two weeks ago. The seasonally adjusted Purchase Index decreased 13 percent compared with two weeks ago. The unadjusted Purchase Index decreased 48 percent compared with two weeks ago and was 17 percent lower than the same week one year ago.

The holiday adjusted Refinance Index decreased 36 percent from two weeks ago and was 10 percent higher than the same week one year ago. The unadjusted Refinance Index decreased 62 percent from two weeks ago and was 6 percent lower than the same week one year ago. 

US Home Prices Surge To 17th Consecutive All-Time High (NYC Leads Nation, Tampa Last)

US home prices surged to the 17th consecutive all-time high.

US home prices in the 20 largest cities rose 0.32% MoM in October (the latest data from S&P CoreLogic Case-Shiller), considerably hotter than the 0.22% rise expected. However, despite the MoM beat, the pace of annual acceleration has declined to its slowest since Sept 2023. At 3.62% YoY.

Which metro area had the highest gain? New York City at 7.27%. The lowest gain? Tampa at 0.39%.

(Not So Sweet Home) Chicago PMI Falls To 36.9, Manufacturing Index Slumps To -10.71 As Federal Spending Slows

Sweet home Chicago … NOT!

The Biden/Harris economic “miracle” was simply massive Federal spending (and borrowing) combined with hiring Federal workers. This can be seen in the following chart of Chicago Fed manufacturing index compared with Federal spending. Great times in the first months of 2021, but as Federal spending slowed, so did the manufacturing index. Last seen at -10.71 in December 2024.

Joe Biden, sold his soul for family wealth at the crossroads in Delaware.


Inflation Still Raging! 30Y Mortgage Rate Rose 141% Under Biden/Harris

Inflation soared under Biden/Harris, primarily due to their outrageous wasteful government spending.

US government spening soared with Covid and politicians enjoyed the unbridled spending.

Let’s see if Trump and Republicans can do any better.