Inflation soared under Biden/Harris, primarily due to their outrageous wasteful government spending.

US government spening soared with Covid and politicians enjoyed the unbridled spending.

Let’s see if Trump and Republicans can do any better.

Confounded Interest – Anthony B. Sanders
Financial Markets And Real Estate
Inflation soared under Biden/Harris, primarily due to their outrageous wasteful government spending.
US government spening soared with Covid and politicians enjoyed the unbridled spending.
Let’s see if Trump and Republicans can do any better.
It is a brave new world as the US attempts an Argentina-like shift from an over-regulated, corrupt economy to a more free economy. While Argentina has Javier Milei, the US is stuck with greedy Democrats and RINOs and their bloated spending sinking any attempt to cut wasteful spending.
So as we transition from woefully corrupt and demented Joe Biden to Donald Trump, the labor market is … terrible. The job finding rate of unemployed workers has collapsed.

This occurred as the Philly Fed Business Outlook plummeted.

Here is Javier Milei of Argentina and The View’s image of a libertarian leader, Javier Bardem from No Country For Old Men.


Apparently, the late Hawaiian crooner Don Ho foresaw Biden’s irresponsible spending spree. That is, BIG BUBBLES.
Let’s start with the Buffett Indicator (Warren, not Jimmy!). It indicates that the stock market is STRONGLY OVERVALUED.

The S&P 500 Mean Reversion Model also shows the stock market to be STRONGLY OVERVALUED.

How about the Shiller P/E Ratio? Also showing strong overvaluation.

House prices under Biden have exploded partly due to the outrageous Federal spending following COVID.

The Feral Reserve also had a hand in the housing bubble. While mortgage rates remain high (relative to the Trump years), The Fed’s balance sheet remains elevated.

To be sure, some Republicans were complicit in the spending spree. But mostly it was Democrats and the Biden/Harris Administration … which is still doling out millions.

All aboard the Biden/Pelos/Schumer crazy spending train!
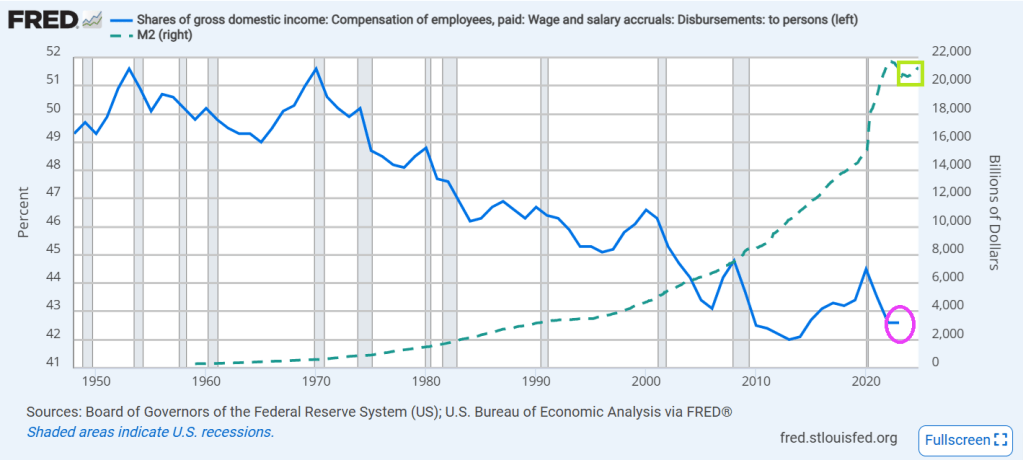
Wage and salary income as a percentage of GDP has fallen from over 50% back in 1970 to 43.1% in 2022. And look at the post Covid decline! And the increase in M2 Money.
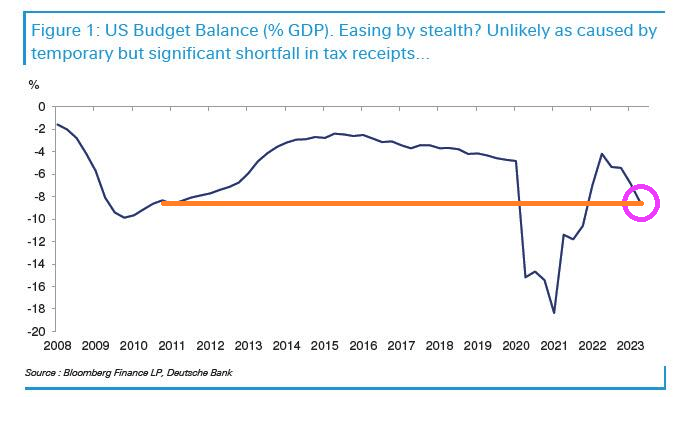
Meanwhile the US budget balance as a % of GDP has been plunging downwards in recent years.
Despite the slowing economy, pre-tax profits post Covid have SOARED!
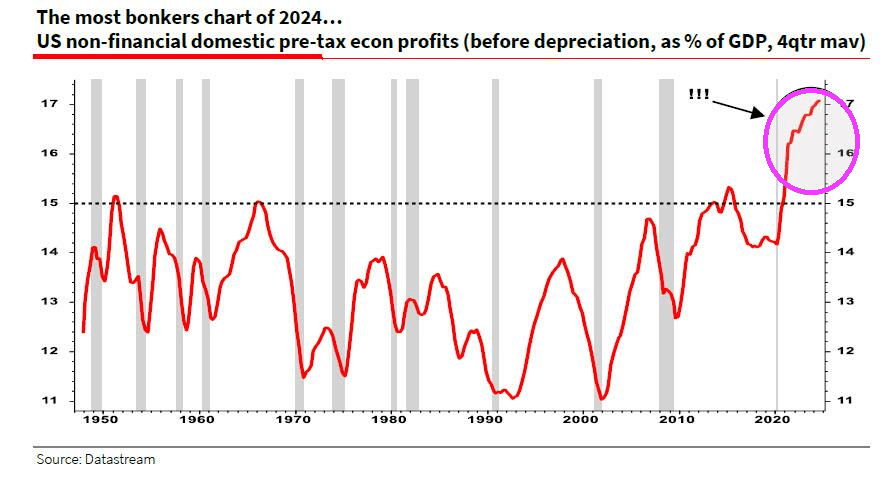
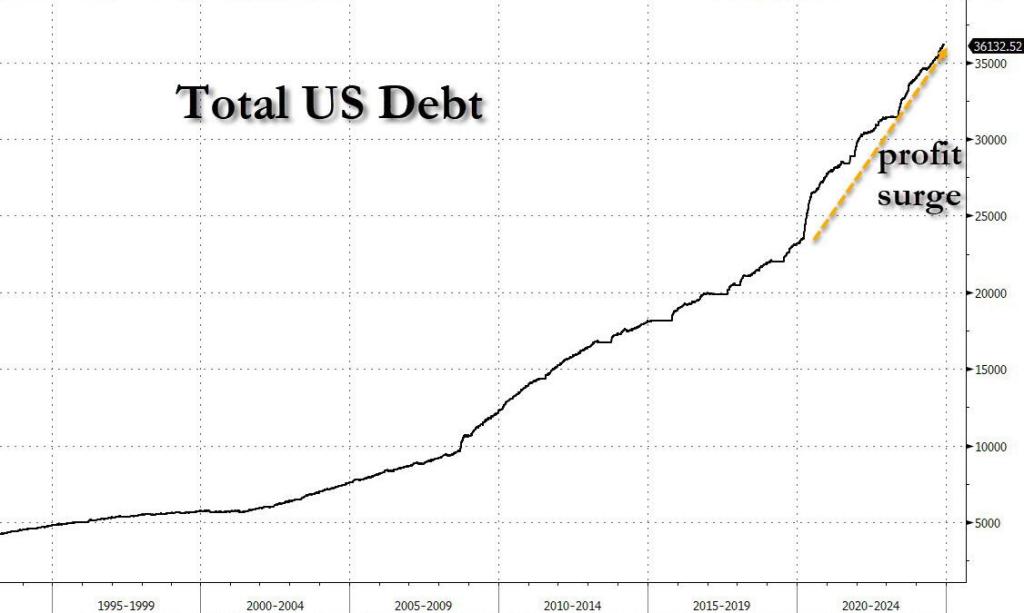
Primarily due to reckless/wasteful Federal spending and FEDERAL DEBT that soared.
There you have it! The Biden/Harris economic “miracle” was simply Federal government malspending that benefitted large corporations and few people.
Joe Biden and his woefully corrupt son Hunter of laptop fame.

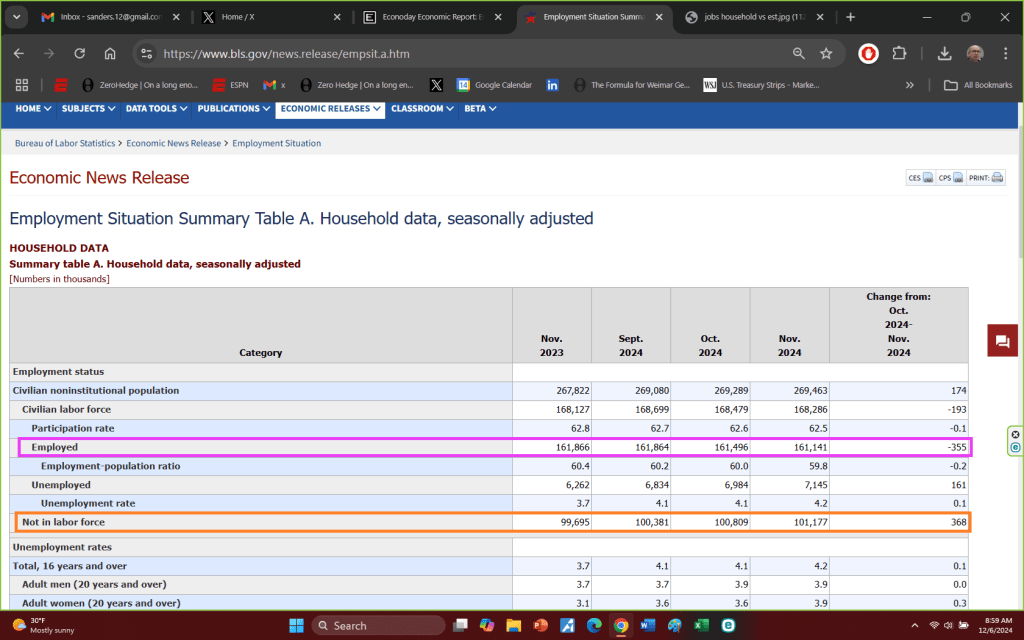
While Biden travels to Africa giving away money (and looking like the crypt keeper), the November jobs report was released.
The Establishment report showed a gain of 227k jobs. But the household survey showed a staggering loss of -355k jobs.

But not in labor force increased by 368k
Biden, the economic crypt keeper.

Meet the new boss, same as the old boss. We did get fooled again!
The problem with the national debt can’t be fixed with Mitch McConnell still in the Senate and too many Obama-era political hacks still in Washington DC.
The Obama/Biden era began in 2009 and it still exists despite Trump winning the Presidency for 2025. The Obama/Biden regime along with Congressional assistance drove up US Federal Debt to around $36 TRILLION. That is an increase of a staggering 236% since Obama/Biden were sworn into office in January 2009. And Federal spending is up 121%.

Unfortunately, Trump cannot pull a Javier Milei (Argentina’s libertarian President) and obliterate the bloated carcas of Federal bureaucracy. Democrats and RINOs like Mitch McConnell will work overtime thwarting Trump’s efforts to control the bloat.
And don’t forget the $221 TRILLION in unfunded liabilities (promises) that Congress had made to get elected. That will eventually become Federal debt.


Its a slow down in the housing market.
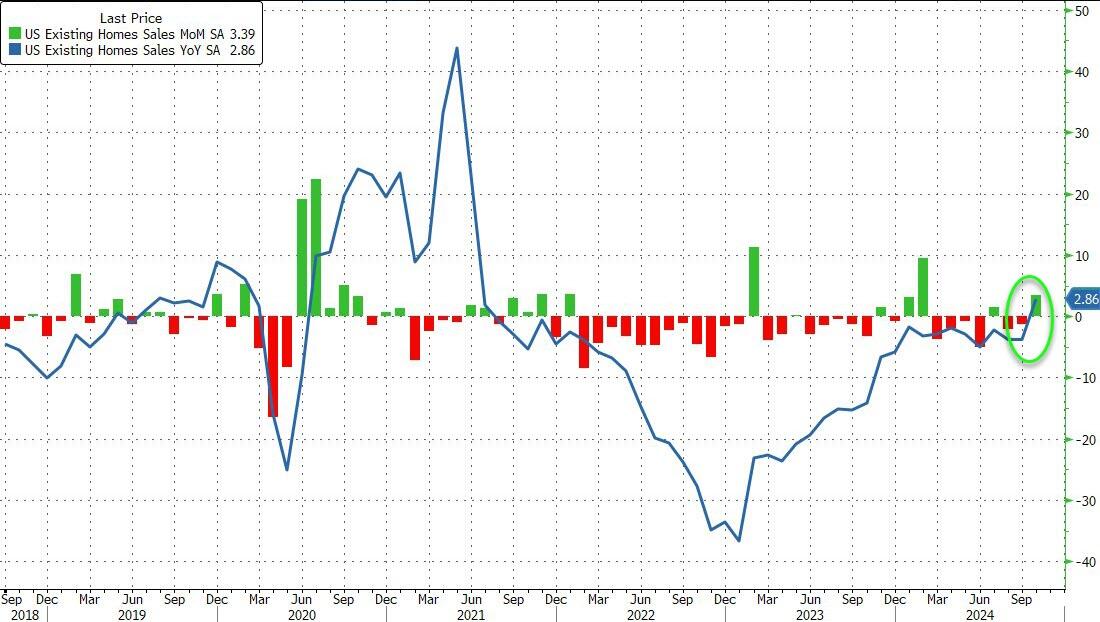
Existing Home Sales were expected to rebound modestly in October (+2.9% MoM) after dropping for 6 of the last 7 months to the lowest levels since 2010, and they did. Sales rose 3.4% MoM (a beat) but thanks to a downward revision for September from -1.0% to -1.3% MoM. What is most shocking about the shift is that it pushed the YoY change for existing home sales positive (+2.9% YoY) for the first time since July 2021…
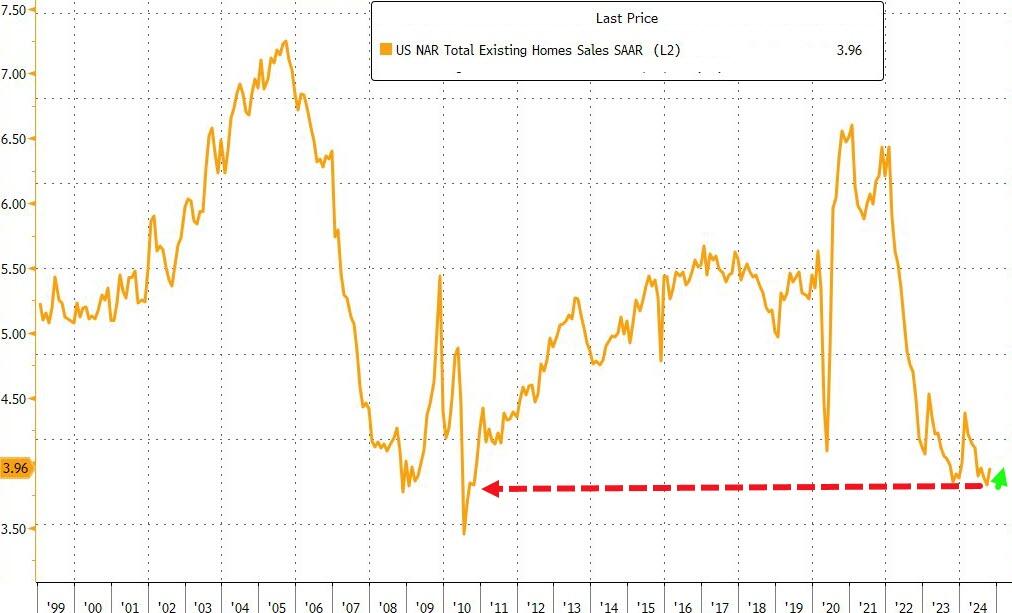
…but in context, that shift up to 3.96mm SAAR homes sold is nothing…
High borrowing costs have led to a shortage of previously owned homes on the market, discouraging many would-be home sellers from listing their properties for sale and having to part with their current low financing costs.
“Additional job gains and continued economic growth appear assured, resulting in growing housing demand,” NAR Chief Economist Lawrence Yun said in a prepared statement.
“While mortgage rates remain elevated, they are expected to stabilize.”
Last month, the inventory of available homes edged up 0.7% to 1.37 million, continuing to trend higher although well below pre-pandemic levels.
Despite the weakness in sales, tight inventory is keeping prices elevated, yielding one of the least affordable housing markets on record. The median sale price last month increased 4% from a year earlier to $407,200, the highest ever for any October, the NAR figures show.
Contract signings rose in all four US regions, led by a 6.7% jump in the Midwest.
Sales of single-family homes increased 3.5% in October; purchases of condominiums and co-ops were up 2.7%
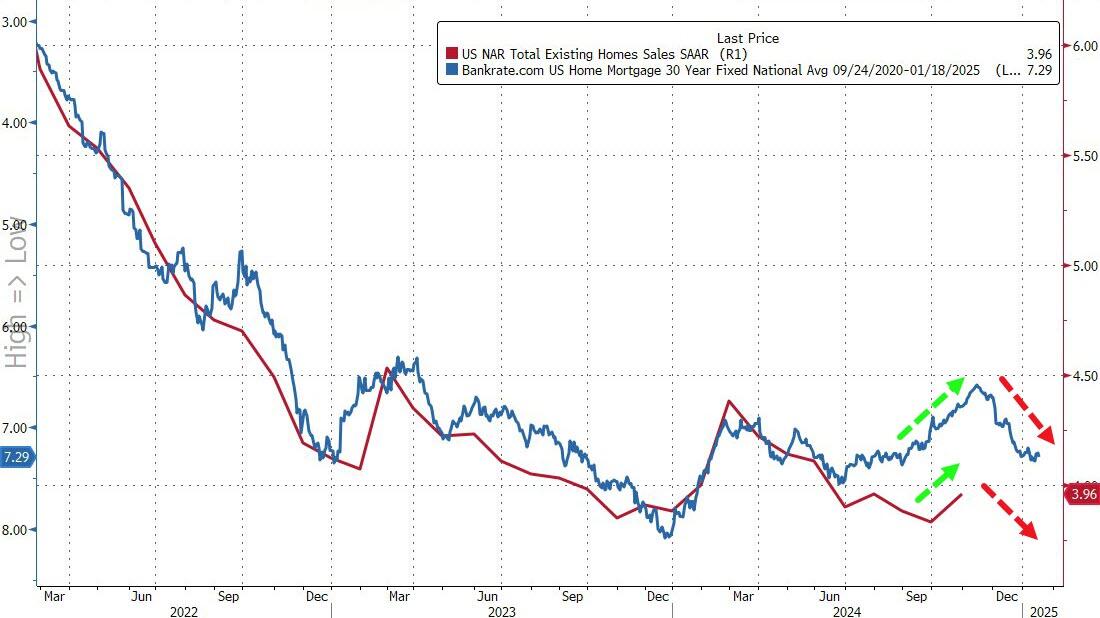
Finally, while that’s all very exciting – a scintilla of growth off almost record lows – the fecal matter is about to strike the rotating object as rising mortgage rates lagged impact threatens…
In October, 59% of homes sold were on the market for less than a month, compared with 57% in September, and 19% sold above the list price. Properties remained on the market for 29 days on average, compared with 28 days in the previous month. First-time buyers made up 27% of purchases, still historically low.
Fortunately, the Biden/Harris administration is winding down. On the mortgage side, the mortgage market is already gone under Biden/Harris where mortgage purchase applications are down a whopping 60%.
Mortgage applications increased 1.7 percent from one week earlier, according to data from the Mortgage Bankers Association’s (MBA) Weekly Mortgage Applications Survey for the week ending November 15, 2024.
The Market Composite Index, a measure of mortgage loan application volume, increased 1.7 percent on a seasonally adjusted basis from one week earlier. On an unadjusted basis, the Index decreased 1 percent compared with the previous week. The seasonally adjusted Purchase Index increased 2 percent from one week earlier. The unadjusted Purchase Index decreased 3 percent compared with the previous week and was 1 percent lower than the same week one year ago. And down -60% under Biden/Harris.

The Refinance Index increased 2 percent from the previous week and was 43 percent higher than the same week one year ago.

Slowing economy, rising rates, too expensive housing. Not a good sign for the mortgage market.
As Biden/Harris approve of Ukraine launching missiles against Russia risking nuclear war, we are witnessing a slow down in the US economy. This time, housing starts and permits.
US Housing Starts and Building Permits disappointed in October with the former dropping 3.1% MoM (-1.5% exp) and -0.6% MoM (+0.7% exp) respectively. This is the second straight month of declines for both measures of housing activity.
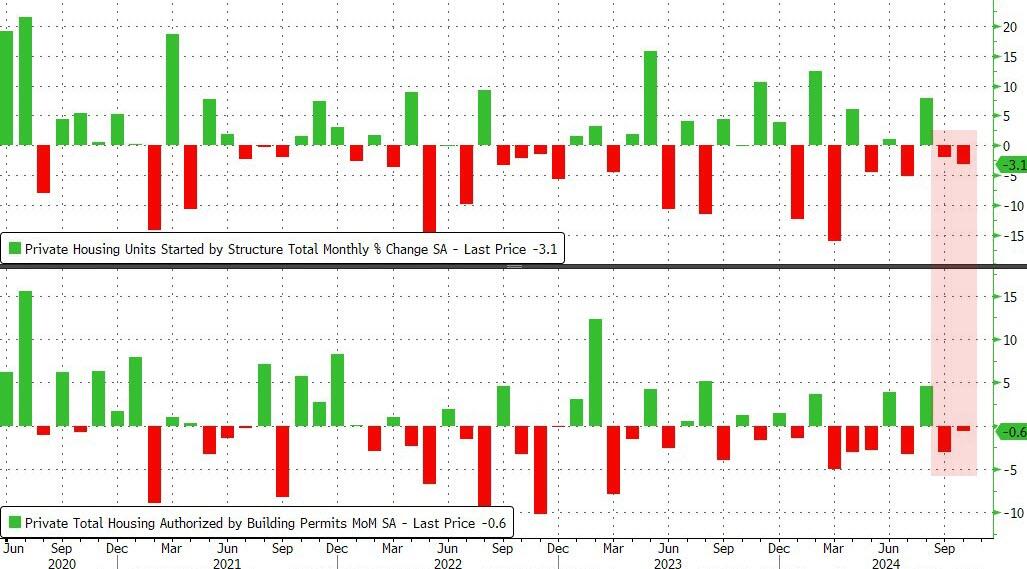
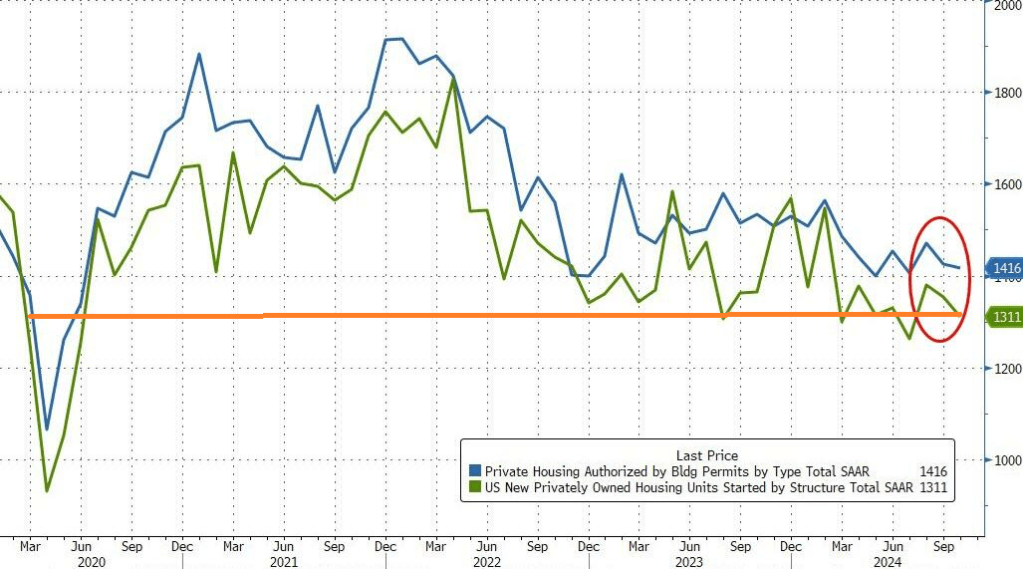
That pulled the SAAR totals down to four month lows – hovering just above COVID lockdown levels…
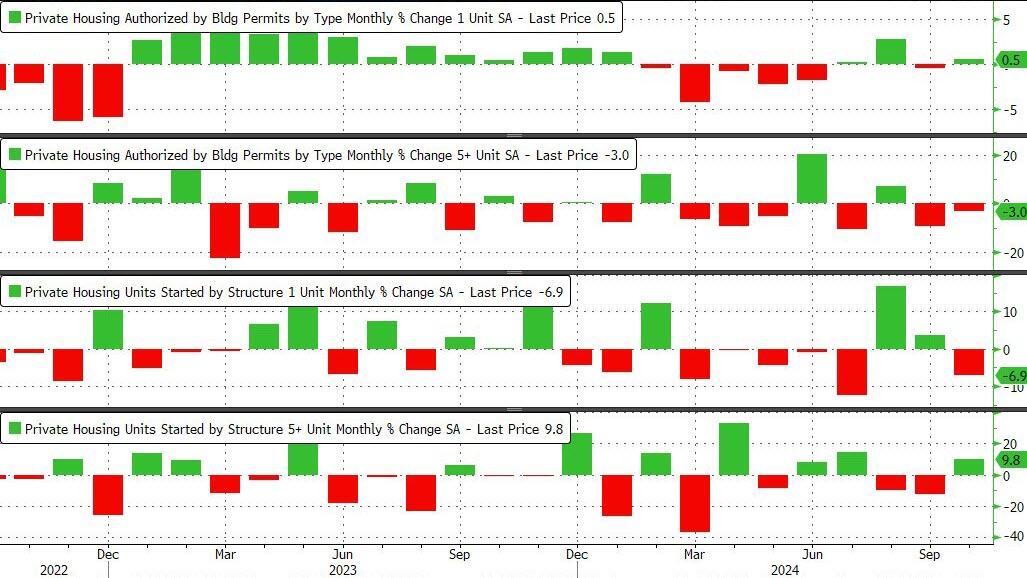
Under the hood, it was very mixed with Single-family permits rising and multifamily permits dropped. Single-family Starts plunged while multi-family Starts jumped…
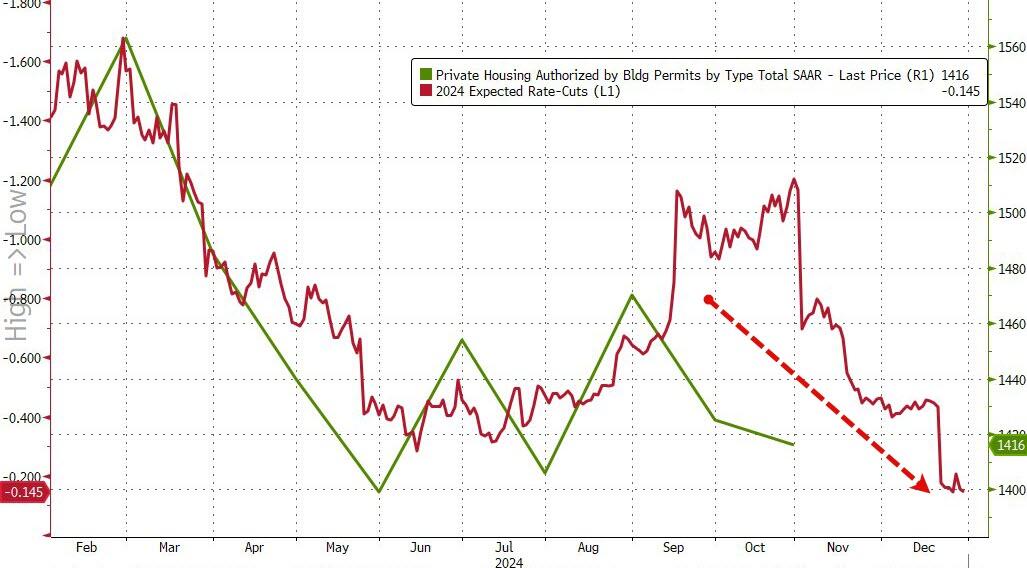
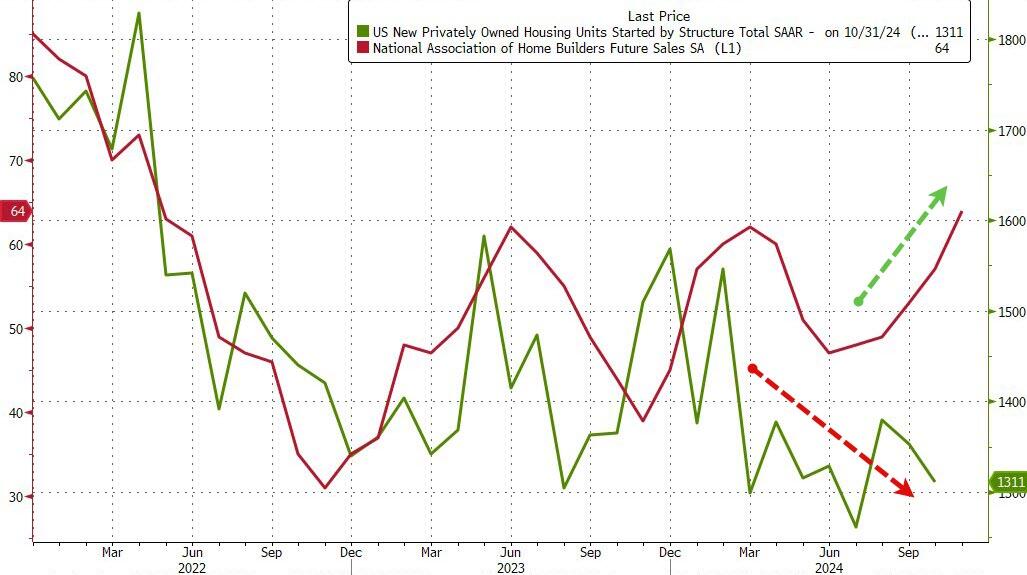
As rate-cut expectations have fallen, so have homebuilders actions it seems…
But homebuilder ‘hope’ remains high…
With Trump back in charge, how much will Powell and his pals really want to cut rates now?
There is one way out of the inflation trap. And it’s drill, baby, drill!
For the 53rd straight month, core consumer prices rose on a MoM basis in October with the YoY pace re-accelerating to +3.33%.

The shelter index increased 4.9 percent over the last year, accounting for over 65 percent of the total 12-month increase in the all items less food and energy index.

Thank goodness Harris can’t try to impliment her ridiculous plans to boost housing!
Glad to see Vivek Ramaswamy and Elon Musk (the NEW Two Bobs from Office Space) cleaning up the mess in Washington DC.


You must be logged in to post a comment.