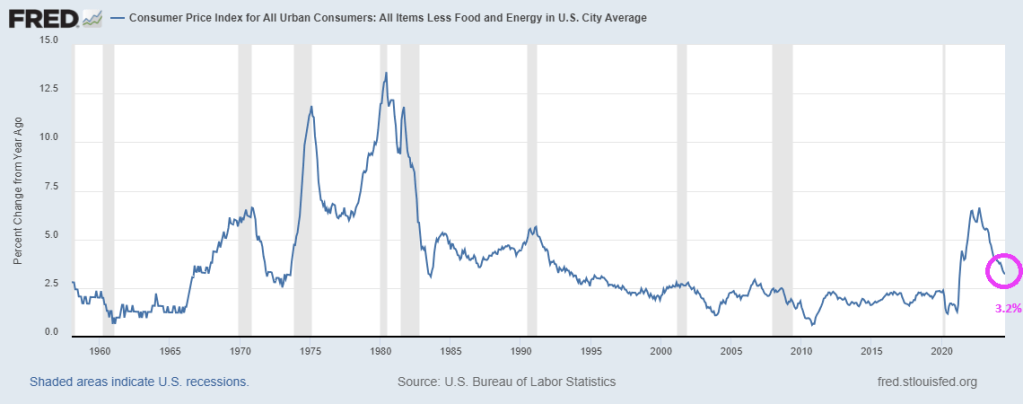
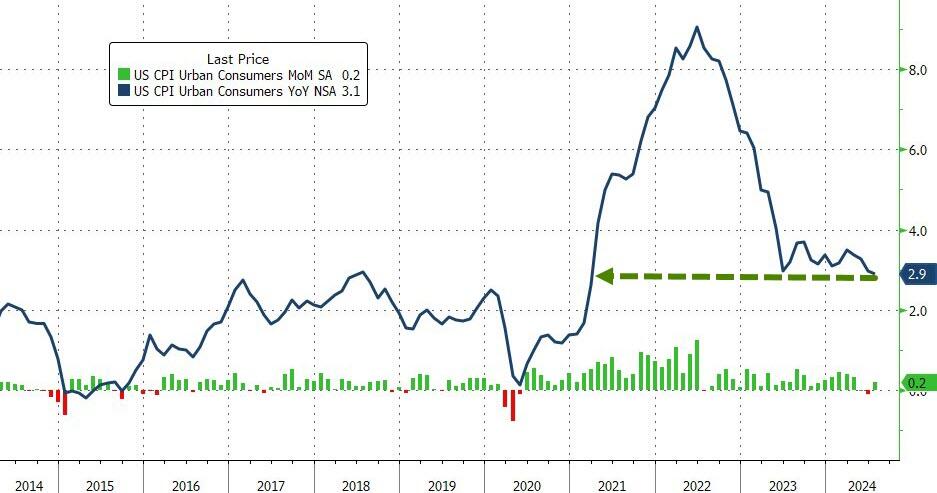
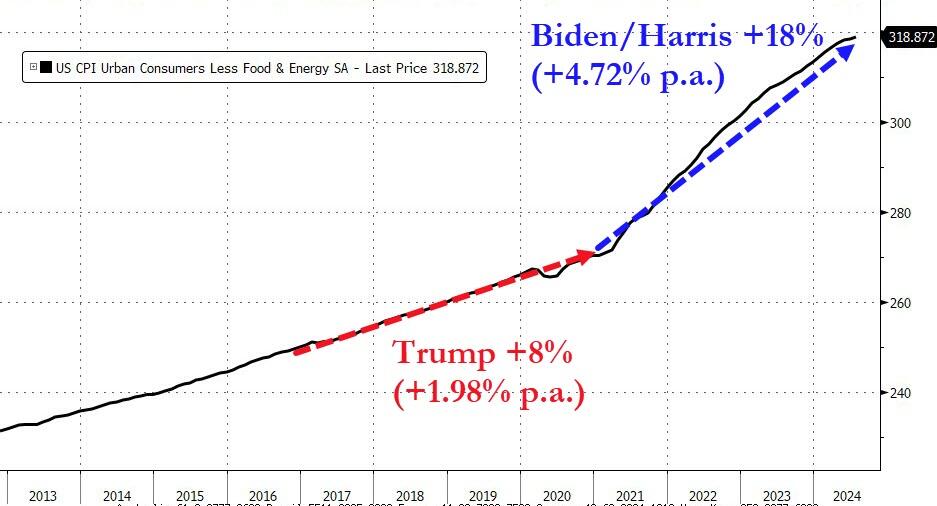
Having put inflation fully in the rearview mirror, the “Powell payrolls pivot” is now complete because as the Fed chair said, “the cooling in labor market conditions is unmistakable” even if it was quite mistakable to the Biden admin’s presstitutes as recently as one month ago.
Which is also why it was imperative for the Biden labor department to admit the truth about the deteriorating labor market: without that -818K revision earlier this week, the Fed would have some pushback to turning fully dovish. But now that we know that a third of the job gains in the last year of Bidenomics were bogus…well, please come save us Chairman Fed.
Or, as TradeStation head of strategy David Russell said, “here comes the punchbowl. Jerome Powell came out swinging today with a litany of dovish signals. He said inflation is on a sustainable path lower and talked about how the job market has cooled to pre-pandemic levels. He drove the point home with a clear call for adjusting policy.”
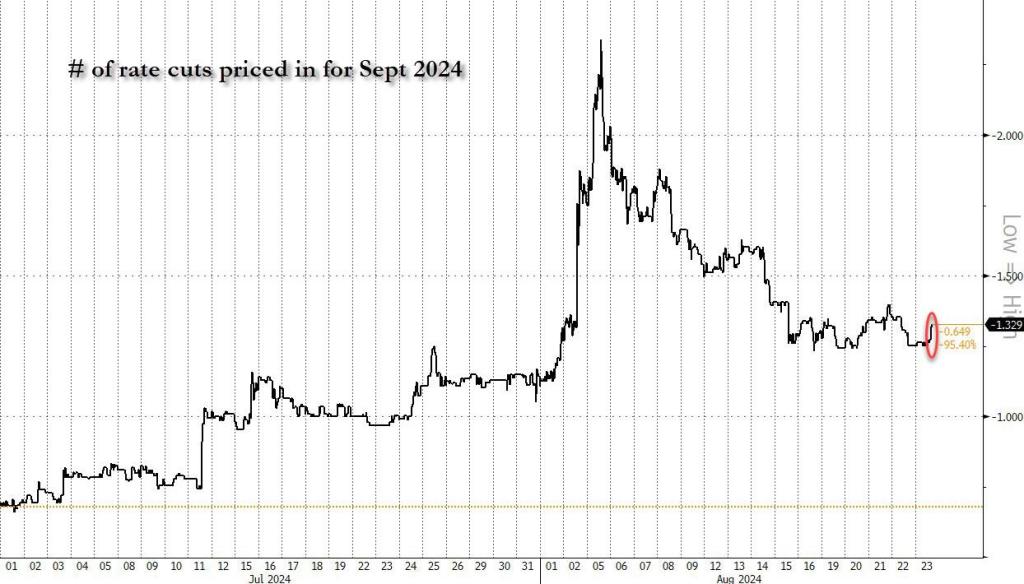
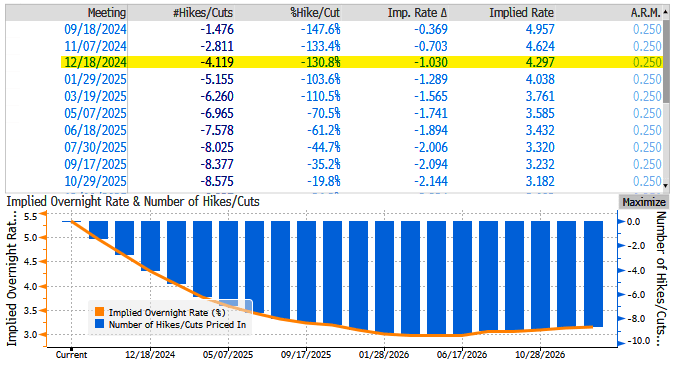
The market agreed, and quickly cemented at least one rate cut while also pricing in as much as 33% odds of a 50bps rate cut.
Which is all great: after all as we have long said, with the November elections looming, the Fed will do everything to make sure the establishment candidate isn’t distracted by such trivial things as a market crash.
There are just four small problems with this.
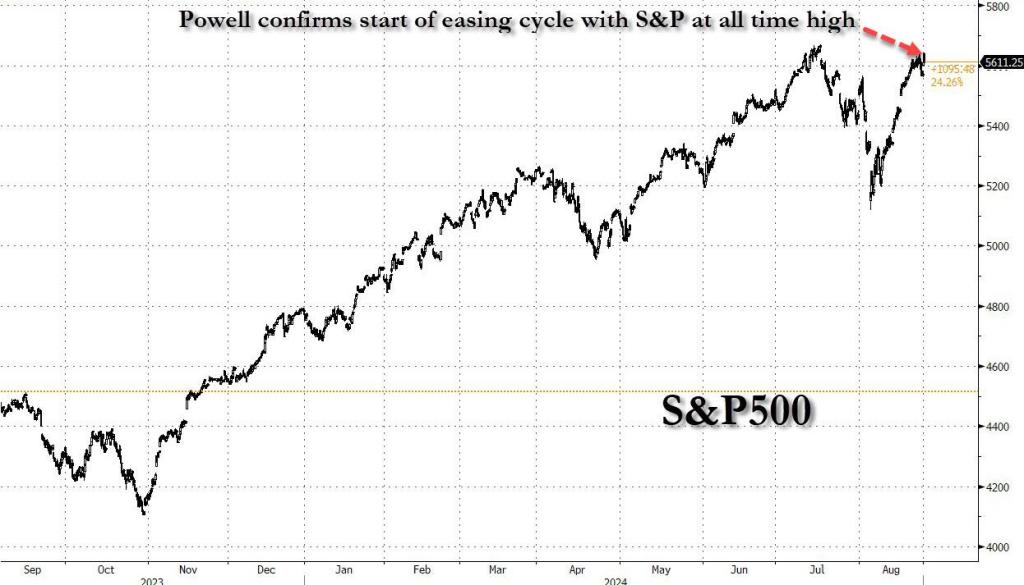
First: the Fed will end its tightening cycle and starts the next easing cycle with stocks at all time highs, something that has never before happened in the history of capital markets!
It means that, unless the current expansion ends in a gruesome recession which crushes the economy, the S&P is about to enter a full-blown bubble, which in turn will burst in even more spectacular fashion and force the Fed to not only cut back to ZIRP, but activate NIRP (just like Japan did years ago) and also go right back to QE and buying bonds ETFs. For now, however, as in the next three months ahead of the elections, all shall be well and should serve the all time high in the market to Kamala Harris on a silver platter…. which is precisely why the Fed is doing what it is doing.
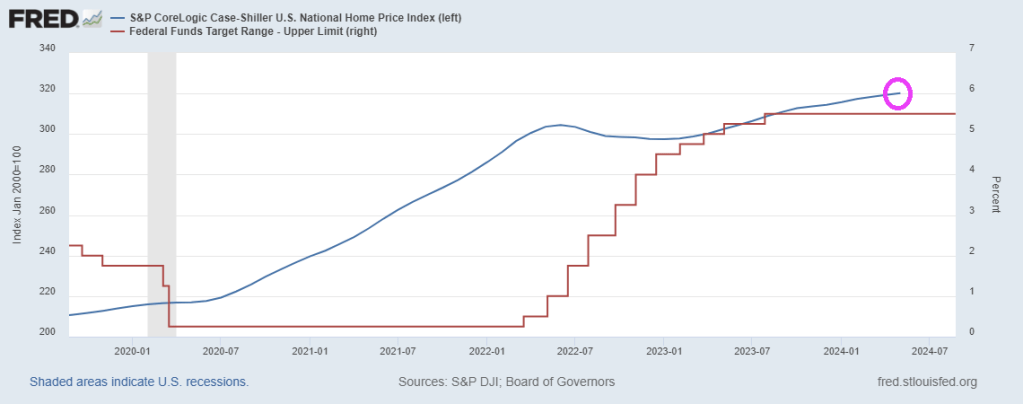
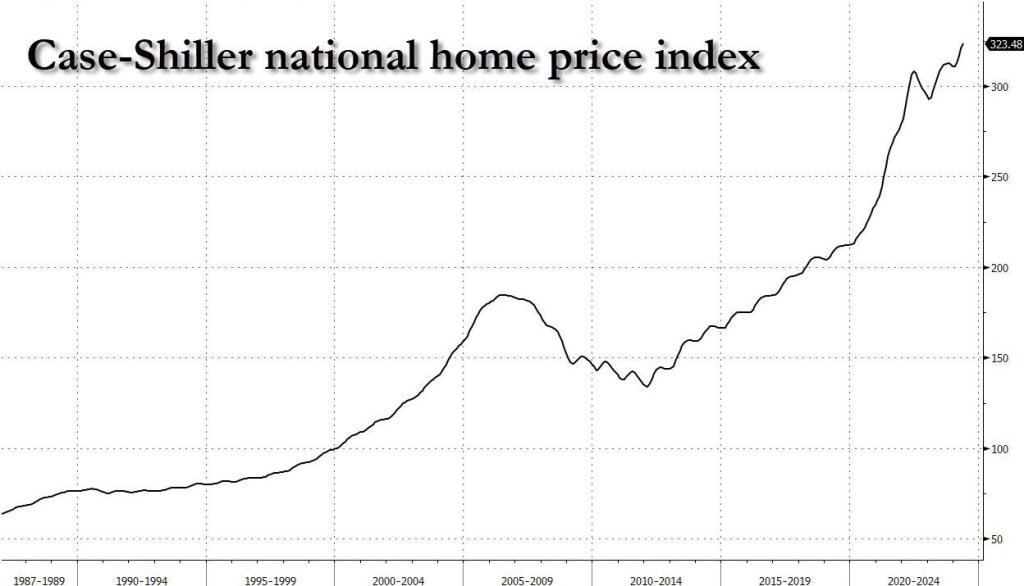
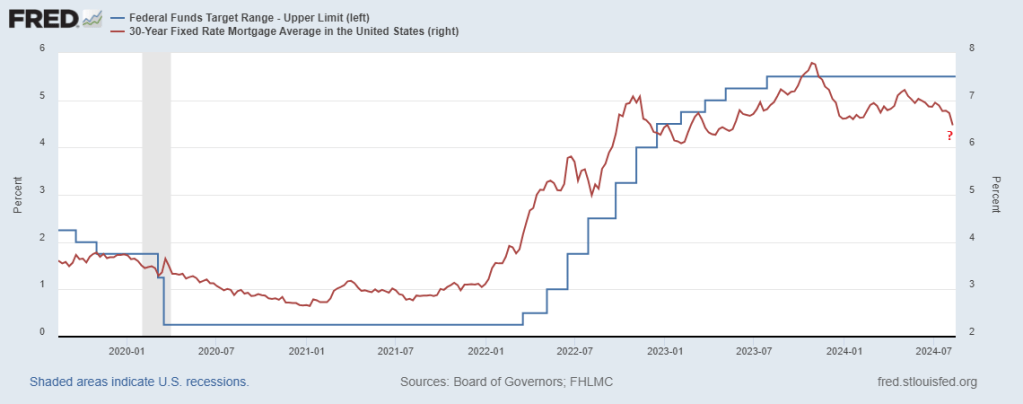
Second, this is also the first time in history when the Fed has aborted a tightening cycle having achieved zero home price easing. Indeed, one look at the case-shiller index shows that home prices are the highest they have ever been…
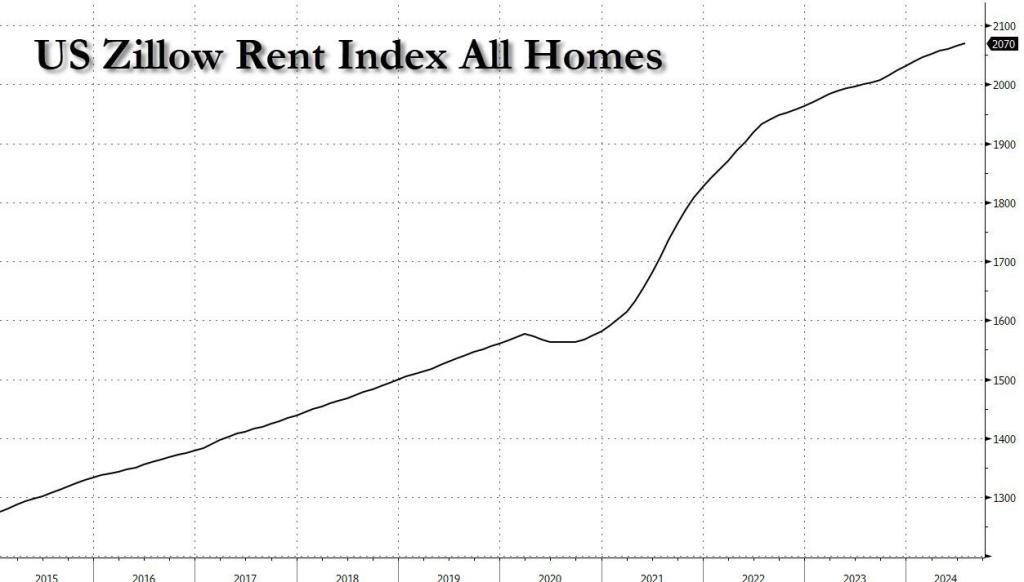
… as are actual asking rents according to Zillow (not that delayed aberration known as Owner-Equivalent Rent).
And then you have Kamala’s promise to provides $25,000 in new home purchase subsidies, which will go straight to the asking price, sending prices even higher.
In short, both home prices and rents, already at record high, are about to go record-er…
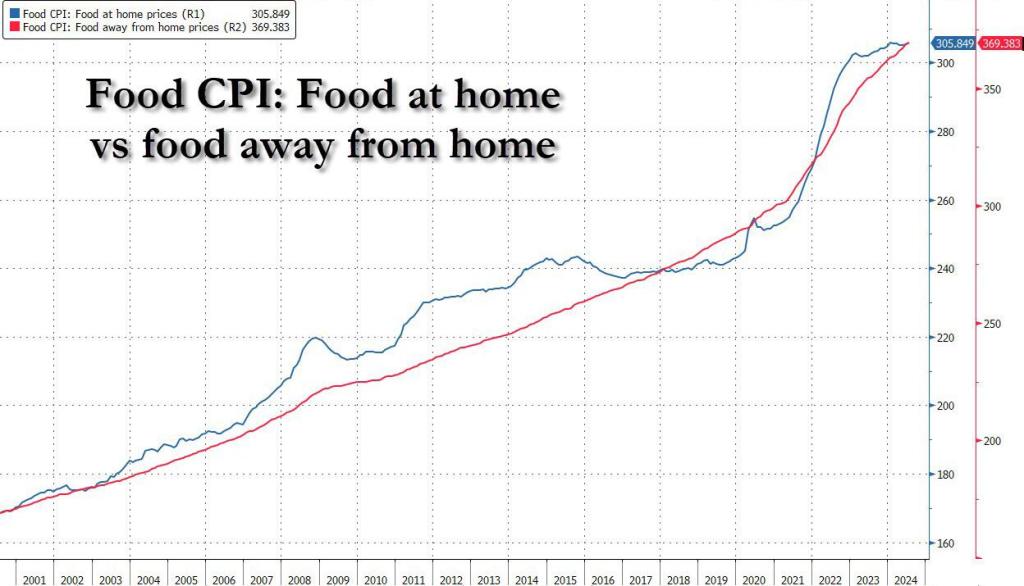
Third, while one can technically live without housing or rent, one still needs to eat. And here we find another problem, because not only did the Fed’s rate hikes not contain stock, home or rent prices, but food prices – both at home and away from home – are also at all time high! And guess what cutting rates and stimulating the economy will do to food prices from this point on…
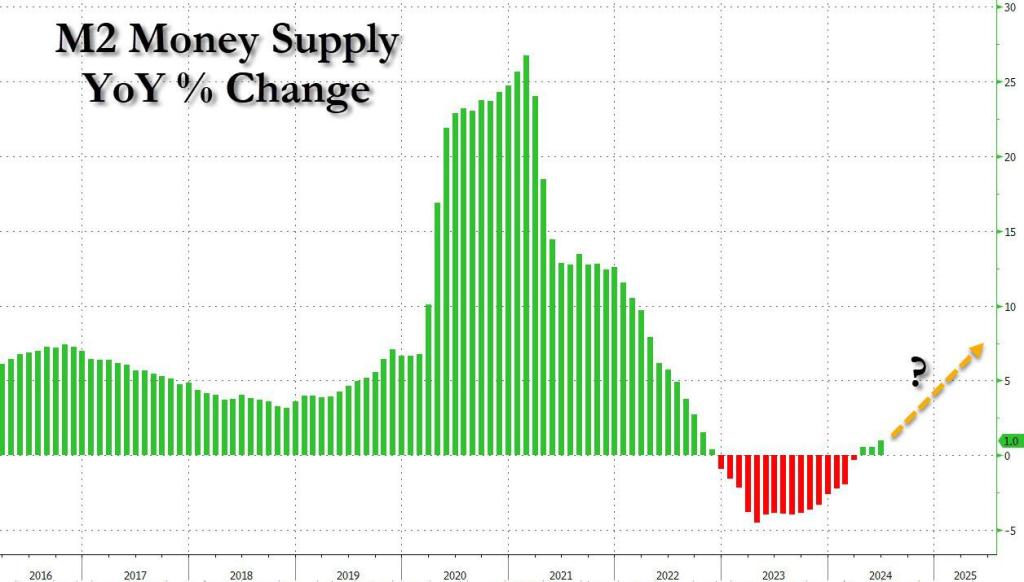
Fourth, and final, the seeds of the next inflationary bubble are already set, because even as the Fed kept conditions tight (or even exceptionally tight), M2 – the broadest money aggregate tracked by the Fed – is once again rising after declining for the past three years.
Of course, there are countless other examples, because besides the above case studies, prices are at all time highs pretty much everywhere else too. But you get the message. The only question is what can possibly go wrong with the Fed launching an easing (i.e., monetary stimulus) cycle with prices for pretty much everything, stocks and homes included, at all time highs and rising.
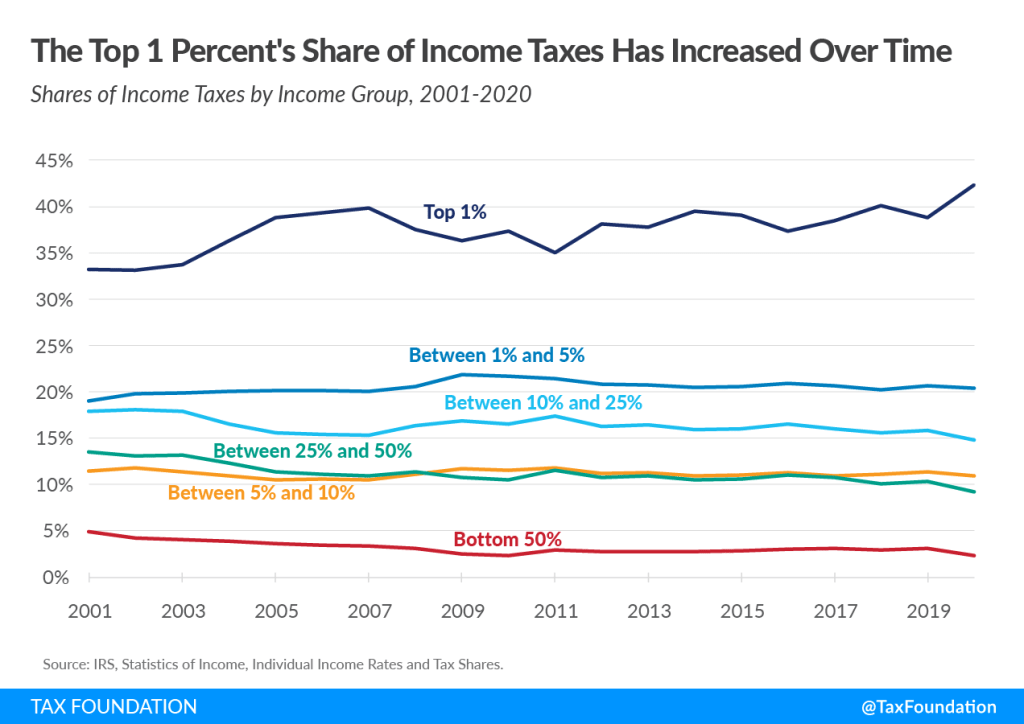
Harris and the DNC gave us an Orwellian picture of the future at the Democrat National Convention. Massive taxation ($5 TRILLION in crippling wealth transfers aka taxes). Of course, the top 1% will bear the brunt of the new taxes.
Small business owners pay business taxes on their individual tax return. The Harris endorsed budget raises the top marginal income tax rate to 39.6% from the current 37%.
Corporate tax rate higher than the EU and communist China.
Kamala Harris wants to hike the current 21% federal corporate income tax rate to 28%, higher than communist China’s 25% and the EU average of 21%, her campaign said Monday.
The Kamala Harris federal 28% rate is higher than the Asia average corporate tax rate of 19.8%, the EU average of 21%, the world average of 23.5%, and the OECD average of 23.7%. (See the Tax Foundation’s comprehensive listing here.)
The Harris federal 28% rate is also higher than Canada (26.2%), the UK (25%) Sweden (20.6%), and even Russia (20%), Afghanistan (20%), and Iraq (15%).
After adding state corporate income taxes, the combined federal-state tax burden in most states will easily exceed 30% under the Harris plan.
The Harris rate hurts the USA vs. China with its 25% rate. And note: Industry sectors of strategic use to the Chinese government pay an even lower rate of 15%.
American workers will bear the brunt of Harris’s corporate tax increase.
The non-partisan Joint Committee on Taxation affirmed in congressional testimony that corporate tax rate hikes hit “labor, laborers.” A study compiled by the Tax Foundation found that “labor bears between 50 percent and 100 percent of the burden of the corporate income tax, with 70 percent or higher the most likely outcome.”
Capital gains and dividends tax more than twice as high as communist China
Here is a direct quote from the Biden-Harris budget: “Together, the proposals would increase the top marginal rate on long-term capital gains and qualified dividends to 44.6 percent.“
Yes, you read that correctly: A Kamala Harris capital gains and dividends tax rate of 44.6%
China’s capital gains tax rate is 20%. Is it wise to have higher taxes than China?
Under the Harris plan, the combined federal-state capital gains tax exceeds 50% in many states. California will face a combined federal-state rate of 57.8%, New Jersey 55.3%, Oregon at 54.5%, Minnesota at 54.4%, and New York state at 53.4%.
Unconstitutionalwealth tax on unrealized gains
The Harris-endorsed budget calls for an annual 25 percent minimum tax on the unrealized gains of individuals with income and assets exceeding $100 million. Once in place, it won’t be long before the threshold is lowered to hit more and more Americans.
Americans overwhelmingly oppose taxes on unrealized gains, by a factor of three to one, including 76% of independents. Americans know that a “gain” isn’t “real” until it is actually realized, in hand.
This Harris tax is similar to the wealth taxes pushed by radical progressives such as Sens. Elizabeth Warren (D-Mass.) and Bernie Sanders (I-Vt.).
Capital gains taxes should only be paid when a gain is realized. Harris’s wealth tax would break with current tax policy and impose tax Americans based on the value of an asset on a particular arbitrary date.
This unprecedented tax would give even more power to the IRS, encourage taxpayers to move assets overseas, and will only expand to hit millions of Americans over time.
A second Death Tax by taking away stepped-up basis when parents die
Harris wants to impose a second Death Tax by taking away stepped-up basis when parents die. This would result in a mandatory capital gains tax at death — separate from, and in addition to — the current Death Tax.
This will impose a steep tax increase and paperwork nightmare for small businesses, farms, and families.
Under current tax law, assets that pass directly to your heirs get a step-up in basis for income tax purposes. It doesn’t matter if you pay estate tax when you die or not. For generations, assets held at death get a stepped-up basis—to market value—when you die. Small businesses count on this.
Wood notes the “proposalwould tax an asset’s unrealized appreciation at transfer. You mean Junior gets taxed whether or not he sells the business? Essentially, yes. The idea that you could build up your small business and escape death tax and income tax to pass it to your kids is on the chopping block.”
“When someone dies and the asset transfers to an heir, that transfer itself will be a taxable event, and the estate is required to pay taxes on the gains as if they sold the asset,” said Howard Gleckman, senior fellow in the Urban-Brookings Tax Policy Center.
Harris’s proposal to take away stepped-up basis has already been tried, and it failed: In 1976 congress eliminated stepped-up basis but it was so complicated and unworkable it was repealed before it took effect.
As noted in a July 3, 1979 New York Times article, it was “impossibly unworkable.”
NYT wrote:
“Almost immediately, however, the new law touched off a flood of complaints as unfair and impossibly unworkable. So many, in fact, that last year Congress retroactively delayed the law’s effective date until 1980 while it struggled again with the issue.“
As noted by the NYT, intense voter blowback ensued:
“Not only were there protests from people who expected the tax to fall on them — family businesses and farms, in particular — bankers and estate lawyers also complained that the rule was a nightmare of paperwork.“
Global tax cartel with 21% minimum tax rate
Harris wants to yoke the U.S. to an international tax cartel and impose a 21% global minimum tax on American businesses. This would be a devastating blow to U.S. competitiveness and sovereignty and eliminate healthy tax competition between countries.
The Biden-Harris administration has for years pursued a misguided international tax regime under the control of the Paris-based Organisation for Economic Co-Operation and Development (OECD). The OECD wants to stamp out tax competition.
Harris’s plan would go well beyond the OECD’s framework for a 15% global minimum tax and instead increase the rate to 21%. And the tax rate will only go up from there since bloated governments won’t have to compete.
Donald Trump had wisely kept the U.S. away from the tax cartel.
Quadrupled tax on stock buybacks — a Harris tax that will hit every American with a 401K or IRAor union pension
Democrats imposed a 1% stock buyback tax in the misnamed Inflation Reduction Act. Now, the Harris endorsed budget calls for quadrupling the tax, the burden of which hits every American with a 401k, IRA, or union pension.
A record share of 401(k) account holders took early withdrawals from their accounts last year for financial emergencies including preventing foreclosures, evictions and paying medical and tuition bills, according to the Wall Street Journal.
Raising taxes and restricting buybacks would further harm the 58 percent of Americans who own stock and more than 60 million workers invested in a 401(k). An additional 16.14 million Americans are invested in 529 education savings accounts.
Quadrupling the buyback tax, would stifle U.S. employers and put Americans at a competitive disadvantage vs. China, which does not have a buyback tax.
30% federal excise tax on electricity used in cryptocurrency mining
The Harris-backed budget imposes a 30% excise tax on the cost of electricity used to mine digital assets. The Treasury Department’s claims that mining has “negative environmental effects and can have environmental justice implications as well as increase energy prices.” Another excuse to raise taxes. It also neglects the fact that private sector innovation is already reducing any preexisting de minimis emissions by switching to “proof of stake” instead of “proof of work” consensus mechanisms.
Applies the wash sale rules to digital assets
The Harris-backed budget would apply the wash sale rule to digital assets. Under current IRS rules, a wash sale occurs when an investor sells “stock or securities” at a loss, and either 30 days before or after the sale, purchases a “substantially identical” stock or security. The IRS prohibits the deduction of losses when a wash sale occurs. The Joint Committee on Taxation (JCT) estimates that this change would increase the tax burden on digital asset transactions by roughly $17 billion.
$37 billion tax on American energy
The Harris-endorsed budget calls for a host of new taxes on oil and gas companies totaling $37 billion. This includes the repealing of expensing for intangible drilling costs (IDC), the use of percent depletion for oil and gas well and additional excise taxes on crude oil production. These tax hikes will be passed on to consumers in the former higher gas prices and energy bills. This tax hike on American energy comes on the heels of Democrats passing roughly $20 billion worth of new energy taxes included in the Inflation Reduction Act.
32% increase to Medicare taxes
Harris endorsed raising Medicare taxes from the current rate of 3.8 percent to 5 percent for individuals making over $400,000 per year, roughly a 32 percent tax hike. The plan reportedly broadens the Net Investment Income Tax (NIIT) to apply to non-passive business income and Harris would also increase the hospital insurance (HI) payroll tax from 0.9 percent to 2.1 percent for individuals earning over $400,000.
Carried interest tax on capital gains
Harris would tax carried interest as ordinary income for individuals earning over $400,000. While the Left labels carried interest as a “loophole” it is actually based on longstanding tax principles. Raising taxes on carried interest capital gains should be rejected. It is a terrible tax policy that would harm economic growth, reduce jobs, and reduce the returns of public pension funds across the country.
Even Sen. Kyrsten Sinema (I-Ariz.) rejected Democrats’ attempt to raise taxes on income from carried interest by blocking this proposal from being included in the Inflation and Reduction Act.
This tax hike would hit private equity, venture capital, real estate partnerships, and their portfolio companies which together account for over 25 million American jobs. In response, firms would downsize and decrease investment, causing both a loss of jobs and a reduction in the returns investors see.
$24 billionretirement tax
The Harris proposal calls for capping the retirement plan benefits of certain individuals. The White House projects this limitation on retirement benefits will raise $24 billion in taxes from individuals with retirement account balances above $10 million and earnings above $400,000.
Real estate tax hike on Like-Kind exchanges
Harris backs raising taxes on capital gains from real estate transaction by limiting what are knows as 1031 Like-Kind Exchanges to $500,000 in gains.
Under current tax rules, real estate investors can exchange real property used for business for similar real property and defer capital gains tax. Harris’s proposed changes to this tax treatment will hurt individuals and farmers.
An even further-supersized IRS
If you thought Harris and congressional Democrats had already supersized the IRS enough, think again. The Harris budget plan shovels another $104.3 billion to the agency.
Erodes taxpayer rights by making it easier for IRS agents to stack up questionable penalties against taxpayers
Last year the Biden-Harris IRS got caught illegally backdating penalty documents and signatures in U.S. Tax Court in order to run up the bills on taxpayers. The court caught the IRS lying. U.S. Tax Court is generally very deferential to IRS neglect but in this case the court was rightly furious.
While testifying to congress in late 2023, IRS Commissioner Werfel declined to say whether anyone has been fired for this practice. It is suspected the backdating incident was not an isolated occurrence within the IRS. Another indication that the IRS has a severe accountability problem that is only going to get worse.
Due to reforms enacted by Republicans in 1998, IRS agents are currently required to get written approval from their immediate supervisor before imposing penalties on taxpayers. This is designed to protect taxpayers from agent chicanery.
Congressional investigators discovered years of abuse by IRS agents running up the penalty score as an intimidation tactic against taxpayers. Agents would use the threat of penalties as a bargaining chip. The IRS has a history of targeting people who do not have the means to fight back, and unethical agents at employee review time could point to all the penalties they imposed on people who perhaps did not deserve it. So, in 1998 congressional Republicans enacted a taxpayer protection (Section 6751) which requires agents to get personal written approval from their immediate supervisor before sending written penalty letters to taxpayers.
But the Biden-Harris budget allows IRS agents to shop around for sympathetic supervisors anywhere in the building. Harris also wants to scrap the written approval requirement altogether for many penalty scenarios. Agents will abuse this and taxpayers will be the victim.
From the Biden-Harris budget: “In addition, the proposal would expand approval authority from an ‘immediate supervisor’ to any supervisory official, including those that are at higher levels in the management chain or others responsible for review of a potential penalty.”
Won’t be long before agents just go directly to the taxpayer-hostile supervisor on, say, the fourth floor who will sign off on anything. Good luck to taxpayers without the resources to defend themselves in court against an agency with a near-unlimited budget.
Of course, what will the new taxes be spent on? That is REALLY scary. Healthcare for illegal immigrants? Wealth transfer to large donors??
Well, it is already getting nasty on the employment front with jobs transitioning to unemployment at a rapid rate.
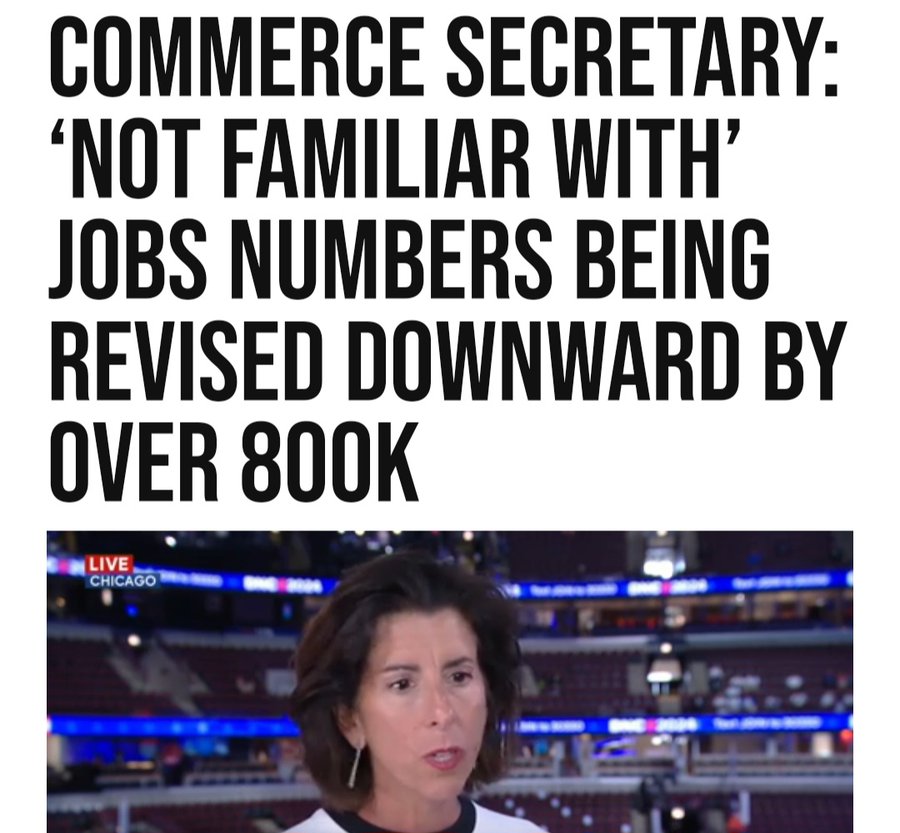
The scary thing about the BLS overstating job gains by Biden/Harris by almost 1 million jobs is that US Commerce Secretary Gina “The Goofball” Raimondo didn’t even know about the Philly Fed report.
Back in March, when most of Wall Street and economists still believed the lies spewed forth by the Biden Bureau of Labor Statistics, which intentionally uses inaccurate, rushed “data” from the Establishment survey which is meant to pad sentiment and make the economy appear far stronger than it is for propaganda purposes (as one can see by the constant monthly downward revisions), we did an in-depth analysis looking at the actual, “uncooked” numbers published by the Philadelphia Fed preview of the annual Quarterly Census of Employment and Wages employment revision, and warned our readers that actual US payrolls are overstated by at least 800,000.
Specifically, we concluded that “the BLS had overstated payrolls by 800,000 through Dec 2023 (and more if one were to extend the data series into 2024)” and added that “it’s truly statistically remarkable how every time the data error is in favor of a stronger, if fake, economy.”
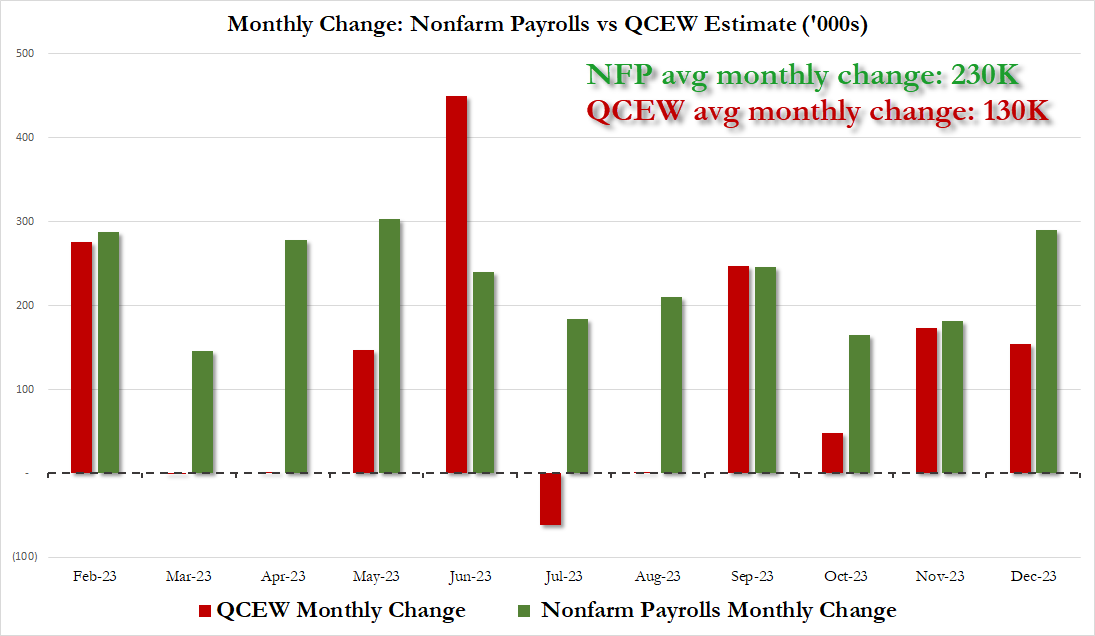
Furthermore, we also noted that the revision “also means that far from the stellar 230K average monthly increase in payrolls in 2023, which the White House would spin time and again as direct evidence of the benefits of Bidenomics, the true average monthly payroll increase in 2023 was only 130K! The full monthly change in payrolls as originally reported by the BLS (in green) and the actual monthly number, as per the QCEW (in red) is shown below.”
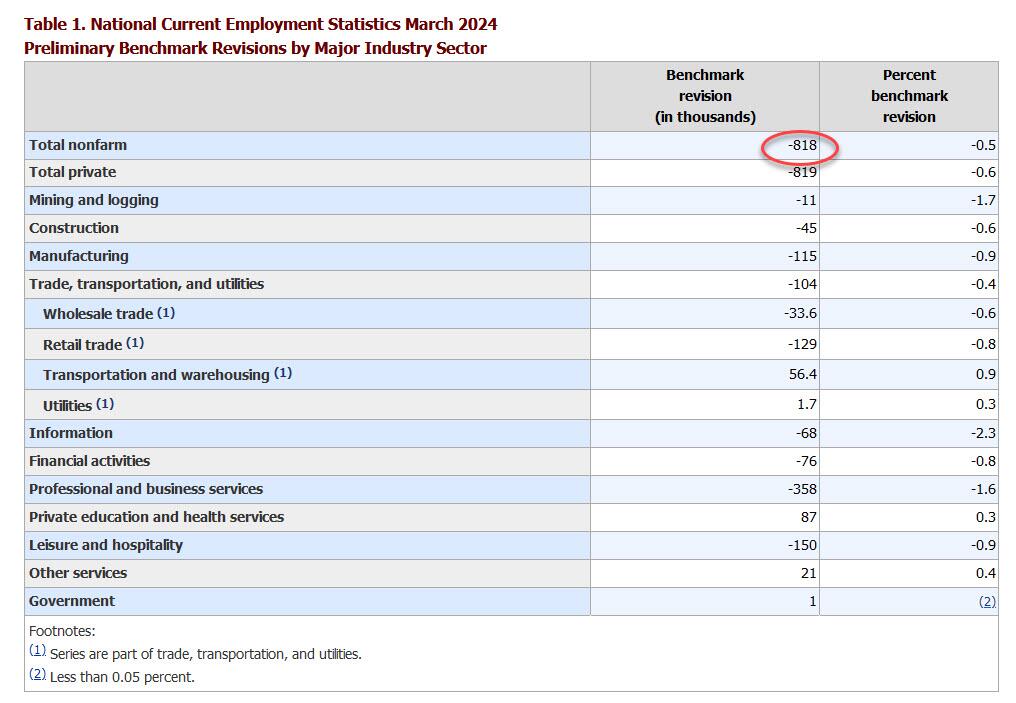
This matters because as we reminded our followers this weekend, today at 10am, the BLS would publish its annual nonfarm payrolls benchmark revision where it would unveil as , which it did (with the usual 35 minute delay because that’s the kind of service $35 trillion in debt buys you), and it confirmed that we were right almost to the dot, because as the BLS unveiled in its CES Preliminary Benchmark Announcement, “the preliminary estimate of the benchmark revision indicates an adjustment to March 2024 total nonfarm employment of -818,000 (-0.5 percent)” or just above the 800,000 was said to expect back in March.
The revision is mainly due to the highest-paying sectors: i.e., professional services -358k, leisure -150k, and manufacturing -115k. Not at all surprising: government was revised +1,000.
As an aside, while the data were scheduled to be released at 10 a.m. in Washington but didn’t appear on the BLS’s website for more than a half hour later. A spokesperson for the agency didn’t answer Bloomberg’s questions as to why the figures were delayed, but we have some pretty good guesses about the panic that gripped the BLS as they realized they needed a green lights from the propaganda ministry before going live with this number.
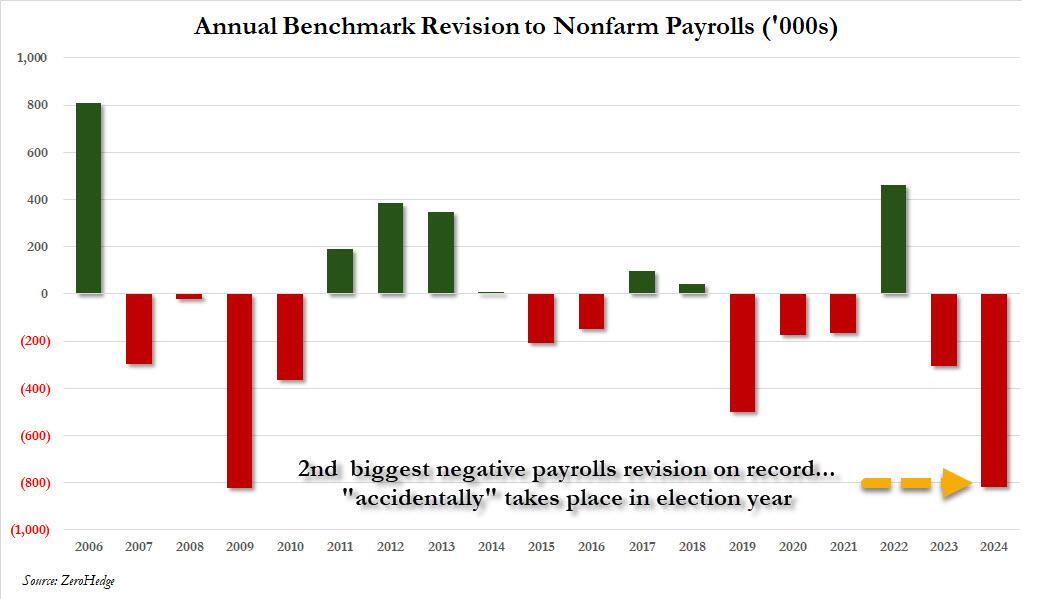
How big is the 818,000 revision in context? As the chart below shows, the 2024 revision was the biggest in the past decade, and the second biggest on record, with just the 824K downward revision in 2009 just (barely) greater.
The revisions confirm that – as we had been warning for much of the past year – the labor market started moderating much sooner than flawed conventional wisdom thought. It wasn’t until earlier this month that markets and economists grew concerned with the release of the July jobs report. That set off alarm bells with a weak pace of hiring and a fourth month of rising unemployment, but other metrics like jobless claims and vacancies have suggested a more moderate slowdown.
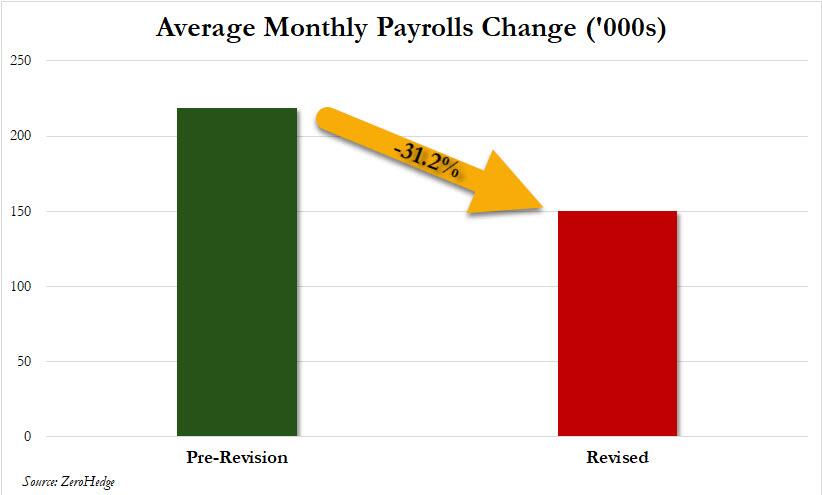
Putting it all together, we now know – as we reported first back in March – that the labor market is, and was, far weaker than conventionally believed. In fact, no less than 800,000 payrolls would end up “missing” when one uses the far more accurate Quarterly Census of Employment and Wages data rather than the BLS’ woefully inaccurate and politically mandated payrolls “data”, and if one looks back the the monthly gains across most of 2023, one gets not 218K jobs added on average every month but rather 150K, a 31% decline. Needless to say, the market would look very different if it had known that effectively all the payroll “beats” of the past year would be deleted!
Of course, none of that paints Bidenomics, or Kamalanomics, or whatever it is now, in a flattering picture, because while one can at least pretend that issuing $1 trillion in debt every 100 days to add 3 million jos per year is somewhat acceptable, learning that that ridiculous amount buys 800,000 jobs less is hardly the endorsement that the White House needs. On the flip side, pretending that the US had added an additional 800,000 jobs in the past year is precisely what Biden, and now, Kamala would have wanted to generate the kind of buzz and momentum that somehow translates into the “greatest economy ever”… at least until it is all revised away as the admin’s lies finally wash away.
What is the implication for the market? Well, as UBS trader Leo He correctly notes, “the Fed is well aware of nonfarm payrolls (establishment survey) overstating the job market, but unemployment rate (household survey) underestimating the job market” and he goes on to quote Governor Bowman’s speech on Tuesday:
“There are also risks that the labor market has not been as strong as the payroll data have been indicating, and it appears that the recent rise in unemployment may be exaggerating the degree of cooling in labor markets. The Q4 Quarterly Census of Employment and Wages (QCEW) report suggests that job gains have been consistently overstated in the establishment survey since March of last year, while the household survey unemployment data have become less accurate as response rates have appreciably declined since the pandemic. The rise in the unemployment rate this year largely reflects weaker hiring, as job searchers entering the labor force are taking longer to find work, and layoffs remain low. It is also likely that some temporary factors contributed to the soft July employment report. The rise in the unemployment rate in July was largely accounted for by workers who are experiencing a temporary layoff and are more likely to be rehired in coming months. Hurricane Beryl also likely contributed to weaker job gains, as the number of workers not working due to bad weather increased significantly last month.”
At the end of the day, all this does is cement the Fed’s 25bps rate cut next month.
As for broader socio-political implications, the reactions are already pouring in with those on the blue side of the spectrum pretending nothing happened, while those on the other side of the aisle raging at what has now become clear propaganda by the highly politicized Department of Labor. To wit, here is RFK, Jr., proposed VP candidate Nicole Shanahan slamming the BLS, and using our data to do so:
The Bureau of Labor Statistics (BLS) has long been used as a tool of propaganda by the executive branch. Here’s how: they distort definitions, manipulate data, exclude discouraged workers, and revise past reports to create narratives that fit the agenda of whichever administration is in power. This skews the actual economic picture and misleads citizens about the true state of our economy. It’s like a game of musical chairs, and neither side wants to be caught standing when the music stops. The Constitution doesn’t grant the government the authority to track unemployment statistics, so why do we even have this agency? Perhaps it’s time to get rid of it. Their $750M budget could surely be put to better use, and private companies already track U.S. unemployment for free. Win-win.
We agree: back in March we concluded our article, which predicted today’s revision with near 100% accuracy, by warning that the staggering size of the revised data “is also why nobody in the mainstream media – which is now nothing more than the PR smokescreen for the Biden puppetmasters, the government and the deep state – will ever mention this report.”
Today it will be more difficult for the propaganda press to ignore it.
At least she should speak in front of a Communist Chinese flag! Her true master.
On Tuesday, it was announced that Presidential candidate Kamala Harris would be supporting President Joe Biden’s tax proposals for 2025, which include a 44.6% capital gains rate and a 25% tax on unrealized gains.
Having used up all of the rest of the batshit, insane, counterintuitive economic dirty tricks left in the “we’ll literally do anything but cut spending” bag, the Biden administration began pushing this tax idea in April 2024 when I first wrote about it. Unrealized gains taxation could be the most destructive idea for our country since prohibition, I joked at the time.
As part of its budget proposal for the 2025 fiscal year, the Biden administration was trying to raise an addition $4.3 trillion over 10 years in the worst way possible: imposing a minimum tax equal to 25 percent of a taxpayer’s taxable income and unrealized capital gains less the sum of their regular tax, for taxpayers with wealth over $100 million.
Biden/Harris pushes taxes way beyond the revenue maximing point, down to the point of deminishing revenues and economic growth. Here is the Laffer Curve.
Putting aside the fact that this high-risk idea only amounts to a pittance, $430 billion per year, the introduction of taxing unrealized gains could be one of the worst slippery slopes we ever dare to roll our country’s economy down.
We could save $1 trillion just by not sending $100 billion a year to other nations for starters.
A tax on unrealized capital gains means that individuals are penalized for owning appreciating assets, regardless of whether they have realized any actual income from selling them.
If you purchased a stock for $100 this year, for example, and it increased to $110 next year, you would pay the assigned tax rate on the $10 capital gain. You didn’t sell the asset, so you don’t realize the $10 appreciation, but must pay the tax regardless.
Taxing unrealized capital gains contradicts the basic principles of fairness and property rights essential for a free and prosperous society. Taxation, if we’re going to have it on income, should be based on actual income earned, not on paper gains that may never materialize.
mplementing such a tax not only deeply infringes upon personal liberty and private property rights — but I can’t help but think about how it also sets a destructive wrecking ball rolling down a slippery slope for the first time in our nation’s history.
And, given the precarious state of our nation’s finances, it doesn’t seem like the best time to start spitballing about new risky ideas that may or may not catch on only because they sound like they are addressing the problem of a widening wealth gap that Federal Reserve policies created and continue to exacerbate to begin with.
If the administration really wanted to address the problem of wealth inequality, it would be setting its sights on the central bank that sacrificed price stability so it could spray trillions of dollars in “stimulus” toward financial assets, while cutting American families paltry checks of just $600, during COVID. When I did the math during COVID, the total amount spent to bail out the country.
Why do we trust any Democrat politiician? I certainly don’t!
Taxing unrealized gains would risk mass sale of US assets and therRich fleeing.
After watching the Democrat hate fest last night (Aka, the Democrat National Convention), I was not shocked that the DNC platform looked like a playbook to destroy the US economy. High taxes, endless spending, more regulations, etc. Not a word about the staggering side of the US debt load … with Harris’ economic plan projected to add a whopping $25 trillon in debt to the already massive $35+ trillion debt load.
And not a mention that US interest payments on the national debt already exceeds defense spending. And is booming!
Of course, Harris’s economic vision is a continutation of Biden’s disastrous visions (which are Obama’s vision of US obliteration). Most politicians in Congress are millionaires (including Bernie Sanders) and won’t suffer from their insane “progressive” policies. Watching last night’s DNC hatefest was like watching nasty 2nd graders having a party.
Of course, the drove of anti-American, anti-properity speakers spewing venom (I hate Hillary’s flat-tone speaking style) like Hillary, Jaime Raskin (aka, Rasputin), AOC, etc. all failed to acknowledge to acknowledge the already monstrous size of the US debt ($35+ trillion) or the massive size of the unfunded promises ($218+ TRILLION). Of course not.
The handle the staggering interest payments that will crowd out other spending, The Federal Reserve will be forced to lower rates.
Of course, Democrats will wheel out “economists” like Robert Reich who say that the debt doesn’t matter.
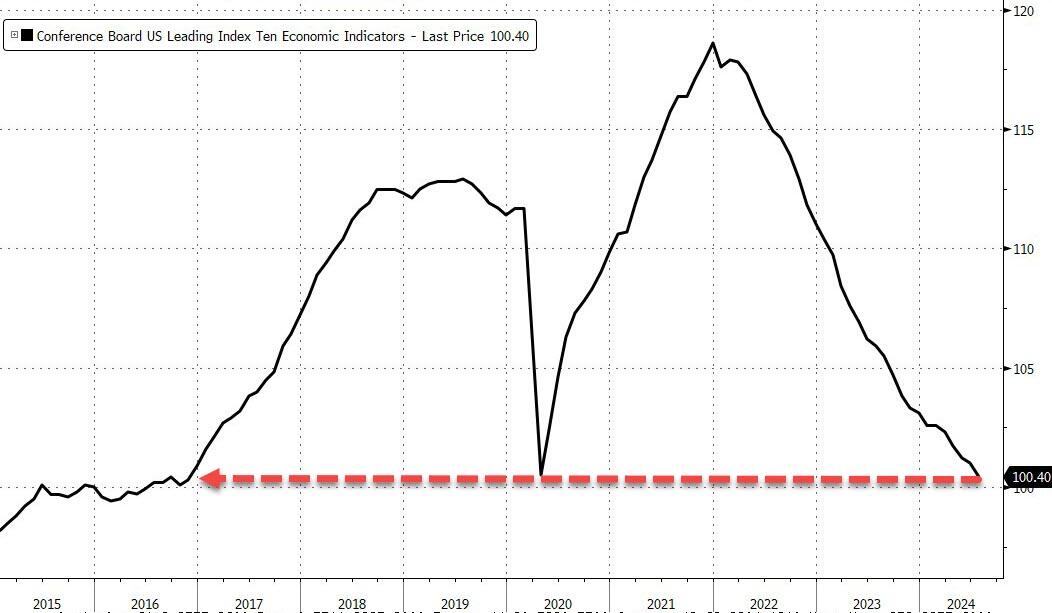
…and the head of The Conference Board says ‘nothing to see here’…
“The LEI continues to fall on a month-over-month basis, but the six-month annual growth rate no longer signals recession ahead,” said Justyna Zabinska-La Monica, Senior Manager, Business Cycle Indicators, at The Conference Board.
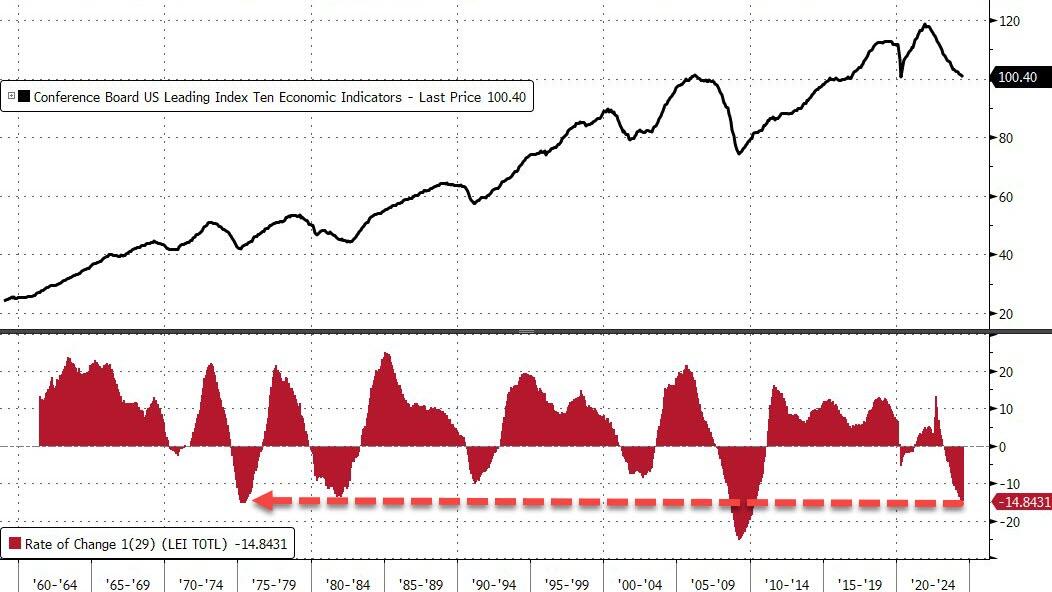
For context, outside of the great financial crisis, this is the worst decline in LEI since the mid ’70s!!!
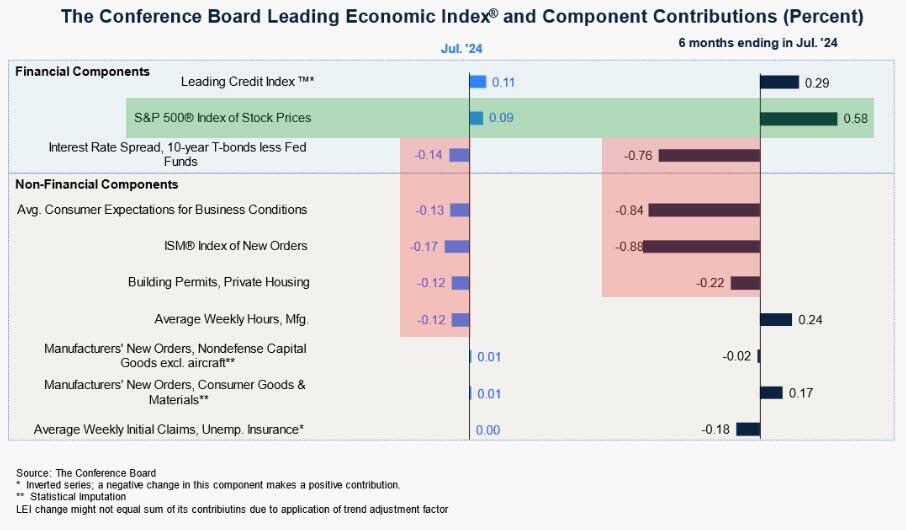
And what is behind the ‘no recession’ call… US equity strength!!
Thank The Feral Reserve for the equity spike!
So, to summarize – almost all the macro data signals weakening growth for years… but because stocks are up (and credit spreads down), there’s no recession anywhere on the horizon!!??
The US is already at $35+ trillion with unfunded liabilties totalling $218+ trillion. Of course, the Biden Administration is attempting to cut Medicare for seniors and raise the price while handing out unlimited benefits to illegal immigrants.
.Given the financial burden of war, the country suspended interest payments on international debt over the last two years, which was set to expire on August 1, 2024.
Without this new debt restructuring, this default would have ranked among the 10 largest in recent history. The last time Ukraine defaulted on its debt was in 2015, after Russia’s invasion of Crimea.
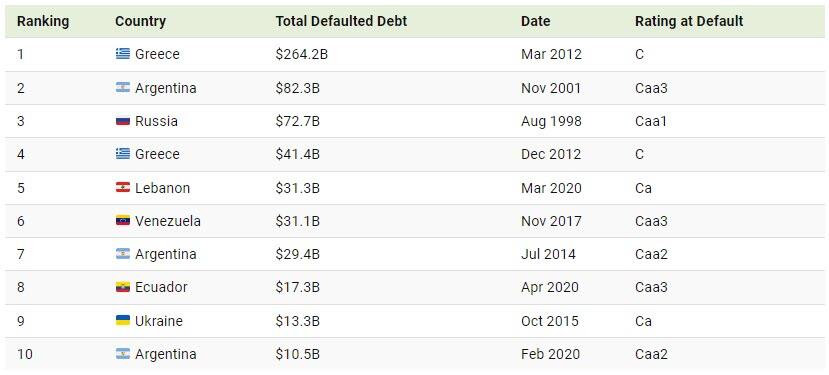
Below, we show the biggest sovereign debt defaults between 1983 and 2022:
Greece’s $264.2 billion default in 2012 stands as the largest overall, unfolding when the country was mired in recession for the fifth consecutive year.
The country defaulted again just nine months later, making it the fourth-largest ever. Leading up to the crash, Greece ran significant deficits despite being one of the fastest-growing countries in Europe. Furthermore, in 2009, the newly elected prime minister revealed that the country was $410 billion in debt—substantially more than previous estimates.
With the second-highest default recorded, Argentina failed to repay interest on $82.3 billion in foreign debt in 2001. Like Greece, it is a repeat offender, defaulting numerous times since independence in 1816. Today, Argentina is the largest debtor to the International Monetary Fund, despite being Latin America’s third-largest economy.
Following next in line is Russia’s 1998 default on $72.7 billion in loans, coinciding with a currency crisis that erased more than two-thirds of the ruble’s value in a matter of weeks. That year, several other countries including Venezuela, Pakistan, and Ukraine defaulted on their debts after the Asian Financial Crisis of 1997 spurred instability in global financial markets.
Just as 1998 saw a wave of defaults, 2020 was a year marked by major debt upheavals. Due to the pandemic and collapsing oil prices, it was a record year for sovereign defaults, reaching seven in total. Among these, Lebanon, Ecuador, and Argentina saw the largest defaults amid deepening fiscal pressures.
Harris is just another free-spending politician who will eventually lead the US into default. But at least Harris/Walz exude joy.
At least Harris/Walz haven’t adopted (stolen) the phrase “Work makes one free”.


You must be logged in to post a comment.