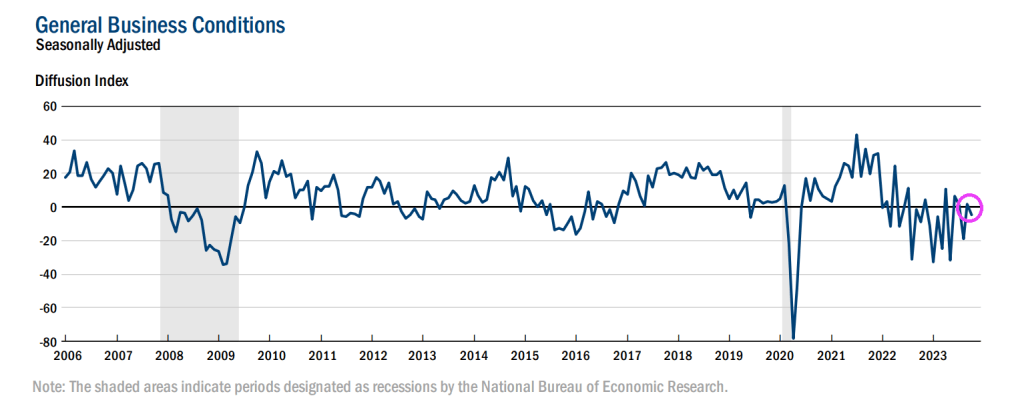
According to the New York Federal Reserve, business activity edged lower in New York State, according to firms responding to the October 2023 Empire State Manufacturing Survey. The headline general business conditions index fell seven points to -4.6. New orders fell slightly, while shipments were little changed. Unfilled orders declined, and delivery times shortened. Inventories held steady. Labor market indicators pointed to a slight increase in both employment and the average workweek. The pace of input price increases was similar to last month, while selling price increases moderated. Looking ahead, firms remained relatively optimistic about the six-month outlook.
On the earnings front, earnings downgrades overtake upgrades.
Well, the San Francisco 49ers are playing the Cleveland Browns today with the Browns missing injured RB Nick Chubb and QB Deshaun Watson, replacing them with QB Dorian Thompson-Robinson (aka, Do Not Resuscitate or DNR) and RB Jerome “Exploding Pinto” Ford. ESPN gives the Browns a 26% chance of winning. I am amazed it is that high!
But back to economic news!
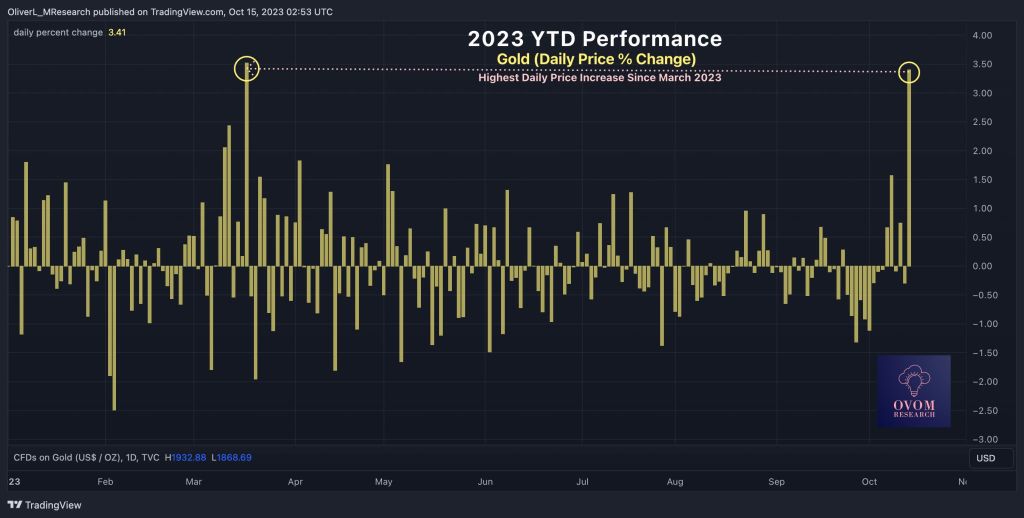
Gold is soaring due to the instability in the Middle East (Iran/Hamas/Hezbollah attacks on Israel). Let’s see if Israel continues it assault on Gaza or not.
Janet Yellen, Biden’s Treasury apparatchik, was at the IMF/World Bank meetings in Marrakesh (yes, former students are expecting me to like Crosby, Stills and Nash “Marrakesh Express” but I detest CS&N). Instead, here is Them with Here Comes The Night which is more fitting about risks in the global economy.
The heavy debt burdens of advanced economies — from the United States to China and Italy — was a recurrent theme in the meetings, which came after financial markets in recent weeks pushed U.S. bond yields higher. Italian central bank governor Ignazio Visco said there was an impression markets were “reevaluating the term premium” as investors become more nervous about holding longer-term debt.
JPMorgan chair of global research Joyce Chang put it another way. “The bond vigilantes are back, and the Great Moderation is over,” she told a panel of the two-decade era of relative economic calm before the 2008/09 financial crisis.
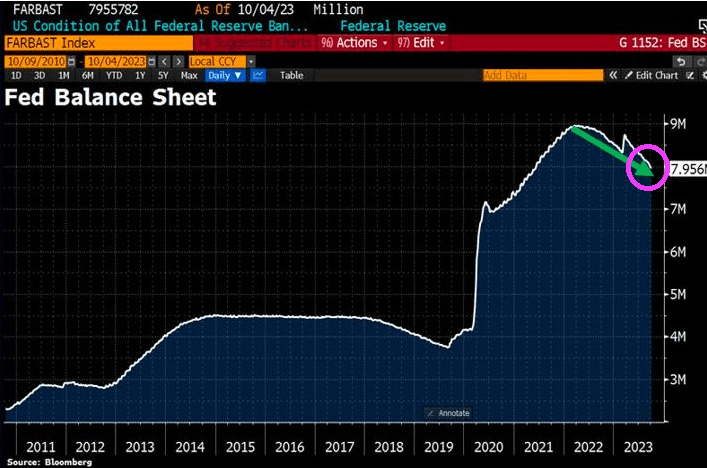
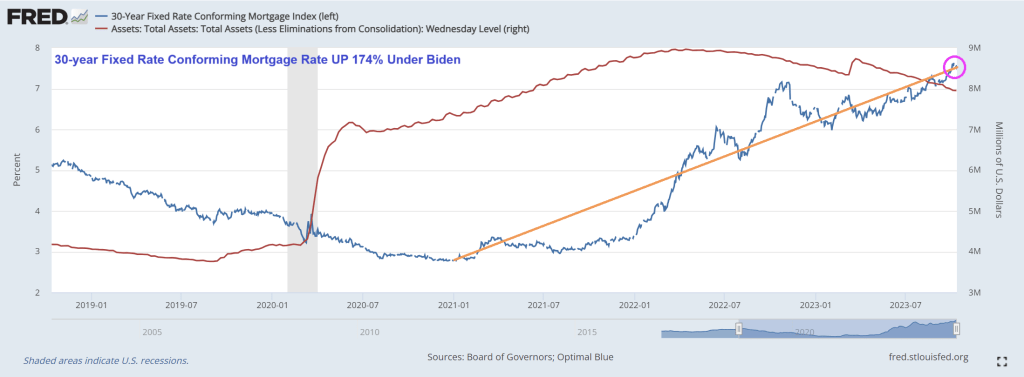
The Federal Reserve still hasn’t shrunk their massive balance sheet and removed the Covid stimulus. Call it lack of Fed retreat.
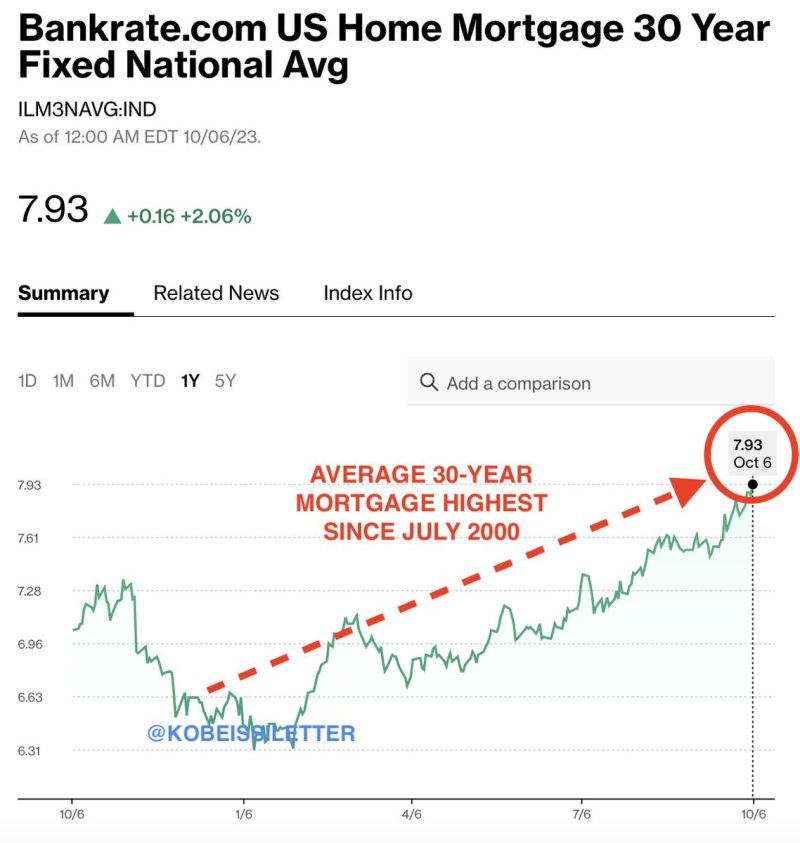
And mortgage rates continue to rise, up 174% under Stumblin’ Joe Biden despite The Fed not really shrinking their balance sheet.
I may be the only person in the US cheering for House Republicans being at an impasse over House Speaker. Why? Congress can’t approve massive spending bills with out a Speaker! Less spending, less inflation! There fixed inflation without The Fed.
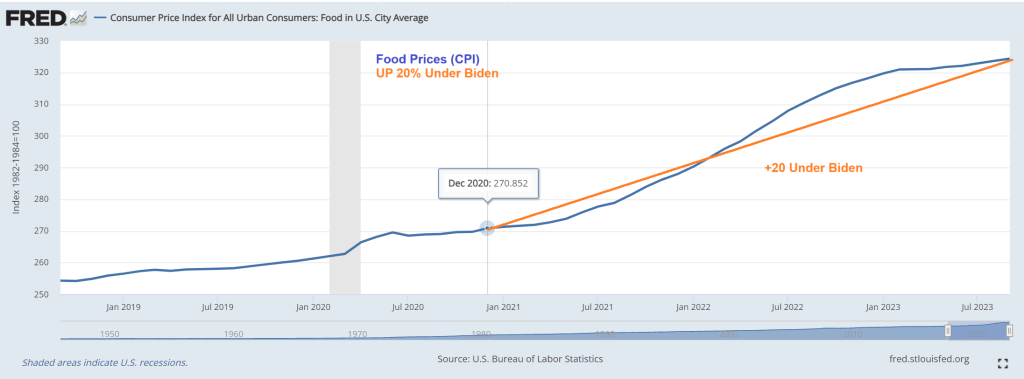
First, food prices are up 20% since December 2020. Talk about destruction of middle class wealth!
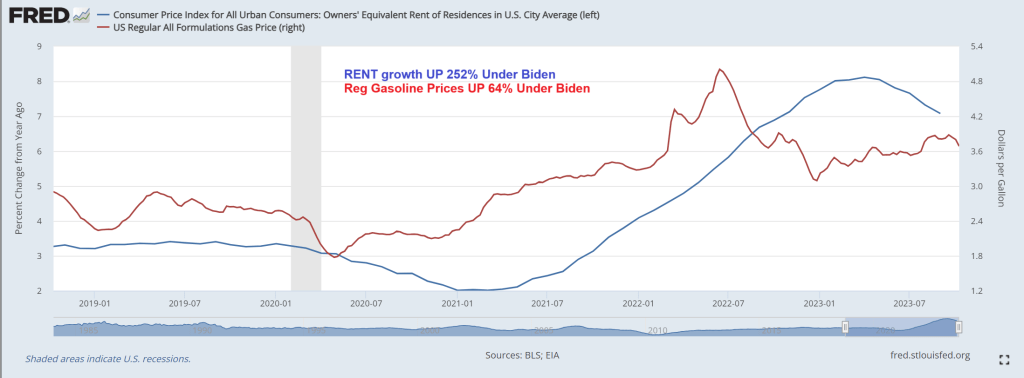
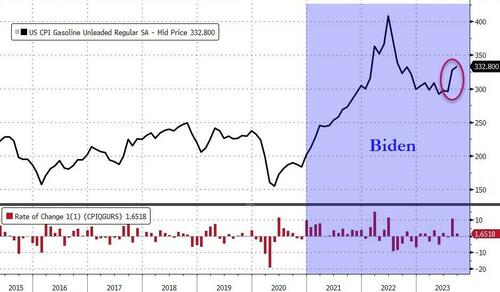
That is in addition to gasoline prices are up 64% under Biden while rent growth is up 252%. Well, Biden waived through millions of illegal immigrants and rent had to rise. Biden and Washington DC’s broken borders is Livin’ La Vida Loco.
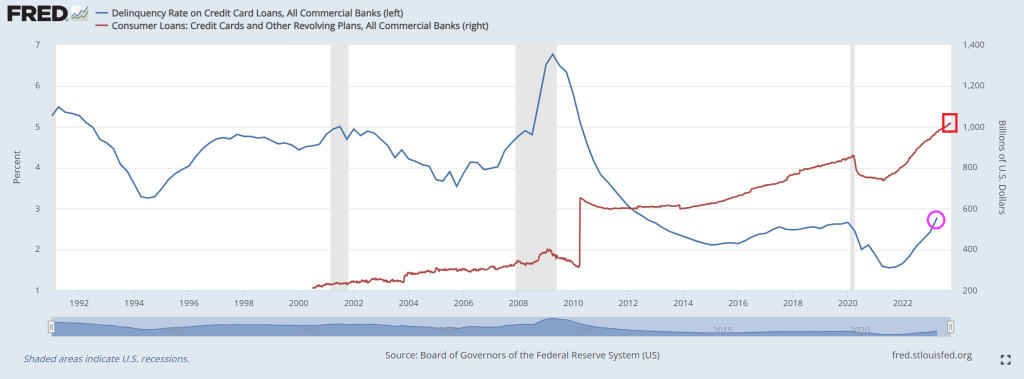
To cope with inflation (that Paul Krugman claims is over but the last inflation report showed that the tinders of inflation are hard to extinguish), consumers have turned to credit cards to survive. In fact, credit cards have expanded 38% since April 2021 despite rapidly rising interest rates. And credit card delinquency rates are rising and are now above Covid-era economic shutdown levels.
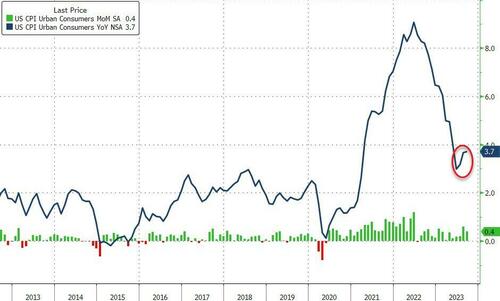
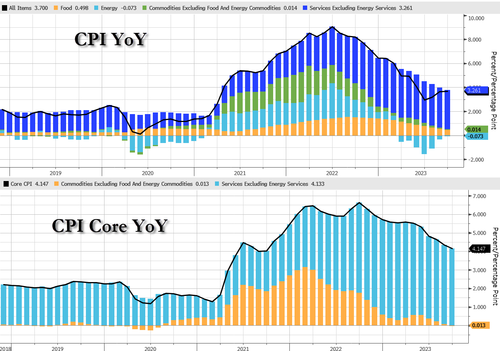
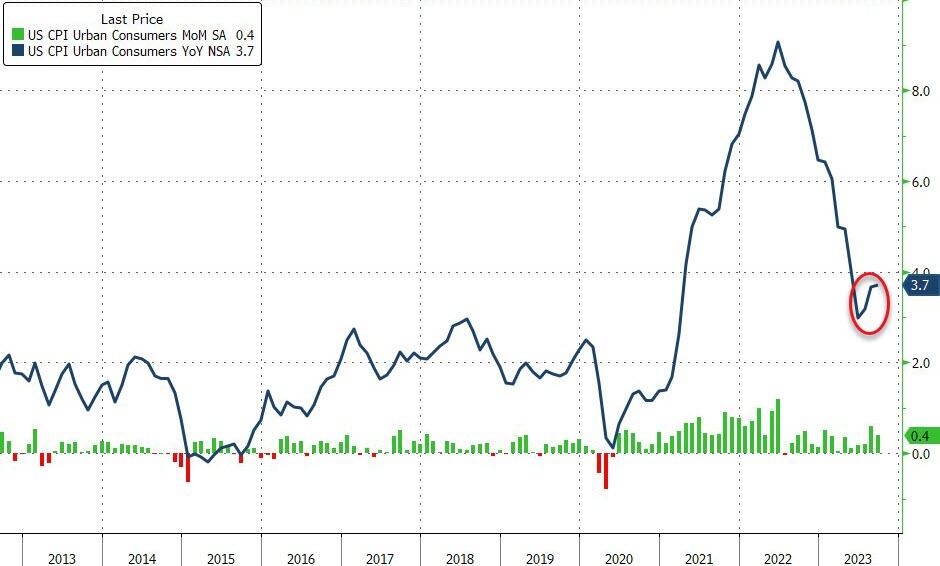
However, headline CPI came in modestly hot at +0.4%, with YoY at 3.7% – that is the 3rd monthly rebound in a row.
Source: Bloomberg
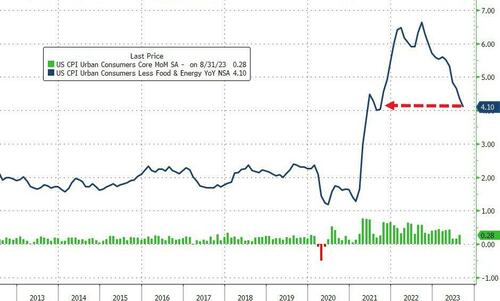
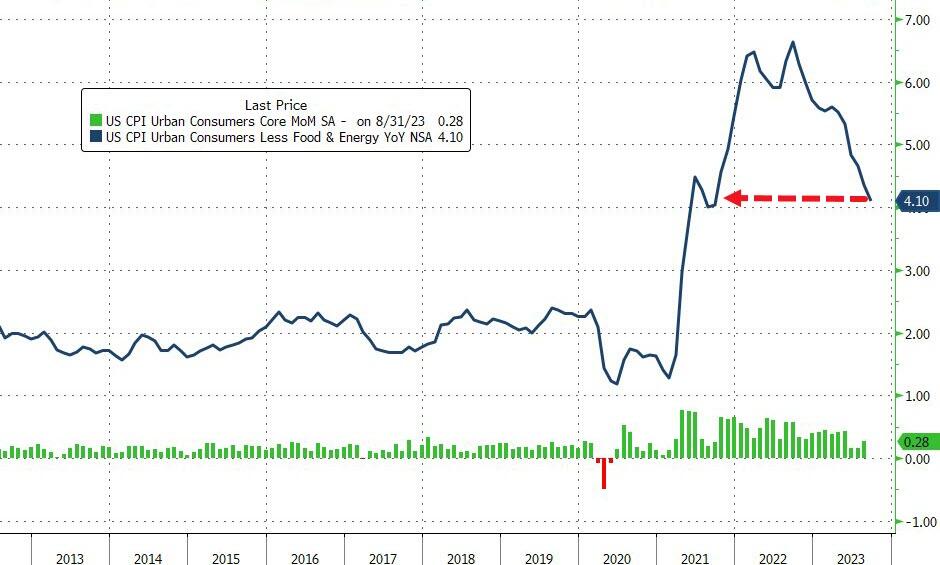
Core CPI rose 0.3% MoM, with YoY sliding to +4.1% YoY (as expected)… it still hasnt been below 4.00% since May 2021….
Source: Bloomberg
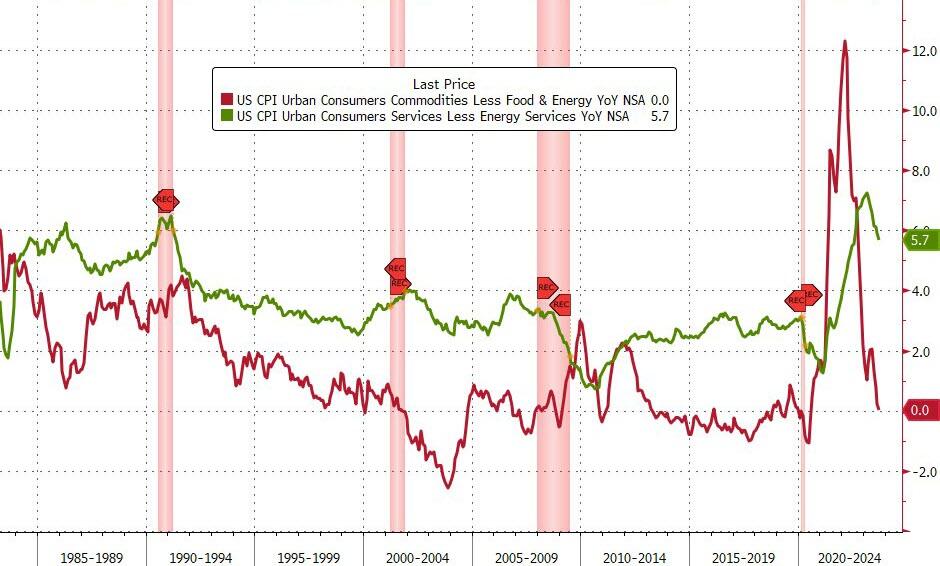
Food and Commodities contribution to YoY CPI slowed while Services increased…
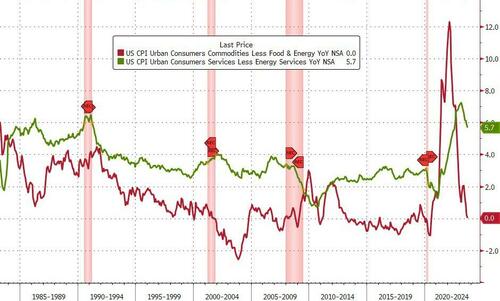
Goods inflation dipped back to unchanged YoY and Services CPI slowed to +5.7%…
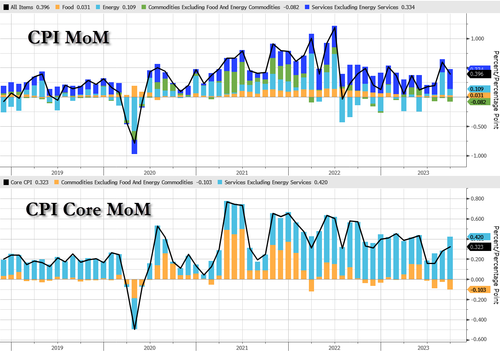
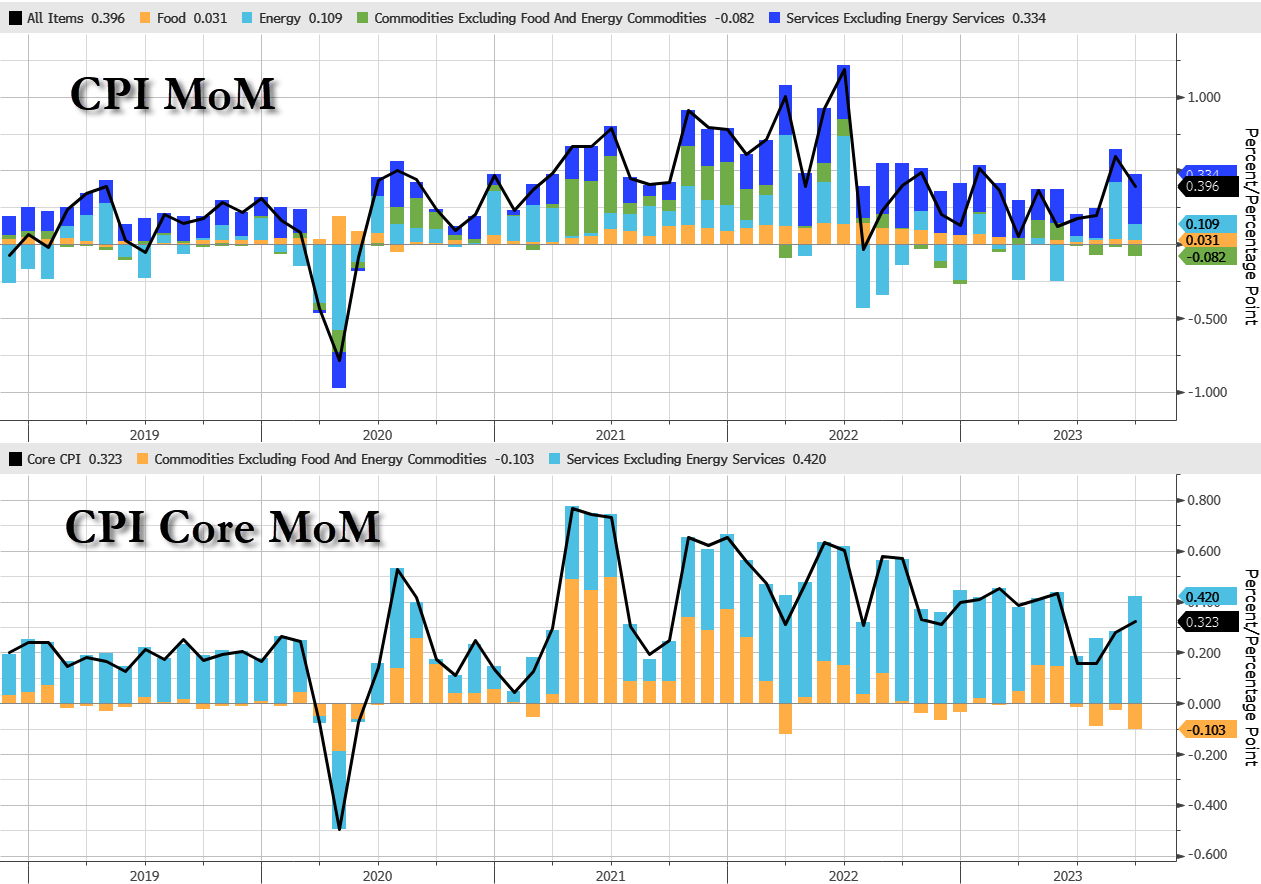
Services stands out on A MoM basis…
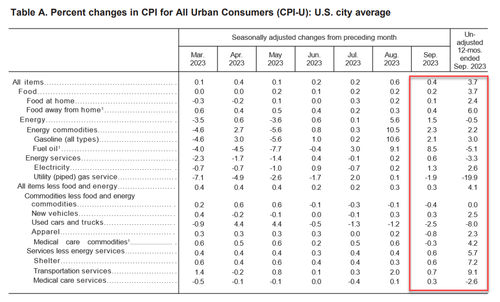
Under the hood, gasoline continues to rise and used car prices drop…
Rent of primary residence and owner’s equivalent rent YoY both exceeeded 7%. Fixing a car/truck rose 10.2% (will people start to notice that repairing EVs is outrageously expensive?).
The index for all items less food and energy rose 0.3 percent in September, as it did in August.
The shelter index was the largest factor in the monthly increase in the index for all items less food and energy.
The shelter index increased 0.6 percent in September, after rising 0.3 percent the previous month. The index for rent rose 0.5 percent in September, and the index for owners’ equivalent rent increased 0.6 percent over the month.
The lodging away from home index increased 3.7 percent in September, ending a string of 3 consecutive monthly decreases.
Among the other indexes that rose in September was the index for motor vehicle insurance, which increased 1.3 percent after rising 2.4 percent the preceding month.
The indexes for recreation, personal care, new vehicles, and household furnishings and operations also increased in September.
The medical care index rose 0.2 percent in September, as it did in August.
The index for hospital services increased 1.5 percent over the month, and the index for physicians’ services was unchanged.
The prescription drugs index fell 0.7 percent in September.
The index for used cars and trucks fell 2.5 percent in September, after decreasing 1.2 percent in August.
The apparel index declined 0.8 percent over the month, and the communication index was unchanged.
The index for all items less food and energy rose 4.1 percent over the past 12 months.
The shelter index increased 7.2 percent over the last year, accounting for over 70% of the total increase in all items less food and energy.
Other indexes with notable increases over the last year include motor vehicle insurance (+18.9 percent), recreation (+3.9 percent), personal care (+6.1 percent), and new vehicles (+2.5 percent).
Gasoline prices continue to rise…
Shelter costs are slowing, but accounted for the largest part of core CPI…
Rent inflation 7.41%, down from 7.76% in August and the lowest since Sept 2022
Shelter inflation 7.15%, down from 7.27% in August and the lowest since Nov 2022
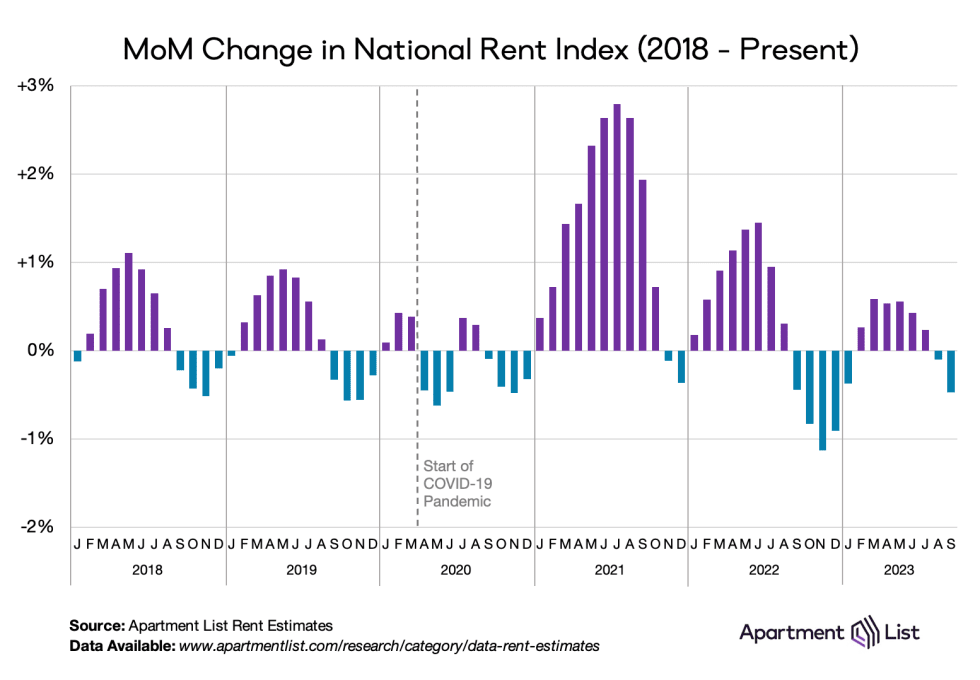
Bear in mind that while CPI very stale data is rising over 7%, real-time rent indicators are in freefall. Apt List’s Sept rent drop was the biggest on record…
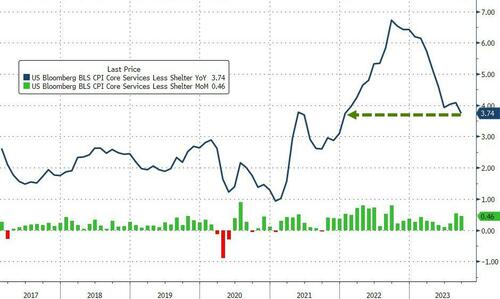
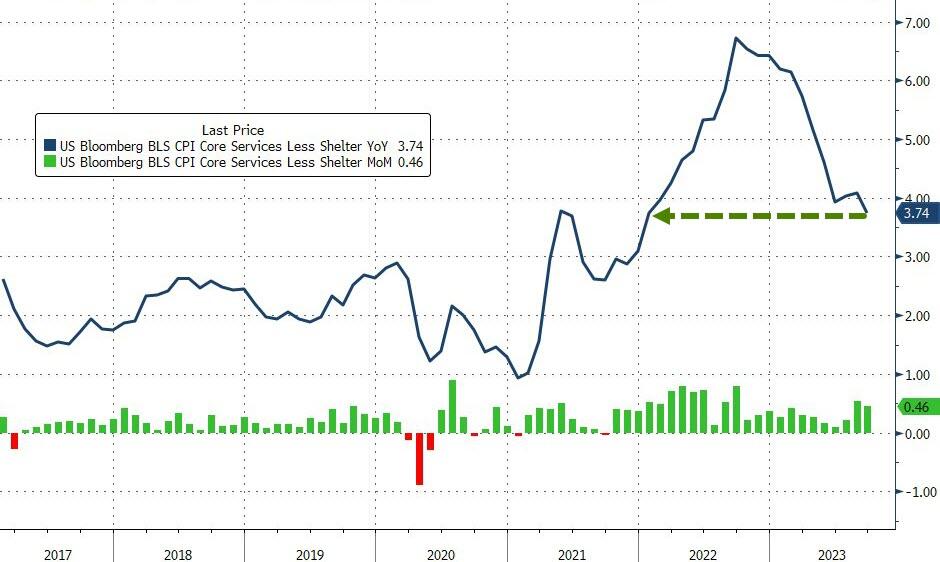
And perhaps most importantly, one silver lining is that The Fed’s new favorite inflation signal – Core Services CPI Ex-Shelter YoY slowed to +3.74% (despite jumping 0.46% MoM). That is the lowest YoY since Dec 2021…
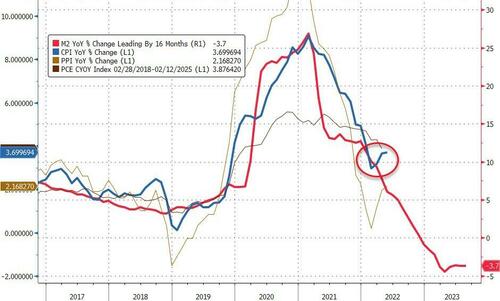
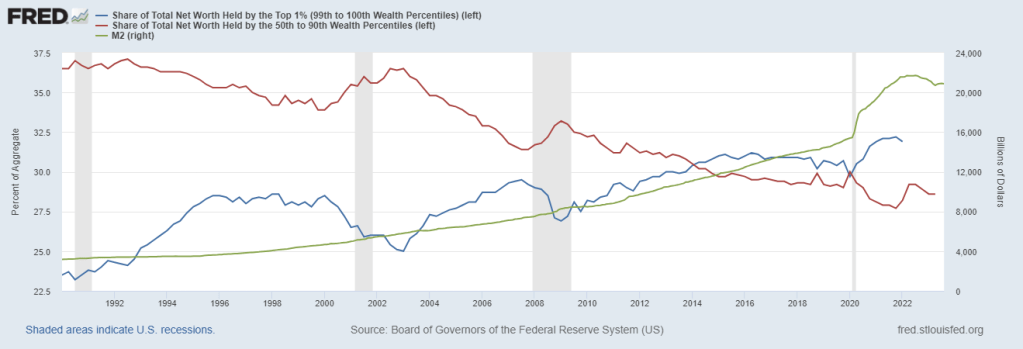
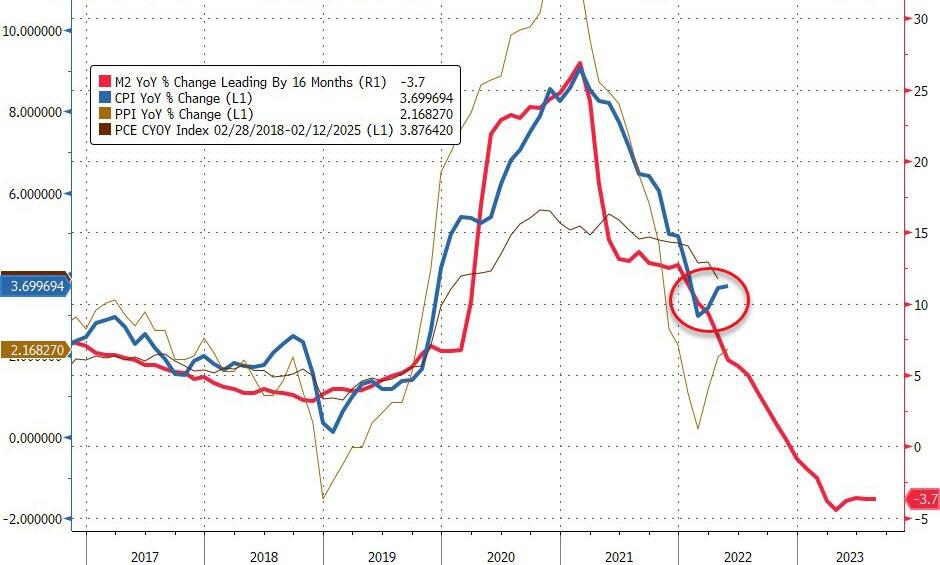
Is this third straight monthly increase in CPI YoY an inflection point? Or is M2 still leading the trend?
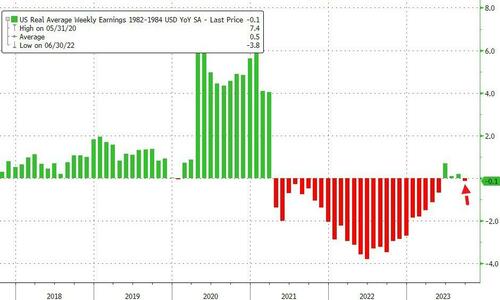
Turning from the cost of things to the ability to pay, “real” wages contracted 0.1% YoY (after 3 months positive)…
This is not the soft-landing cruise lower in inflation that the market (and The Fed) was hoping for…
Former Fed Chair Janet Yellen, notorious for leaving rates too low for too long (TLTL) and then suddely raising them after Donald Trump was elected President, wants rates lower again for much longer. Make rates great again (MRGA?).
YELLEN SAYS DEBT SERVICE COSTS WILL BE 1% OF GDP FOR THE NEXT DECADE. – Reuters
Her statement implies that the economy will be strong and the government will run budget surpluses, or interest rates will be near zero for the next ten years.
Instead of guessing what she is pondering, we do some math and arrive at the only possible answer.
The Government Can’t Afford Today’s Interest Rates
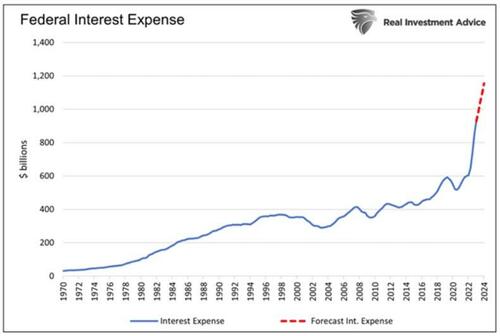
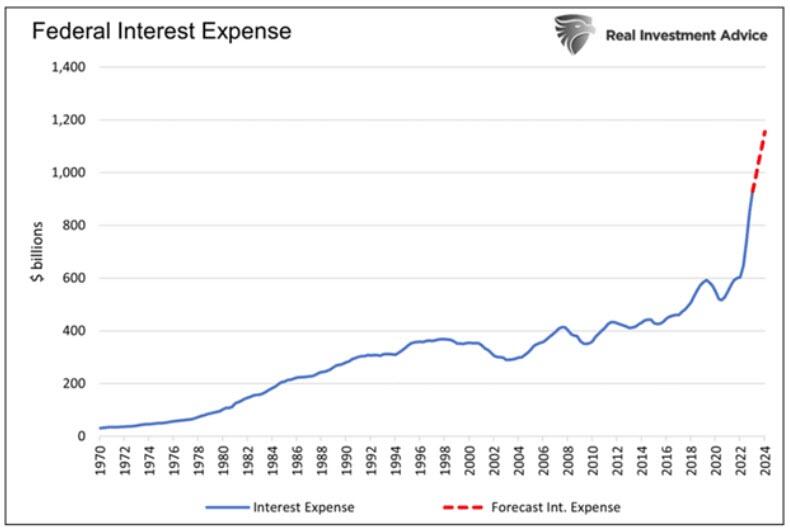
Before walking through various scenarios to figure out what Yellen may be implying, it’s helpful to provide background on what drives her mindset. In our article The Government Can’t Afford Higher For Longer, Much Longer, we shared the following graph and commentary:
Total federal interest expenses should rise by approximately $226 billion over the next twelve months to over $1.15 trillion. For context, from the second quarter of 2010 to the end of 2021, when interest rates were near zero, the interest expense rose by $240 billion in aggregate. More stunningly, the interest expense has increased more in the last three years than in the fifty years prior.
The graph above is just the tip of the fiscal iceberg. Every month, lower-interest-rate debt matures and will be replaced with higher-cost debt.
Higher interest rates are an additional funding burden for the federal government. Janet Yellen surely understands the damaging situation and grasps that higher interest rates are not feasible given current debt levels.
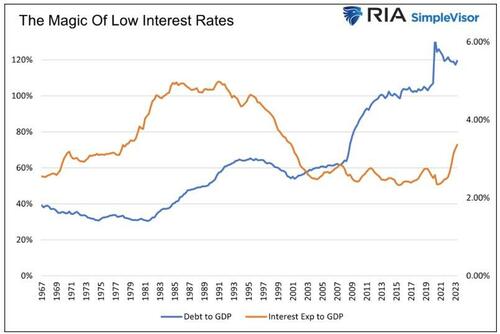
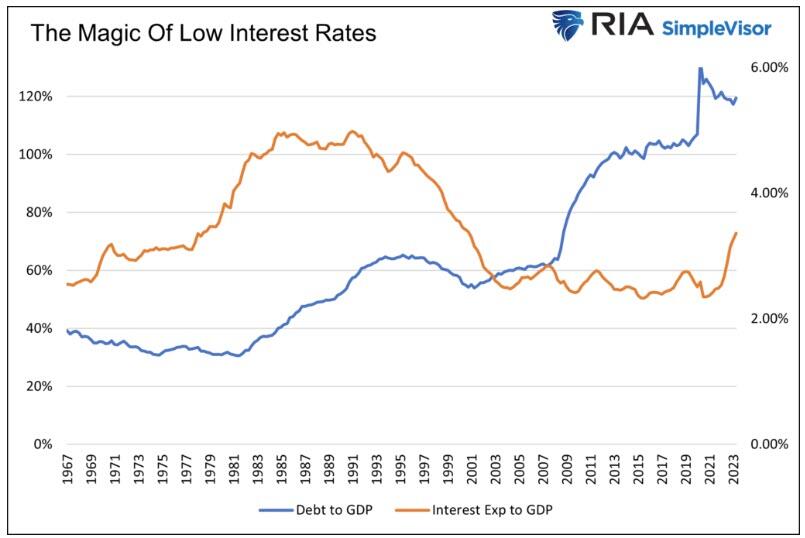
Low-Interest Rates Make Debt Manageable
The government’s debt-to-GDP ratio has climbed three-fold since 1966. Yet, until very recently, the ratio of the federal interest expense to GDP was at its lowest level since 1966.
While the amount of debt rose sharply, its cost was offset by rapidly falling interest rates. As a result, higher debt levels were very manageable.
If $1 trillion of debt with a 4% coupon matures, and the Treasury replaces it with $2 trillion at a 2% coupon, the interest expense doesn’t change despite doubling the debt. While a simplified example, that is essentially what has occurred for the last 30 years.
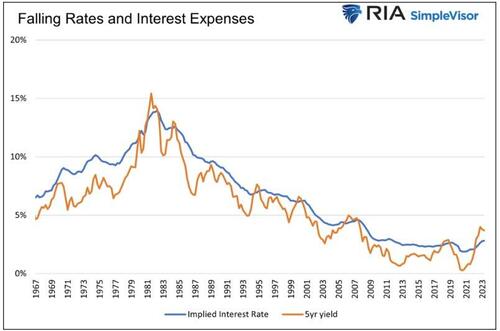
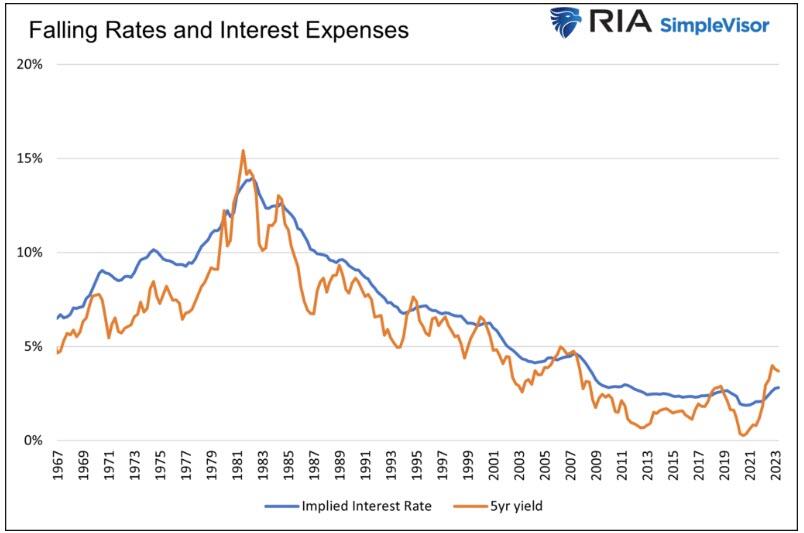
The following graph compares the 5-year U.S. Treasury note and the implied cost of funding the government’s debt.
In time, as lower interest rate debt is replaced with higher interest rate debt, the benefits of lower rates work in reverse.
“Debt Service Costs At 1%” – Is It Possible?
We return to Janet Yellen’s message and discuss why she is likely correct.
Balanced Budgets and Unicorns
In the five years leading up to the pandemic, nominal GDP grew at 5.03% annually. Let’s optimistically assume growth continues at 5% consistently for the next ten years. Now, let’s tack on an even bolder presumption: the government balances its budget every year for the next ten years. Thus, the amount of outstanding debt will remain constant. For context, in the last 57 years, there has only been one year in which the amount of debt has not increased.
In such a far-fetched scenario, the debt-to-GDP ratio would drop considerably to 70%. However, interest costs would equal 2% of GDP. Such is much better than the current 3.36% but double Janet Yellen’s 1% objective.
Budget surpluses for the next ten years would lower interest expenses even more and possibly get the interest expense to GDP ratio to 1%. However, the odds of a unicorn spraying rainbows across the sky and the government running a surplus are the same: zero percent.
Consequently, we exclude surpluses as a viable way to reduce the interest expense to a more manageable level.
Budget Deficits And The Magic Of Low-Interest Rates
Balanced budgets or surpluses are unrealistic, given the political and fiscal trends. Further, the economy relies heavily on government spending. While fiscal prudence would be good in the long run, the short-run effect would be a recession.
Instead of using pipe dreams as scenarios, let’s get realistic. The more likely, albeit still optimistic, scenario involves the debt and GDP growing at the same rate. Let’s also assume interest rates remain at current levels. In this exercise, we assume an average borrowing cost of 4.75%, which is a little below the current weighted average funding cost for the government. Under this “realistic” picture, interest expense would climb to 5.6% of GDP.
The only logical variable in the equation that can make Janet Yellen correct is the future interest rate.
To arrive at Yellen’s 1% figure, assuming debt grows at the rate of GDP, interest rates must be much lower.
In time, a weighted average interest rate of 0.85% would put the nation’s interest expense at 1% of GDP.
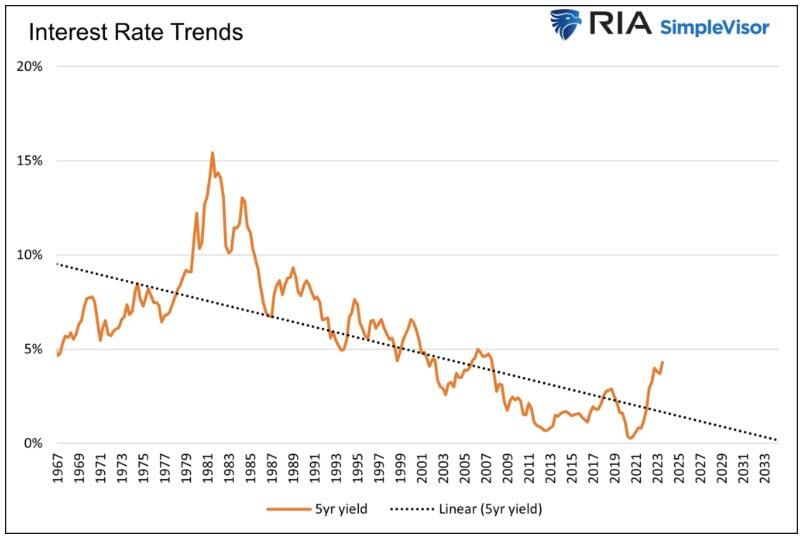
When Janet Yellen tells us the debt cost to GDP ratio will be 1% over the next ten years, she is really saying interest rates will be below 1% for the next ten years.
Therefore, Janet Yellen must believe that the recent spike in inflation and yields is an anomaly. If the pre-pandemic economic and interest rate trends resume, she will be correct.
Summary
Part of Janet Yellen’s job is to exude confidence to its investors. In this case, it means telling the public that the current jump in interest expenses will not last. While she would probably prefer to be straightforward and say interest rates will be much lower, she must also be sympathetic to the Fed’s job of getting inflation down. Therefore, to walk the party line, she must speak in code, so to speak.
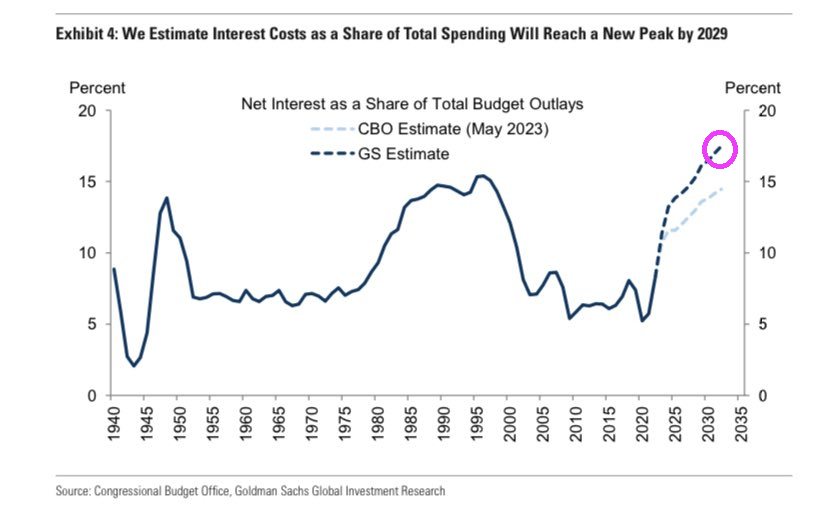
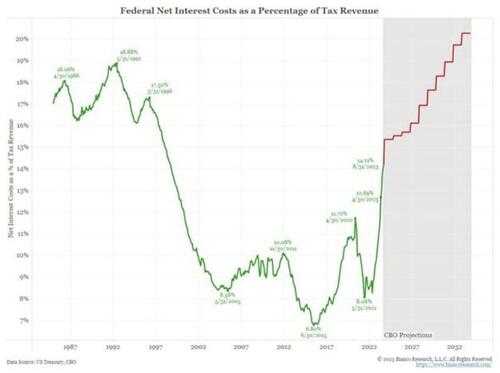
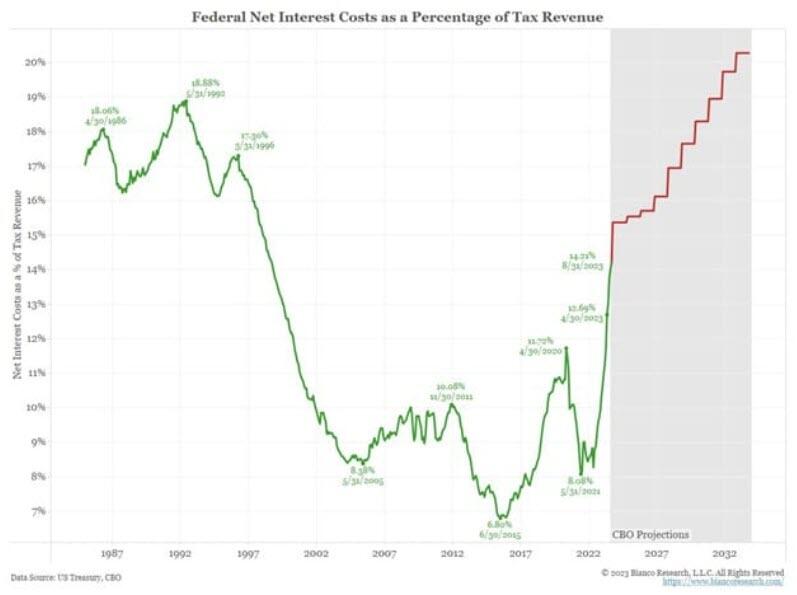
Whether you agree with Yellen’s projection or not, the following CBO graph projecting interest costs as a percentage of tax revenues, courtesy of Bianco Research, highlights that the government has no choice but lower for longer interest rates. The current level of interest rates will bankrupt the nation.
This makes sense. Two global elitists who look down with disdain and want to reprogram MAGA voters. Can we reprogram the MRGA types into letting rates float to market.
Like President Biden enjoying a barbeque at The White House with a live band (probably NOT Justin Moore singing “Small Town USA”) while Hamas declared war on Israel and Americans are being held hostage with the promise of public executions of hostages livestreamed. Nothing that “Empathy Joe” does ever surprises me anymore, but I am surprise that various Federal Reserve Presidents will speak today while Hamas terrorizes Israeli and US citizens.
It could be that investors think that Talking Heads at The Fed will claim that Fed rate increases are over. Then again, the Iran/Hamas terror campaign against Israel is spookking markets, driving up oil and gold prices and driving up “flight to safety” in US Treasuries.
President Biden called on Americans in Israel to book a commercial flight home, even though Israel has cancelled all flights. Does Old Joe even read the news??
“Two-job Joe” should be Biden’s new nickname for his economy wrecking ball known as Bidenomics.
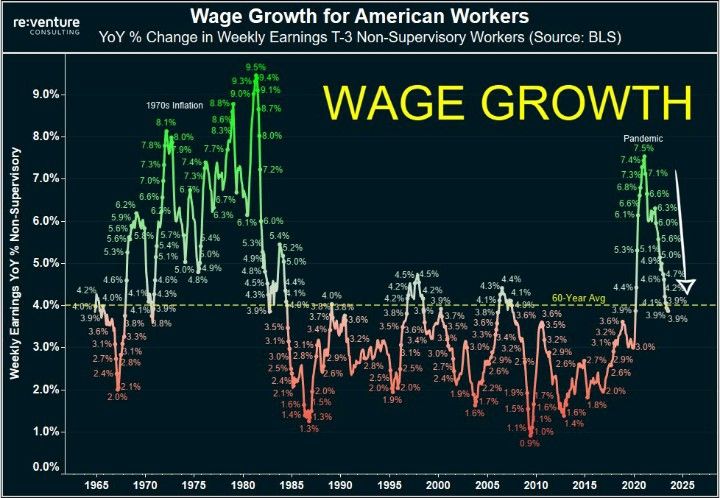
The economic disaster known as Bidenomics (code for wealth transfers to the donor class) can be seen in the following chart. Non-elite households are struggling to cope with higher gasoline, food and house prices (rent) under Bidenomics.
As a result, the number of people holding 2 FULL-TIME JOBS hit an all-time high of 447,000 people. Biden spokesperson Karine Jean Pierre is likely to say “See? Bidenomics is working! Not every person is holding 2 full-time jobs to afford that Ford all-electric Lightning F-150 pickup truck!”
At the same time, wage growth YoY is crashing from Covid stimulus highs to pre-Covid levels.
It is getting harder and harder for non-elites to buy that Ford F1-150 all-electric Lightning Platinum for $94,000 plus tax. And you still have to pay $500 for the Ford Mobile Power Cord. OMG! For $94k, they couldn’t throw in the power cord?????
Does F stand for Failed? The honorary vehicle for Bidenomics!!
Joe Biden, who has always been a compulsive liar but at least sounded cognicent, is now babbling and whispering that Bidenomics works. But for who?
Clearly not for first time homebuyers or people looking to move. Bankrate’s 30-year mortgage rate is up to almost 8%, the highest since July 2000 and Willy Slick Clinton. That is a 176% increase in mortgage rates under the most inept “Economic Sheriff” in history.
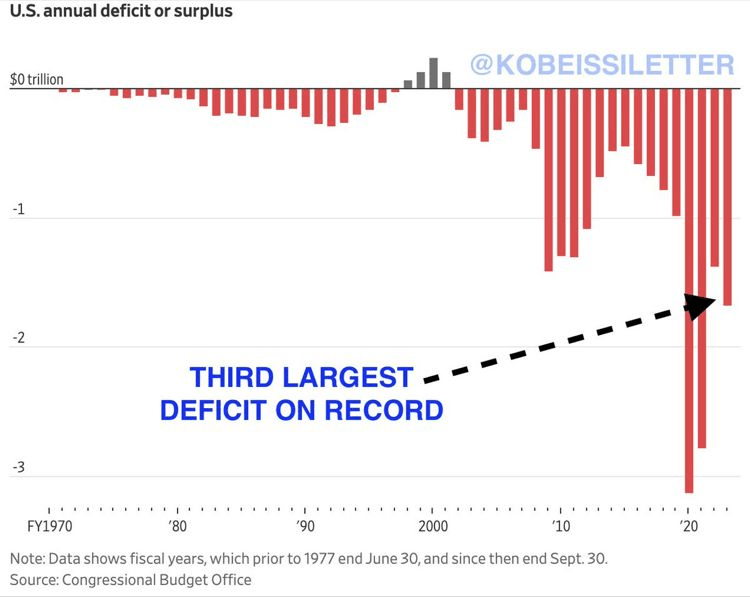
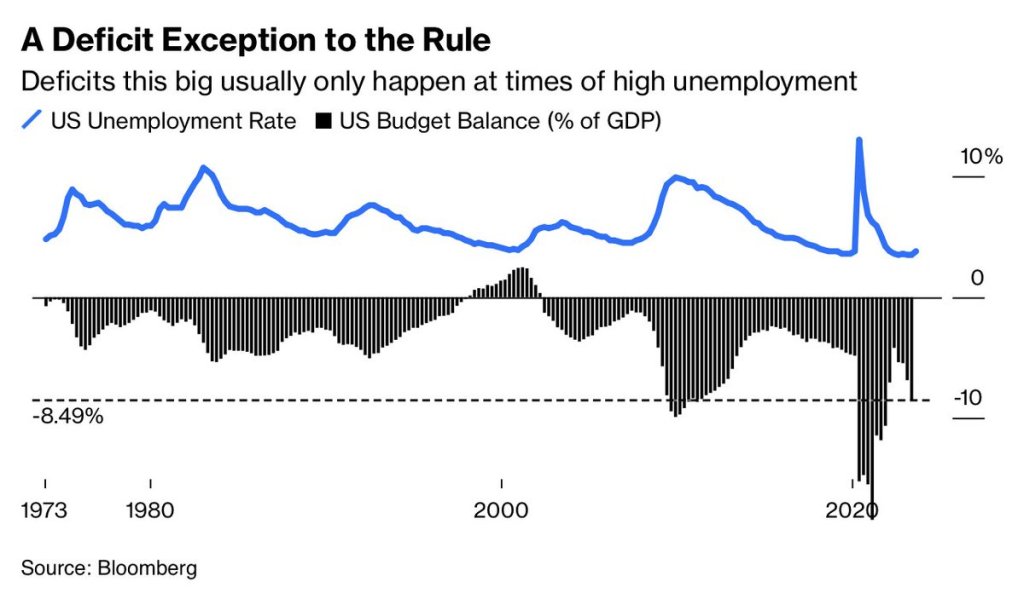
Deficits? Deficits (which Biden makes outlandish claims) are usually only this big at times of HIGH unemployment and recessions. So, are the staggering deficits under Biden a precursor to a hard landing (recession)? Don’t listen to what Biden or KJP say!!!
Biden’s outlandish claims that he single handedly reduced the deficit by the most in history is, well, typical Biden bloviating. Actually, tax receipts soared after Covid lockdowns ended. Period. Now that stimulus is wearing out, deficits are climbing again.
As Biden sleeps through the Hamas invasion of Israel, that is nothing new. Biden is sleeping through a disastrous downturn in the economy and pretending that Bidenomics is working. It isn’t Joe!
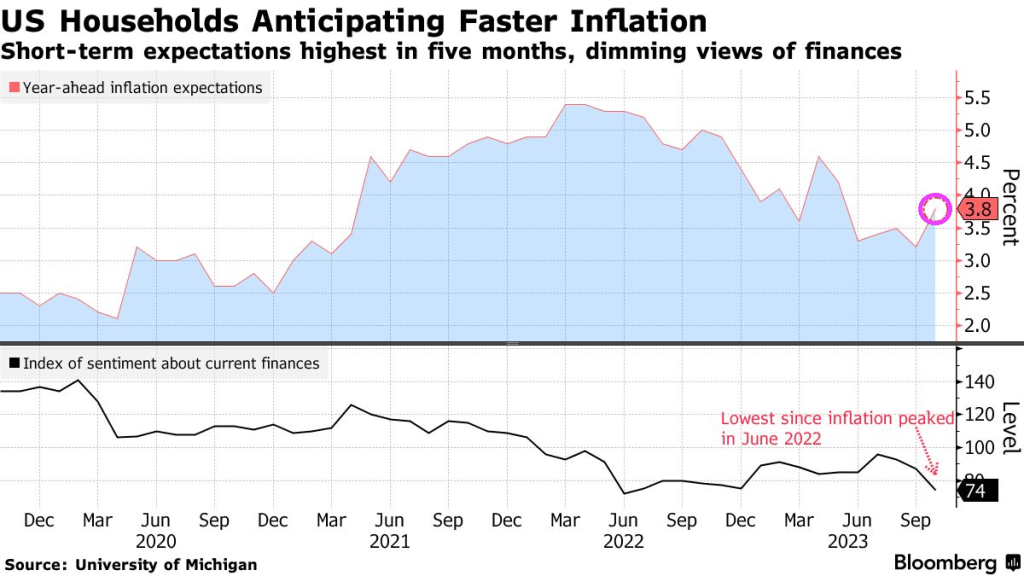
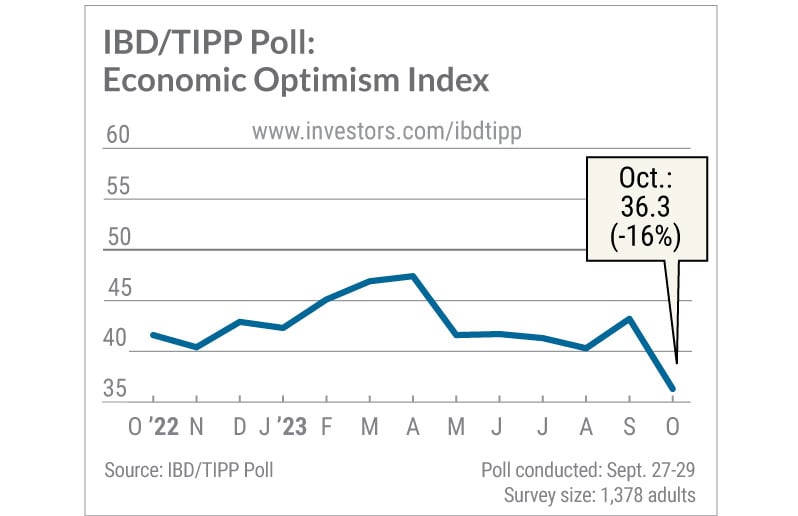
The IBD/TIPP U.S. Economic Optimism Index sank to a 12-year low in October as confidence in the near-term economic outlook crashed to the lowest level in the poll’s history. The survey casts doubt on the Federal Reserve’s justification for turning more hawkish last month: robust consumer spending.
The overall IBD/TIPP U.S. Economic Optimism Index dived 6.9 points to 36.3, the lowest since August 2011. Readings below the neutral 50 level reflect pessimism. The 6-month economic outlook index cratered 9.6 points to 28.7, a record low since the IBD/TIPP Poll began in early 2001.
That means the outlook suddenly appears worse than it was at the depths of the dot-com crash, the great financial crisis and the coronavirus pandemic.
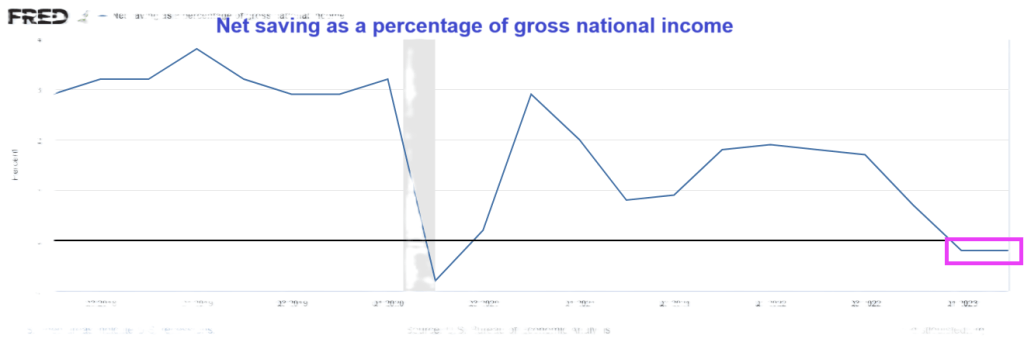
And on the personal savings front, net savings as a percentage of gross national income was negative for the second straight quarter.
Sleepy Joe, wake up! The US economy is slowing down REALLY fast!


You must be logged in to post a comment.