
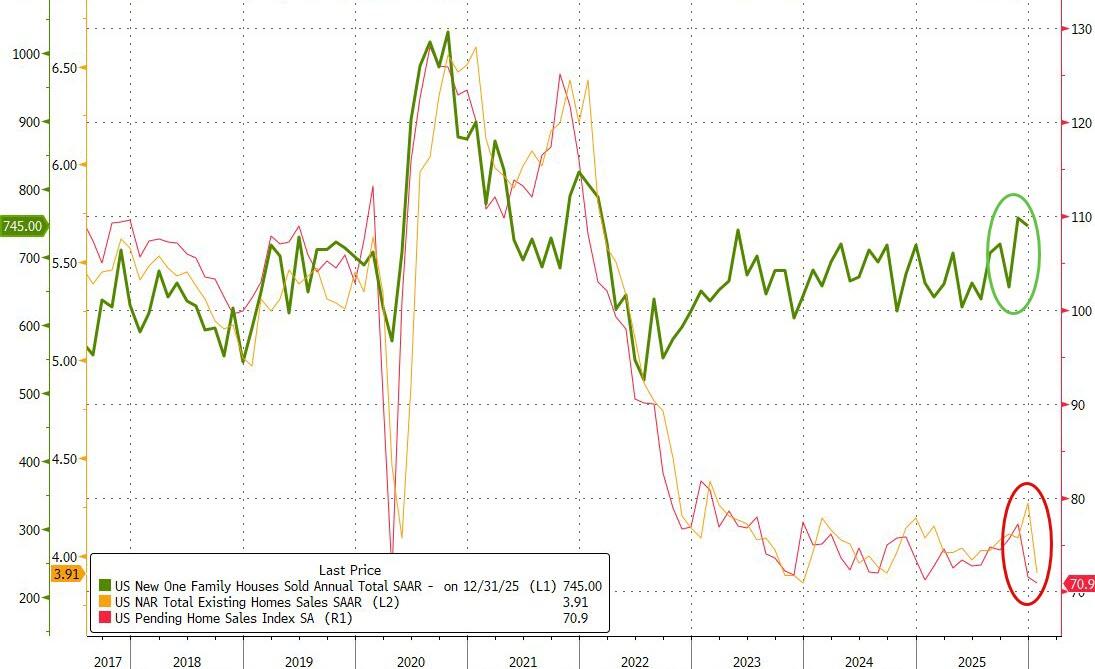
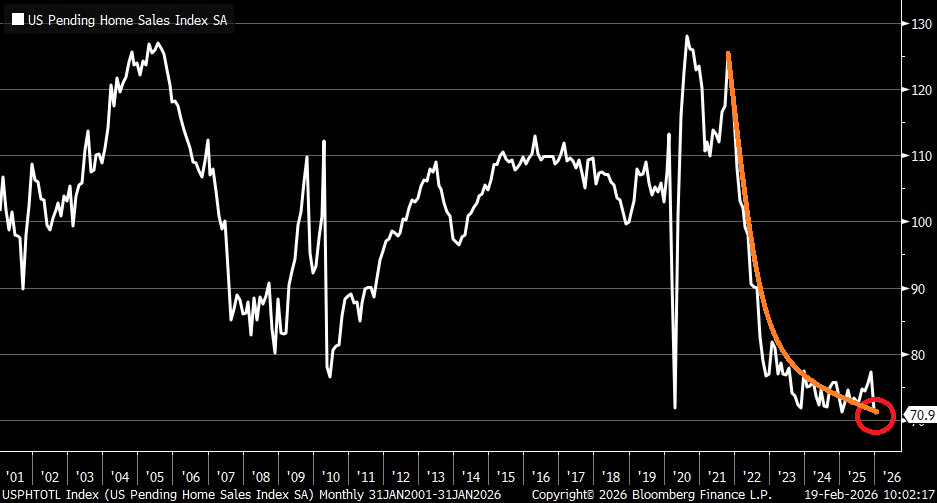
Existing home sales actually surprised to the upside, rising 1.7% MoM in February. Perhaps even more notably, January’s 8.4% MoM plunge was revised up to a slightly less crazy 5.9% MoM drop.
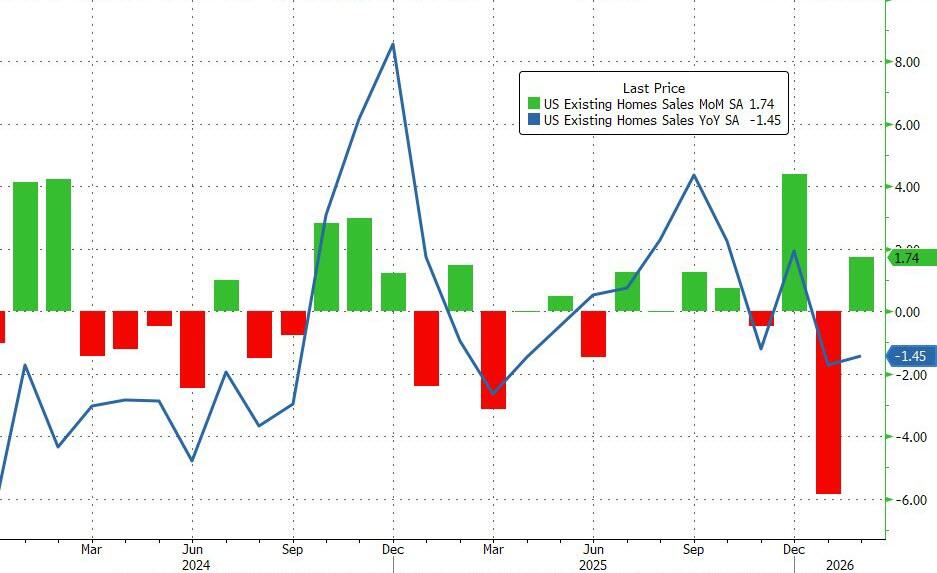
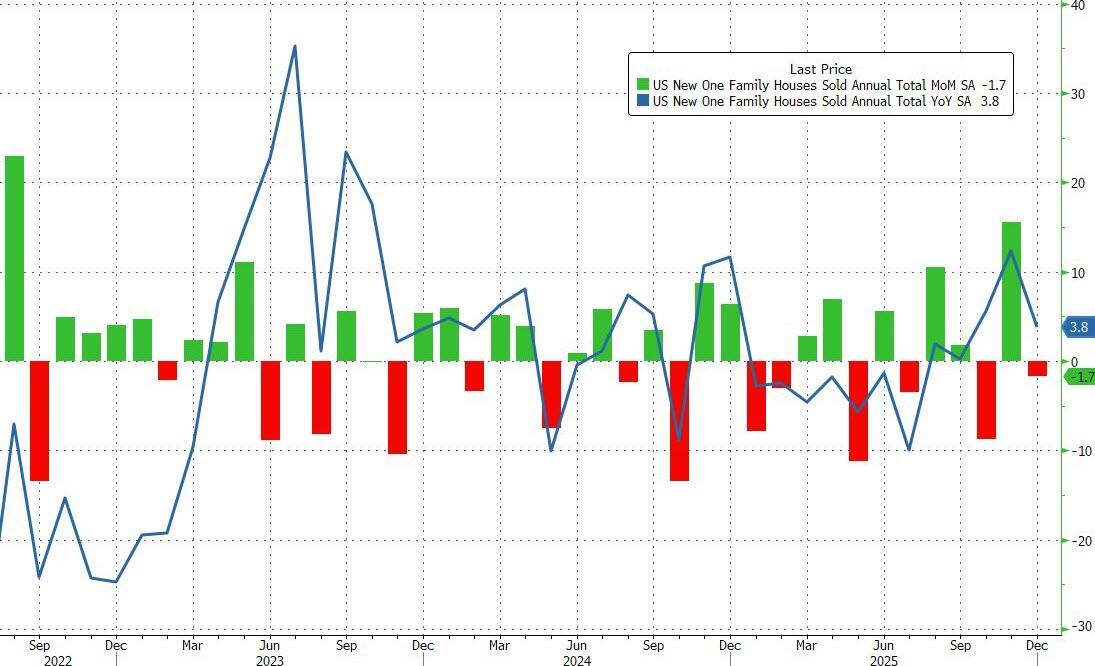
With the beat and upward revision, existing home sales were down just 1.45% YoY but SAAR topped 4mm (4.09mm) once again.
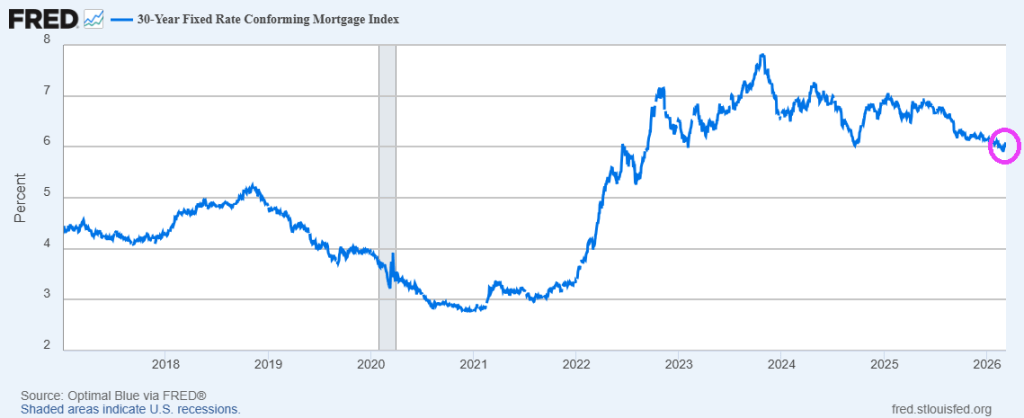
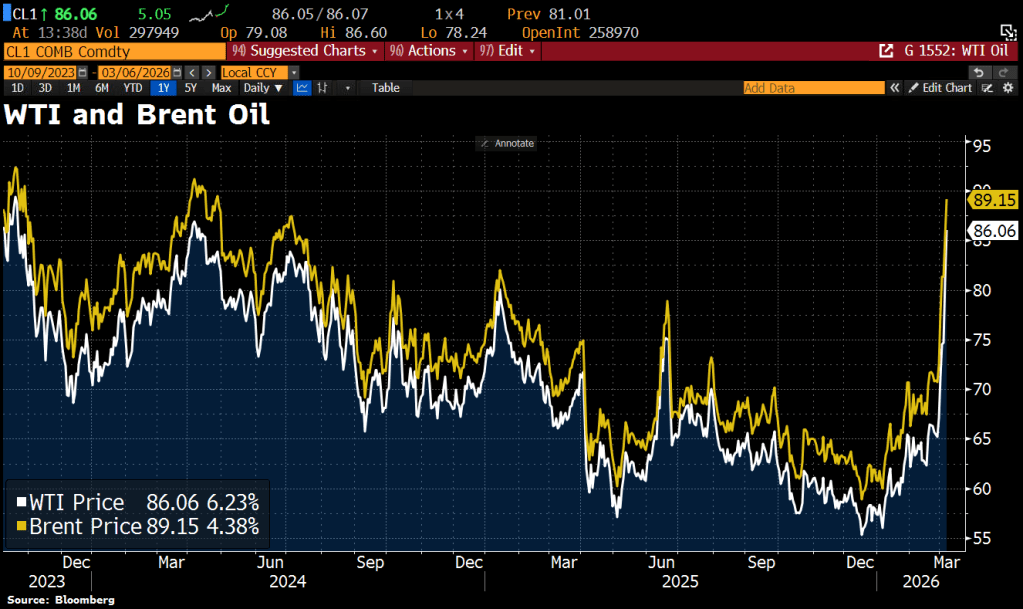
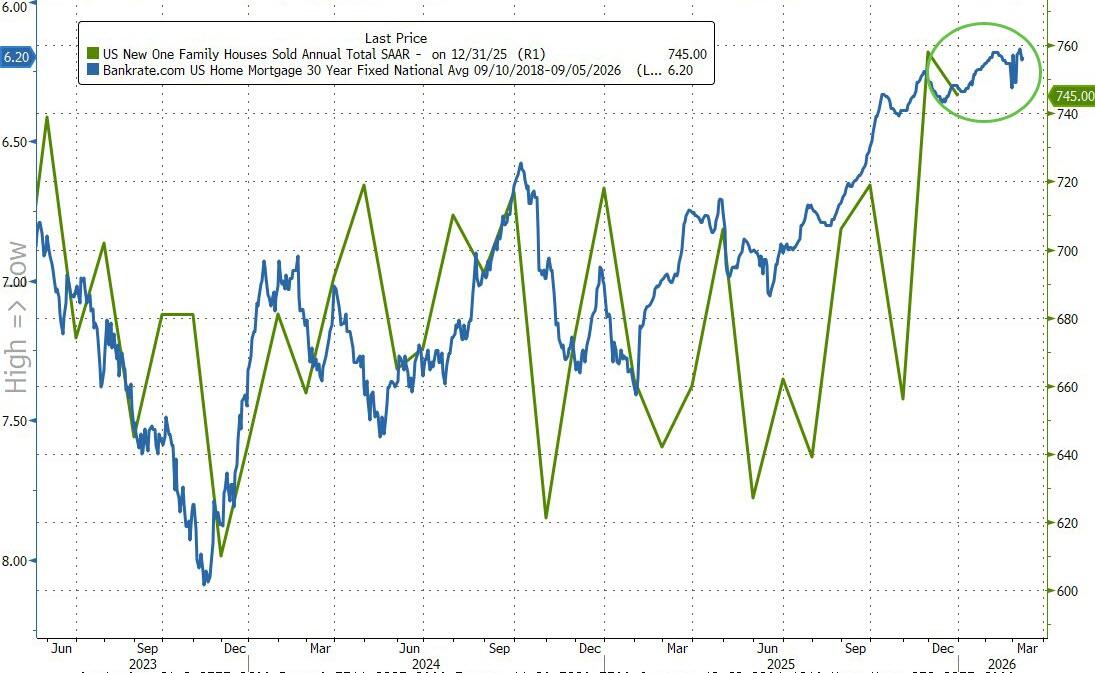
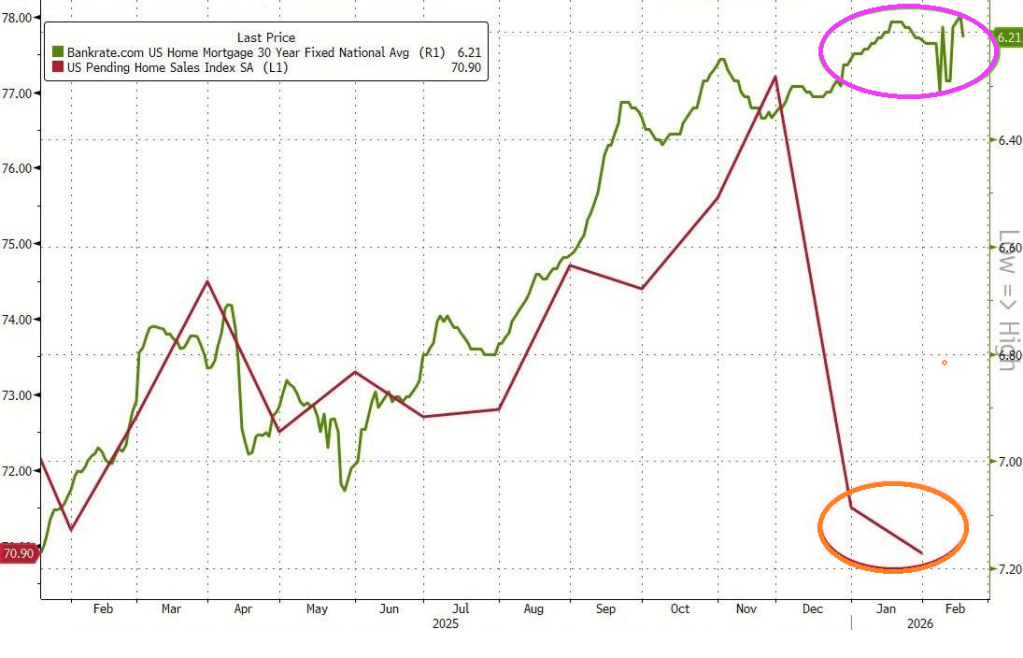
On the bright side, with mortgage rates at their lowest since 2022, existing home sales look set to continue to improve (unless Trump’s war triggers more panic in rates).
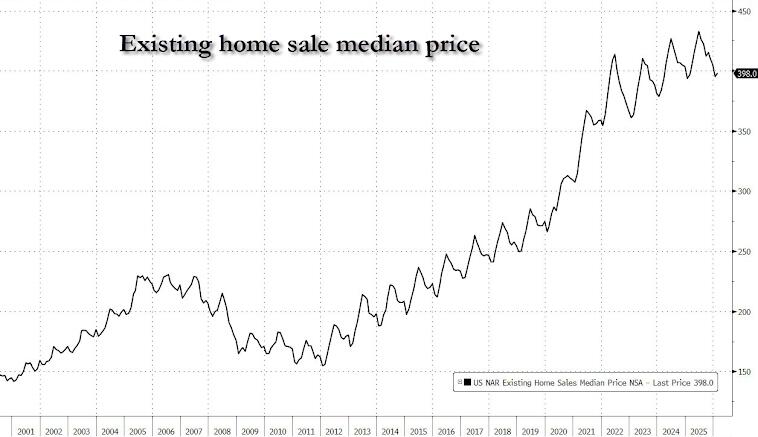
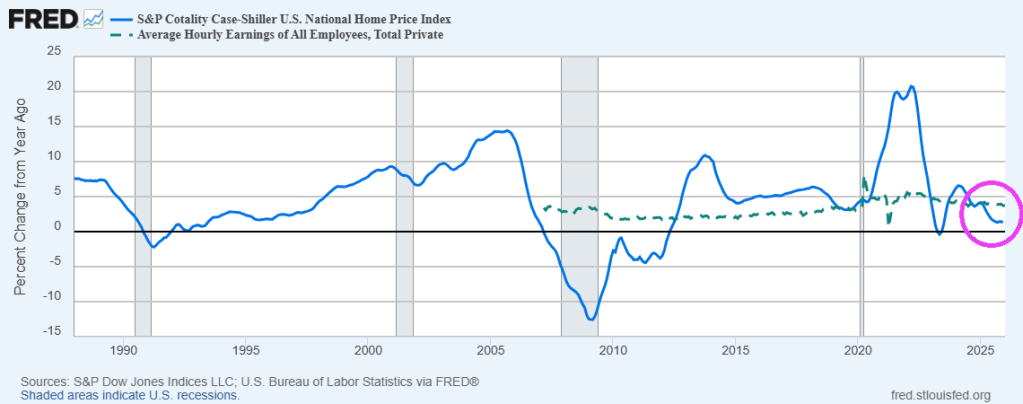
The NAR report showed the median selling price rose 0.3% from a year earlier — one of the smallest advances since the pandemic housing frenzy — to $398,000 last month.
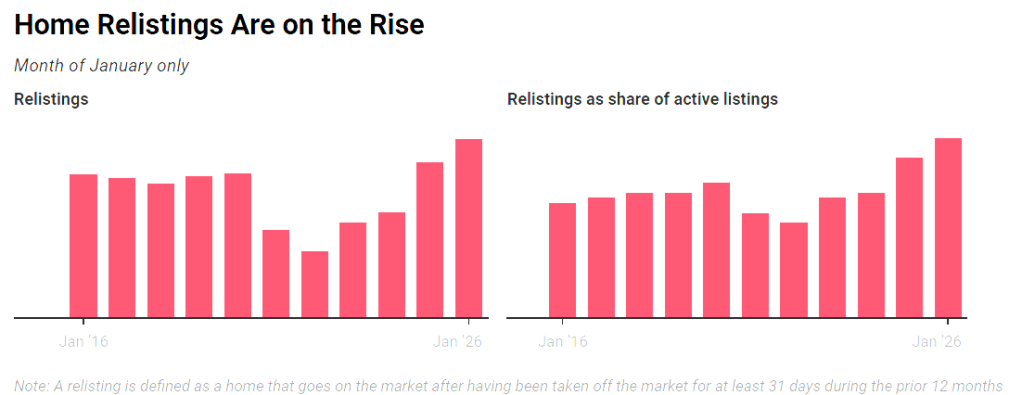
The inventory of previously owned homes increased 4.9% from a year ago to 1.29 million — the most for any February since 2020.

Mortgage rates? Up yesterday, but near lowest since 2023.


You must be logged in to post a comment.