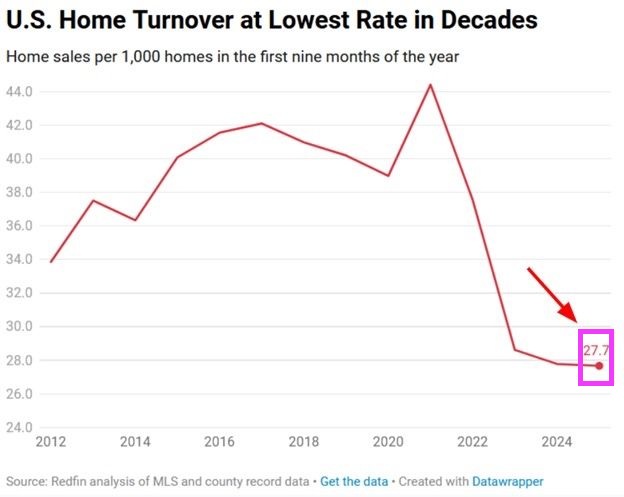
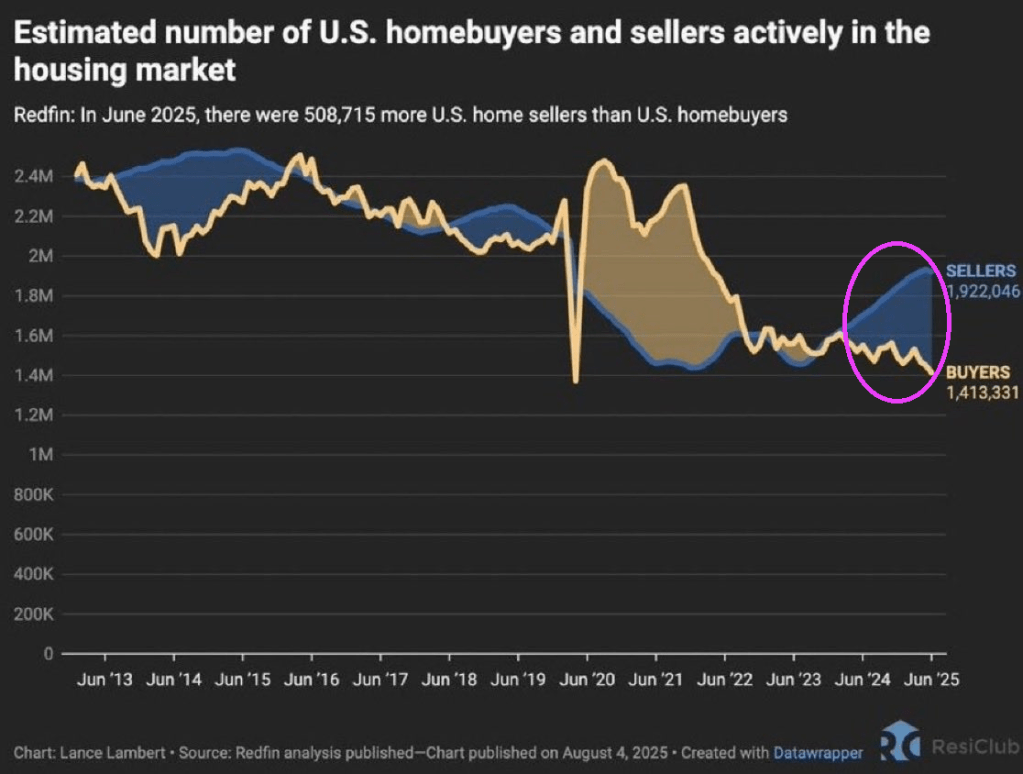
Redfin’s Housing Turnover Report, Q1–Q3 2025
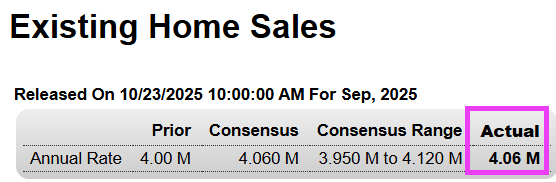
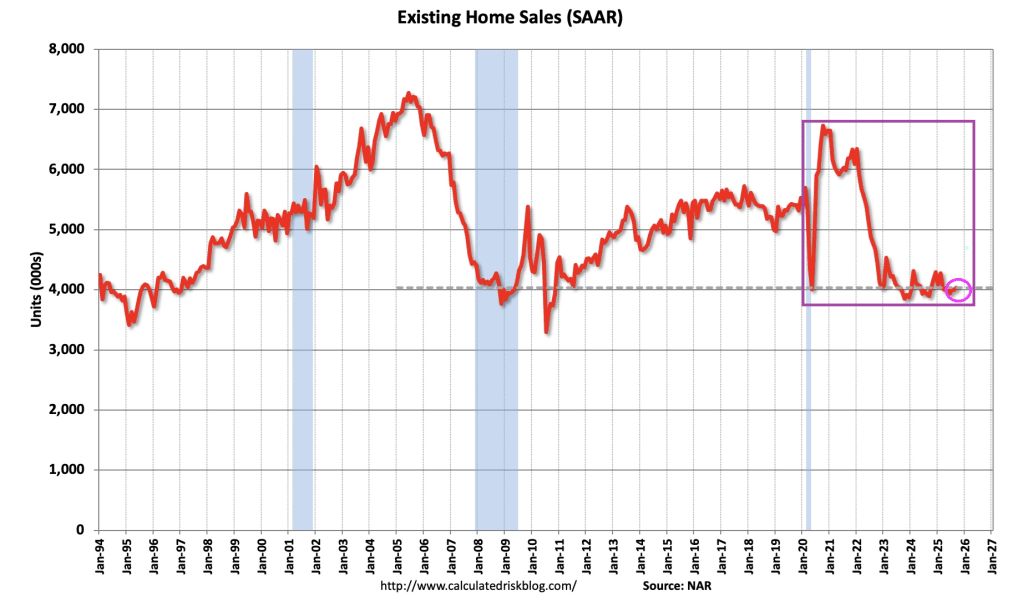
Just 2.8 homes out of every 1,000 changed owners in the first nine months of 2025—the lowest turnover rate in at least three decades. This marks a 38% plunge from the 2021 frenzy, when 44 per 1,000 homes sold, and is 44% below the pre-pandemic 2019 pace of 40 per 1,000.
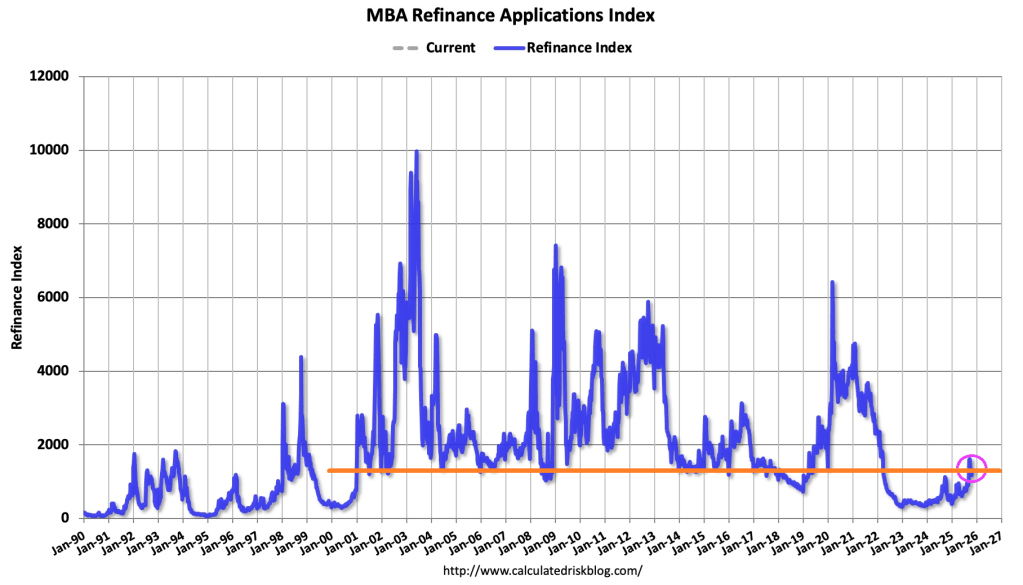
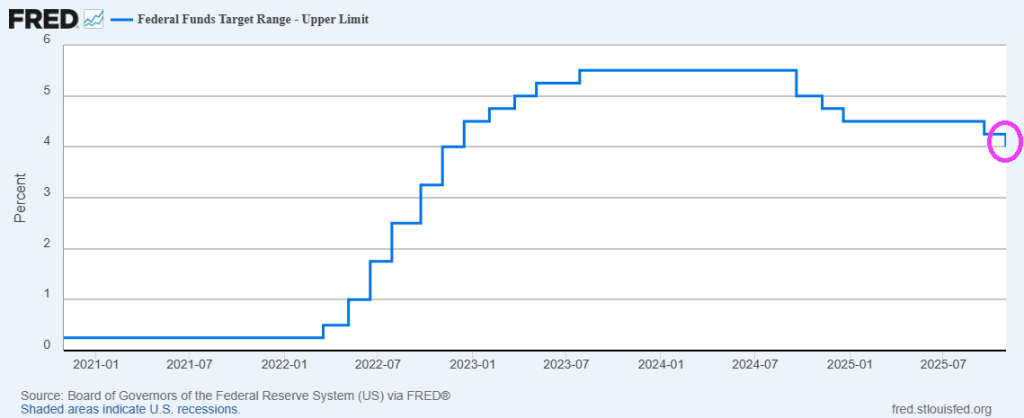
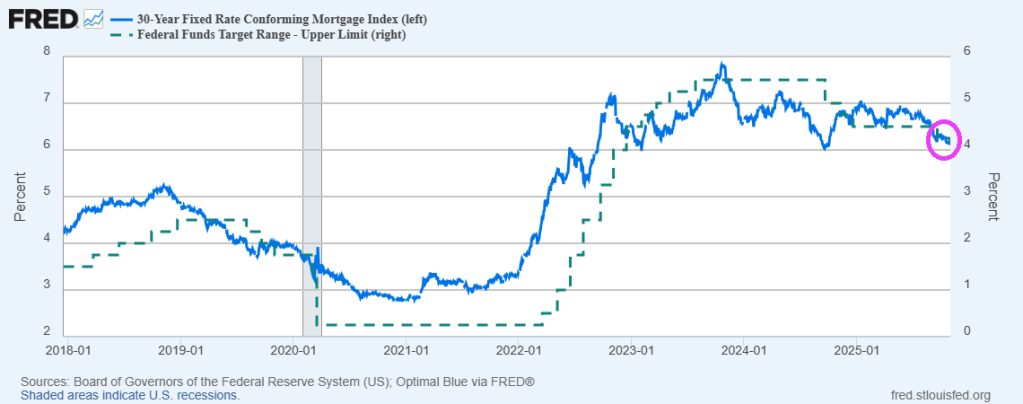
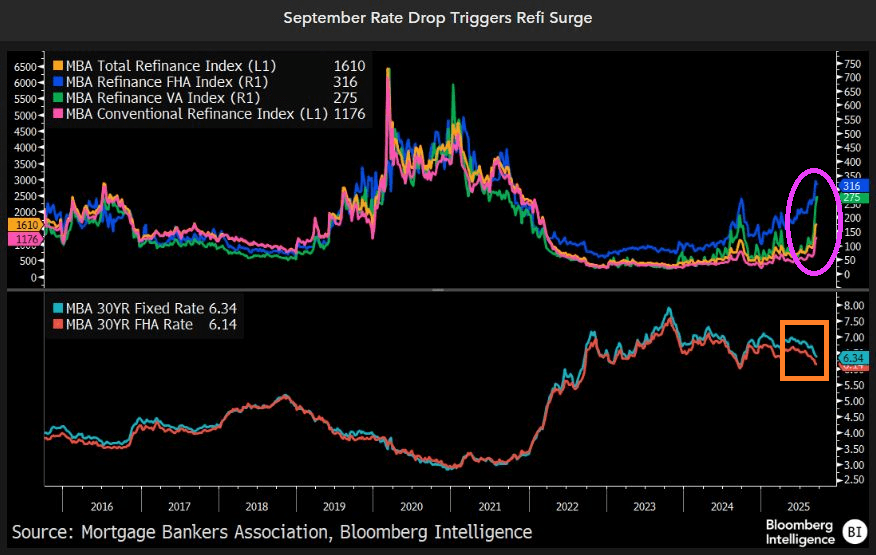
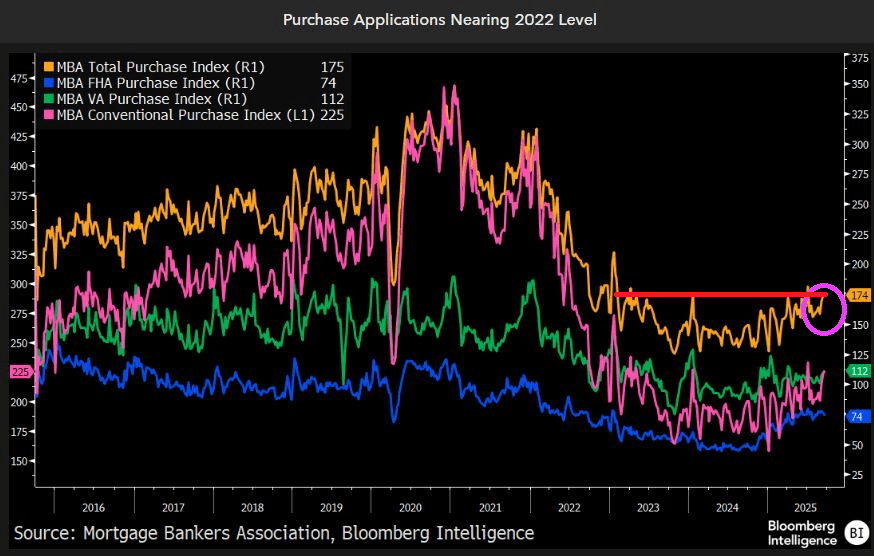
Why the freeze? – Rate lock-in: Over 70% of homeowners are sitting on sub-5% mortgages and are reluctant to trade them for today’s rates exceeding 6%.
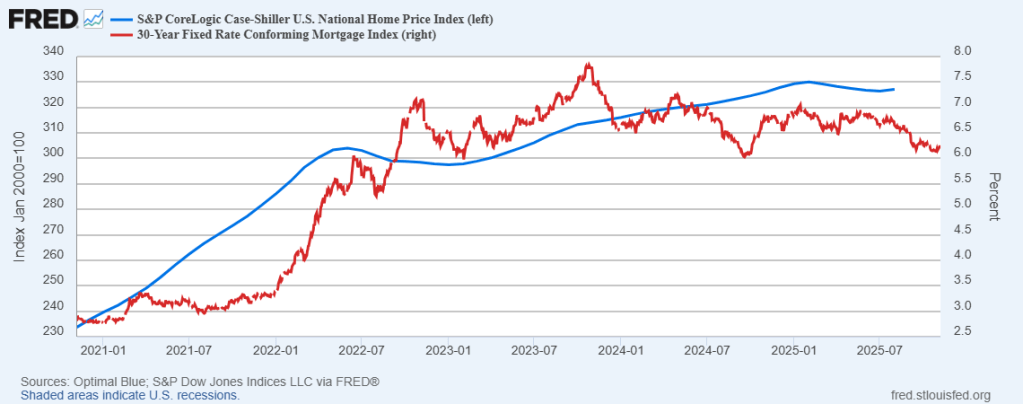
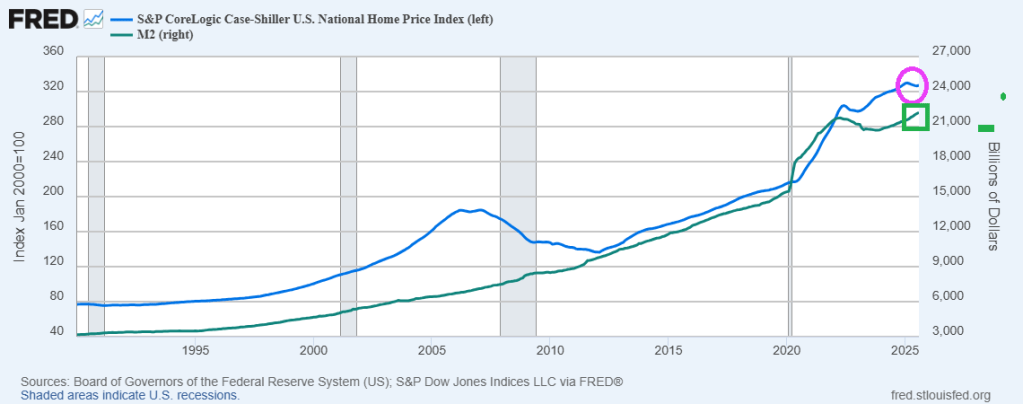
Sticker shock: Record prices combined with high borrowing costs have left many potential buyers on the sidelines. The result is a housing market that remains stagnant.
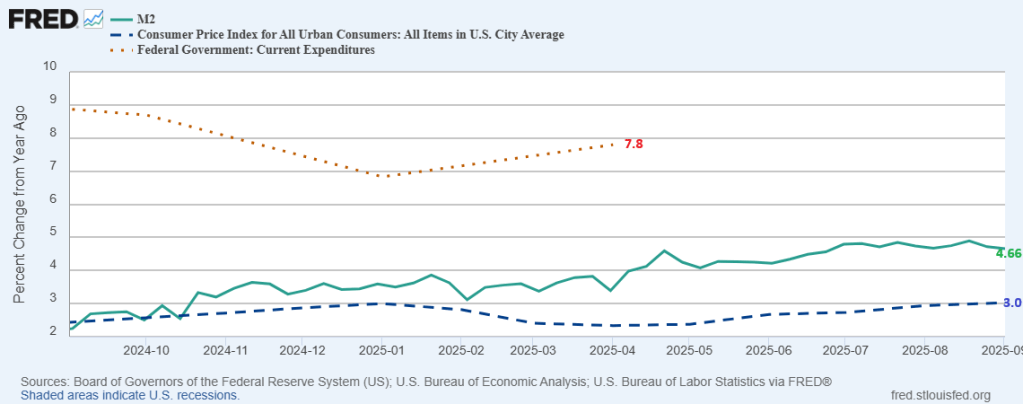
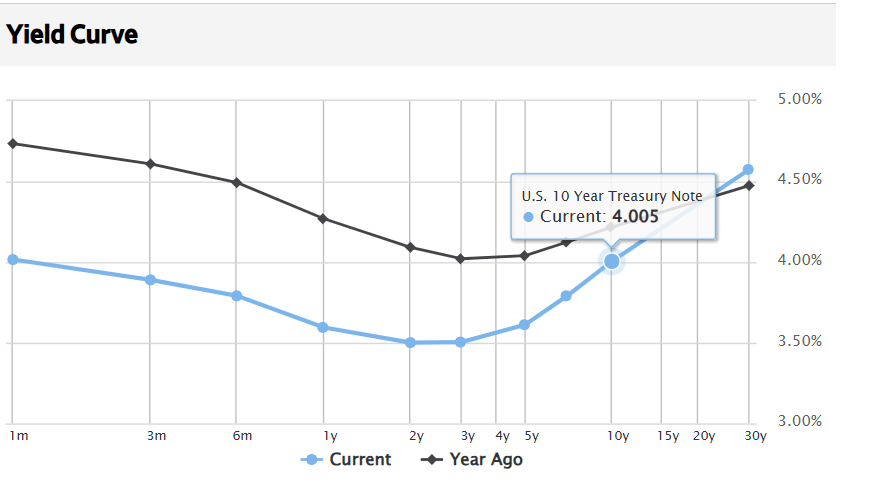
*Home prices are relatively high as are mortgage rates.
Someone will undoubtedly write me to look at Singapore. Yes, I know. Been there, done that. Or London.
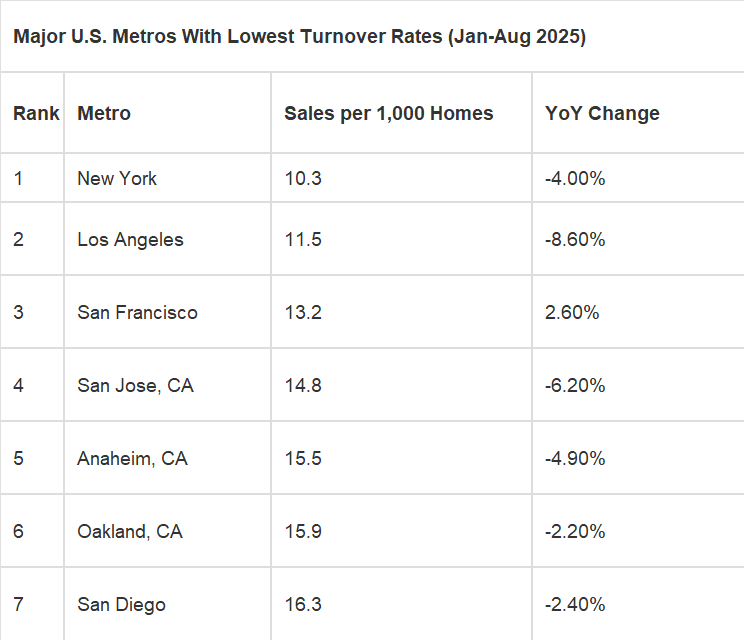
In the US, the lowest turnover rates are in Democrat strongholds New York and California.


You must be logged in to post a comment.