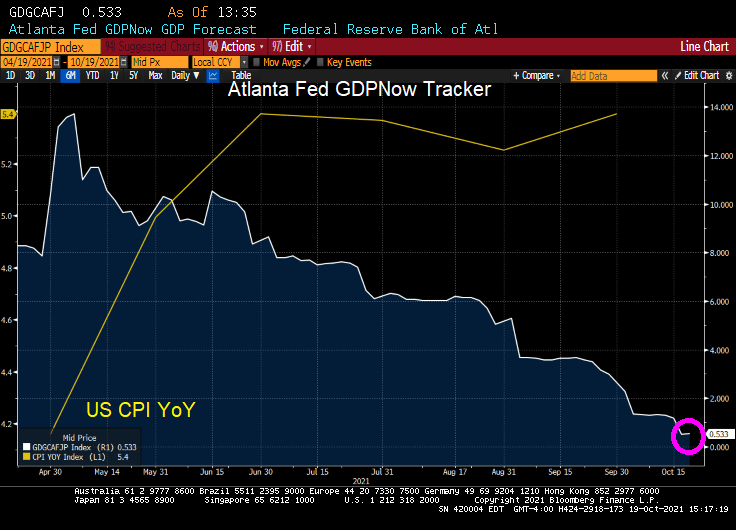
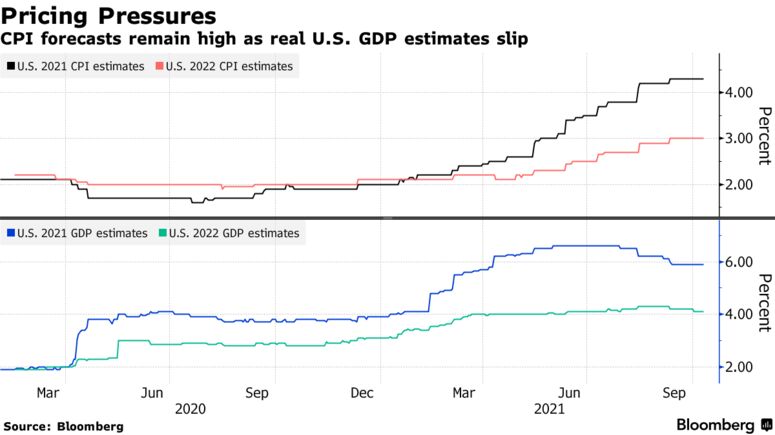
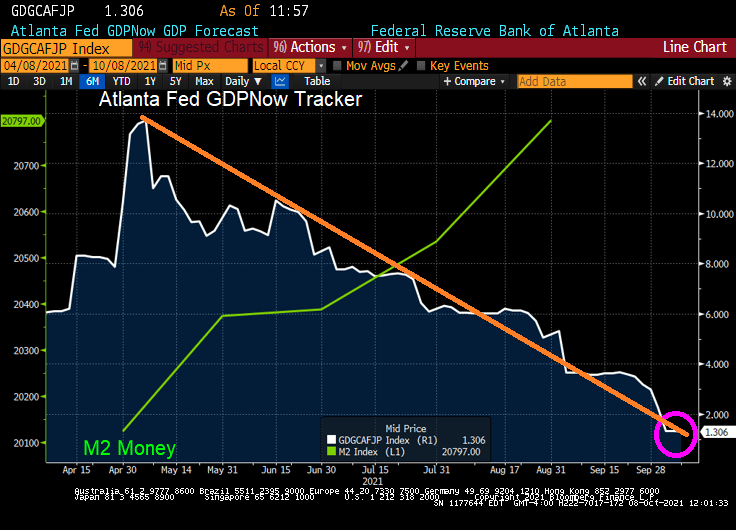
Despite monetary Stimulypto from The Federal Reserve (still growing!), US real GDP has fallen to almost zero.
The GDPNow model estimate for real GDP growth (seasonally adjusted annual rate) in the third quarter of 2021 is 0.2 percent on October 27, down from 0.5 percent on October 19. After the October 19 GDPNow update and subsequent releases from the US Census Bureau, the National Association of Realtors, and the US Department of the Treasury’s Bureau of the Fiscal Service, a decrease in the nowcast of third-quarter real government spending growth from 2.1 percent to 0.8 percent was slightly offset by an increase in the nowcast of third-quarter real gross private domestic investment growth from 9.0 percent to 9.3 percent. Also, the nowcast of the contribution of the change in real net exports to third-quarter real GDP growth decreased from -1.56 percentage points to -1.81 percentage points.
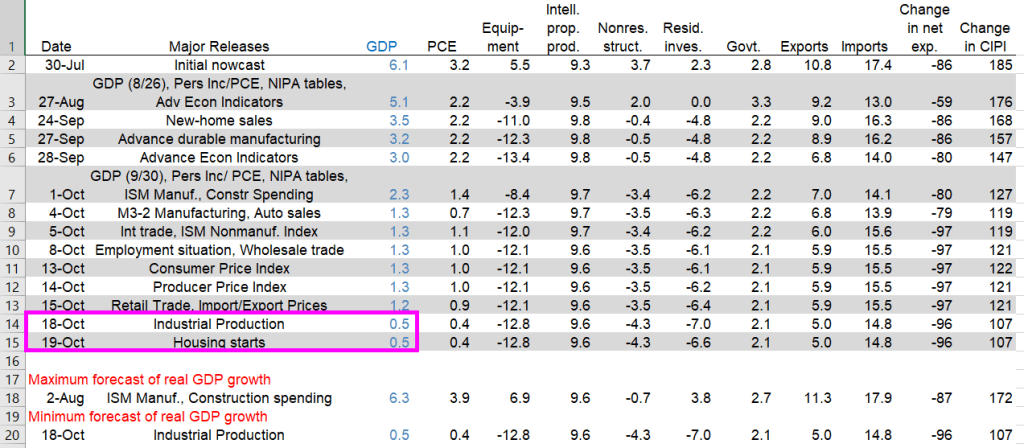
The Atlanta Fed’s GDPNow model estimate for real GDP growth (seasonally adjusted annual rate) in the third quarter of 2021 is 0.5percent on October 19, down from 1.2 percent on October 15. After recent releases from the US Census Bureau and the Federal Reserve Board of Governors, the nowcasts of third-quarter real personal consumption expenditures growth and third-quarter real gross private domestic investment growth decreased from 0.9 percent and 10.6 percent, respectively, to 0.4 percent and 8.4 percent, respectively.
US real GDP nosedived to 0.5% according to the Atlanta Fed GDPNow real-time tracker.
Again, The Fed and Federal government pumped trillions of stimulus into an unprepared economy resulting in massive bottlenecks. So, we are getting declining GDP and rising inflation.
Yesterday’s industrial production dove leading to the 0.5% GDP figure. Today’s housing starts didn’t impact GDP in a meaningful way.
Everyone seems worried about it. Bridgewater Associates co-Chief Investment Officer Greg Jensen says spiraling prices that choke off growth are a “real risk” that many portfolios are massively overexposed to. A “fairly strong consensus” of market professionals believe that some kind of stagflation is more likely than not, according to a Deutsche Bank AG survey. And while Goldman Sachs Group Inc. urged investors to buy the dip, strategists said “stagflation” was the most common topic in client conversations.
Wherever you fall on the debate, alarm bells are ringing as energy prices head toward multiyear highs and persistent shortages crimp supply chains worldwide. That’s fueling price pressures and pushing up bond yields just as economic growth is cooling and central banks such as the Federal Reserve weigh scaling down pandemic-era stimulus. And after a second straight month of disappointing U.S. jobs gains, the stakes are rising heading into this week’s inflation report.
“The reality that inflation is more persistent and sustainable than the ‘transitory’ camp thought, and that inflation and its causes are in turn slowing economy growth,” said Peter Boockvar, chief investment officer for Bleakley Advisory Group.
Energy Epicenter
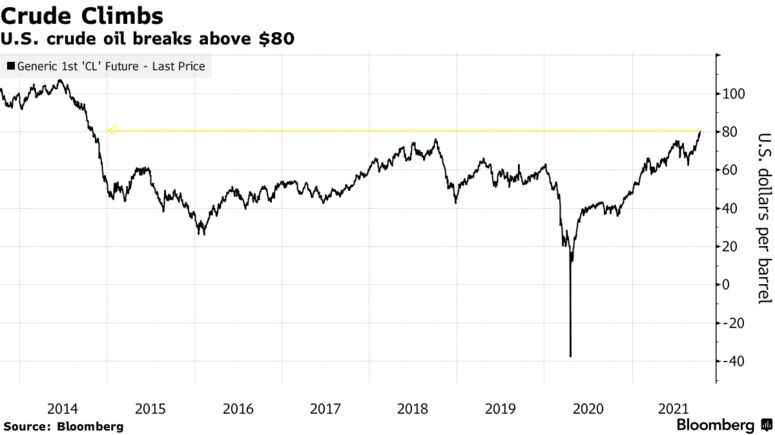
Much of the stress is emanating from the energy market, where West Texas Intermediate crude oil broke above $82 per barrel for the first time since 2014 on Monday amid a power crisis from Europe to Asia. Prices of coal and natural gas have also jumped, with demand ahead of winter whittling worldwide stockpiles.
The commodity surge has thrust stagflation fears front-and-center in markets, given that higher energy prices have the potential to pinch consumers, according to Principal Global Investors. Gains in consumer spending are already expected to slow, leading Goldman economists to slash U.S. growth estimates over the weekend.
“The idea was already starting to take shape. The increase in commodity prices has just formalized those fears,” said Seema Shah, Principal’s chief global strategist. “While there have been complaints around higher food prices, higher lumber prices, higher clothes prices, it’s the increase in household bills that has really put fear into peoples’ minds, because it is so visible and rising gas prices are difficult to substitute away from for an average household.”
Murky Bond Picture
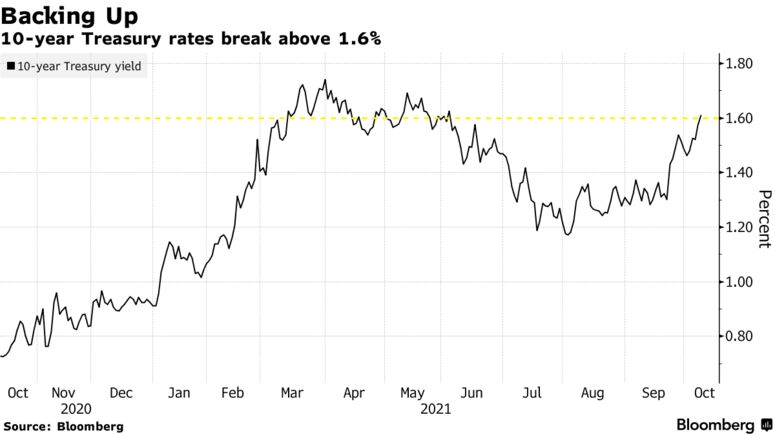
Sky-high commodity prices have filtered through to the Treasury market, where yields on benchmark 10-year notes broke above 1.6% for the first time since June last week. Driving the gain is an increase in breakeven inflation rates, while so-called real yields — often viewed as a proxy of growth expectations — have retreated so far this month.
“If we look at the composition within the TIPs market, we see an increase in breakevens to the detriment of real yields,” BMO strategist Ian Lyngen said on the firm’s “Macro Horizons” podcast. “We read this as the market’s focus on longer-term inflation has taken some of the optimism out of the growth profile going forward.”
Morgan Stanley strategist Andrew Sheets disagrees. Breakeven rates are still below their May peaks, while the cross-asset landscape is distinct from the stagflationary setup of the 1970s, he argued. Data compiled by Bloomberg shows gross domestic product is forecast by economists to rise 5.9% this year, 4.1% next year and 2.4% in 2023.
“Asset pricing also couldn’t be more different. Over the last century, the 1970s represented an all-time high for nominal interest rates and an all-time low for equity valuations,” Sheets wrote in a note Sunday. “Today we’re near a low in yields and a high in those valuations.”
Stocks Still Serene
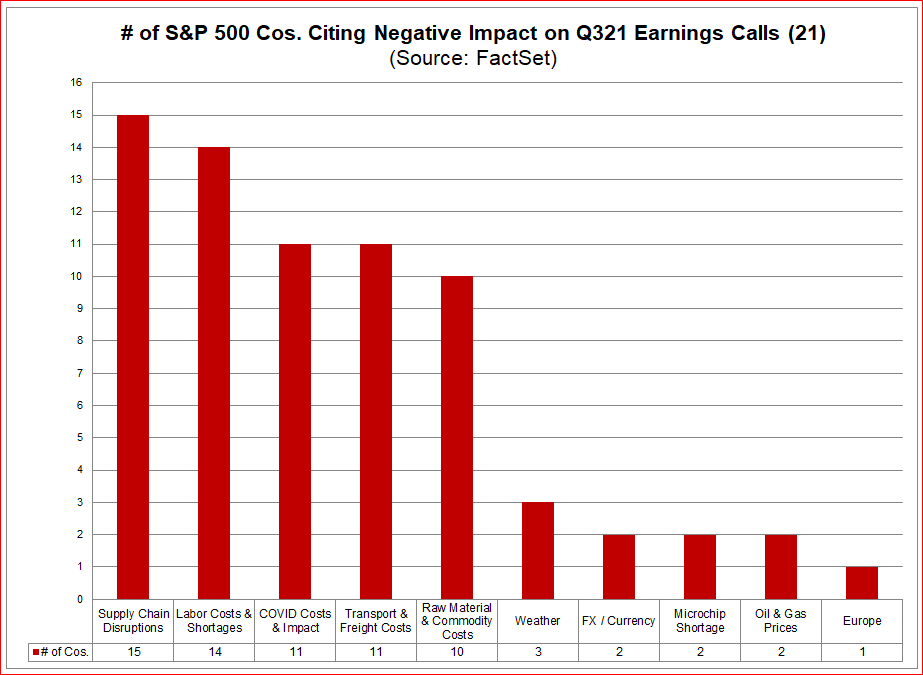
Equity investors so far seem unperturbed. That’s the view of Matt Maley, chief market strategist for Miller Tabak + Co., given that the S&P 500 is just 3.9% lower from its all-time high. However, the mood music could change as the third-quarter reporting season kicks off and corporate executives sound off on supply chain issues and rising input costs, he said.
“The key should be this earnings season,” Maley said. “If a lot of companies start talking about margin pressures, the stock market will start pricing in stagflation rather quickly.”
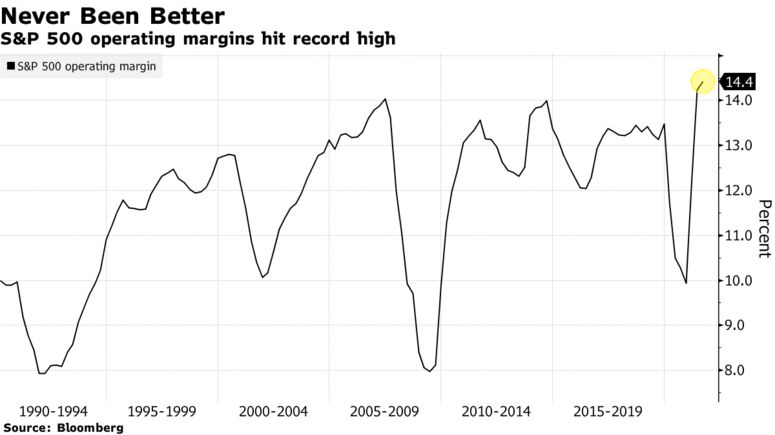
So far, balance sheets have been resilient. Operating margins for the S&P 500 clocked in at 14.4% last quarter, a record high, with companies in many cases actually benefiting from the inflation uptick.
But should stagflation fears start to meaningfully rattle equity markets, shares of companies with higher pricing power — the ability to pass on costs — should profit, according to Goldman, after several weeks of underperformance.
“Stocks with strong pricing power have recently lagged but appear attractive if stagflationary concerns continue to build,” strategists led by David J. Kostin wrote. “If inflation remains high alongside a weakening economic growth outlook, firms with strong pricing power should be best positioned to maintain profit margins despite slowing revenue growth and rising input costs.”
Not to mention real-time GDP of 1.3%. And falling!
Of course, there will be cries in Washington DC to spend trillions … and trillions … and trillions.
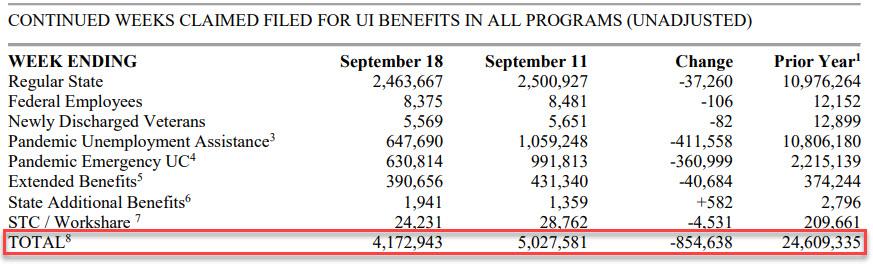
Initial jobless claims dropped below their recent range last week, falling to the second lowest level since the COVID-lockdowns crushed the economy. Only 326k Americans filed for jobless benefits for the first time last week, down from 364k last week and below the 348k expectation.
Continuing claims also declined from the previous week, again largely from Pandemic Unemployment Assistance and Pandemic Emergency Claims programs ending.
On a related note, Challenger job cuts were down -84.9% YoY. But for September, there was a surge in low-paying retail jobs and transportation jobs as Panademic stimulus ran out and governments have pretty much stopped their destructive government shutdowns of economies.
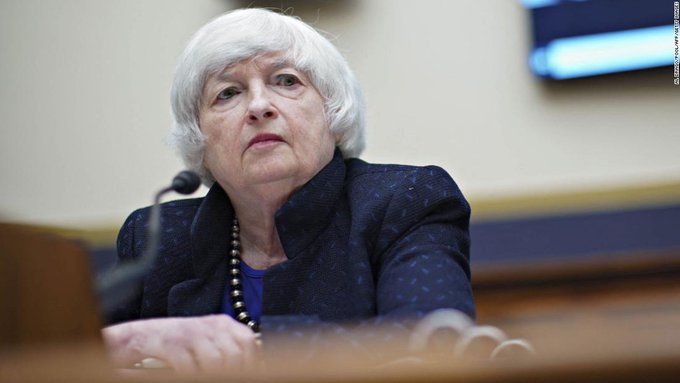
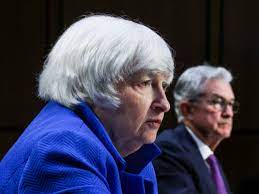
Well, Janet, we are headed there anyway with GDP crashing to a measly 1.33%.
The fear of not approving a debt ceiling increase (laughable since Democrats can do it on their own) has caused there to be a “little dipper” in the US Treasury actives curve. Meaning that the 1-month T-bill yield is higher than the 1-year T-bill yield.
Phil Hall of Benzinga wrote a series of excellent articles in four parts for MortgageOrb (although “The Orb” has removed his name). Here are the links to his stories.
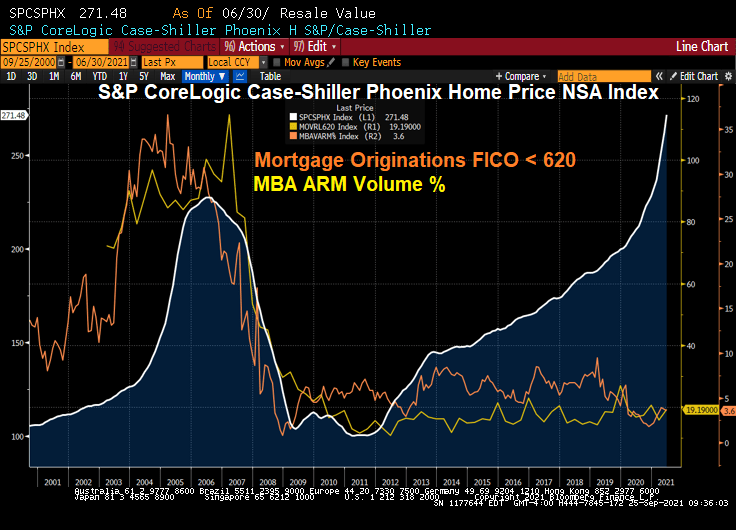
After re-reading these excellent articles on the housing bubble and crash, I thought I would take the opportunity to present a few charts to highlight the housing bubble, pre-crash and post-crash.
Here is a graph of Phoenix AZ home prices. Note the bubble that peaked in mid 2006. The Phoenix bubble correlates with the large volume of sub-620 FICO lending and Adjustable-rate mortgage (ARM) lending. Bear in mind, many of the ARMs prior to 2010 were NINJA (no income, no job) ARM loans.
What happened? Serious delinquenices at the national levels spiked as The Great Recession set in and unemployment spiked.
Since the housing bubble burst and surge in serious mortgage delinquencies, The Federal Reserve entered the economy with a vengeance. And have never left, and increased their drowning of markets with liquidity.
The Fed whip-sawing of interest rates in response to the 2001 recession was certainly a problem. They dropped The Fed Funds Target rate like a rock, then homebuilding went wild nationally and home prices soared thanks to Alt-A (NINJA) and ARM lending. But now The Fed is dominating markets like a gigantic T-Rex.
Oddly, then Fed Chair Ben Bernanke never saw the bubble coming. Or the burst.
Speaking of pizza, Donato’s from Columbus Ohio is my favorite. Founder’s Favorite is my favorite, but they do offer the dreaded Hawaiian pizza (ham, pineapple, almonds and … cinnamon?)
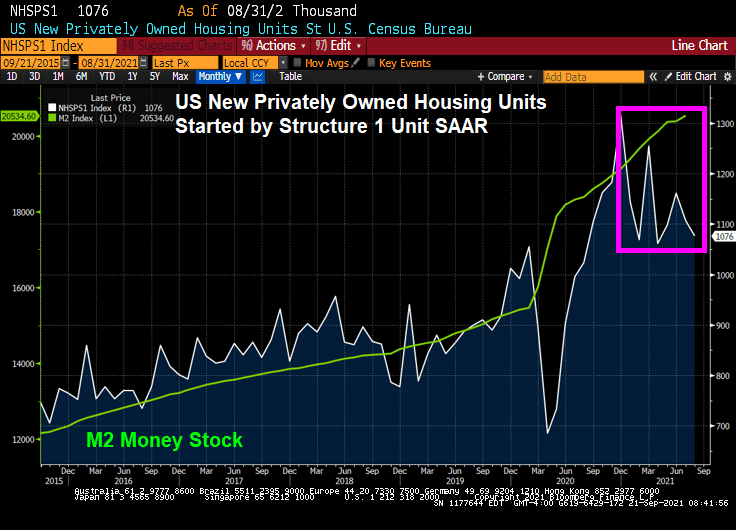
The unorthodox monetary stimulus from The Federal Reserve and stimulypto-level spending by the Federal government has resulted in a surge in US housing starts. But that thrill may be gone if the stimulypto is removed.
(Bloomberg) -By Olivia Rockeman- U.S. housing starts rose by more than expected in August, suggesting that the supply and labor constraints that have been holding back construction eased in the month.
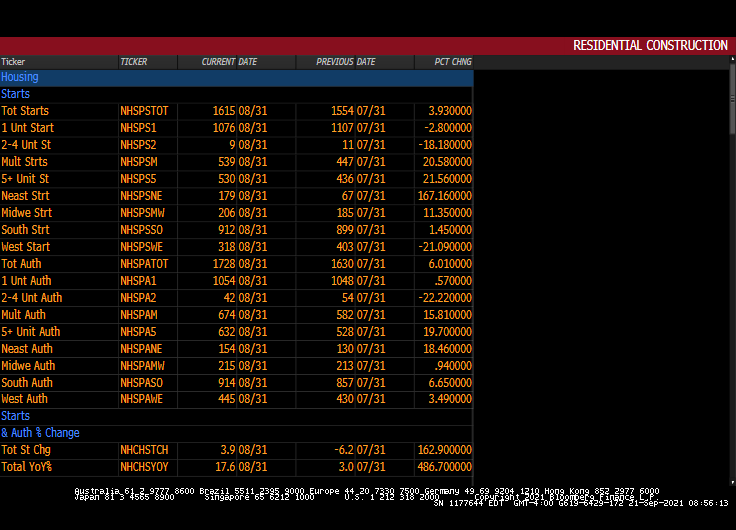
Residential starts rose 3.9% last month to a 1.62 million annualized rate after an upwardly revised July print, according to government data released Tuesday. The median estimate in a Bloomberg survey called for a 1.55 million pace.
Building permits, meanwhile, increased 6% in August, the biggest gain since January, reflecting a sizable jump in multi-family units. Permit applications for single-family homes also edged higher.
The data suggest that builders are making some construction headway despite limited availability of land, labor and materials, which has slowed residential starts from a 15-year high in March. Despite the bottlenecks, housing starts remain mostly above pre-pandemic levels, which is expected keep construction activity elevated for some time.
1-unit (single family detached) starts got a tremendous jolt from The Fed’s monetary stimulus and Federal governments fiscal stimulus. But government stimulus wears out.
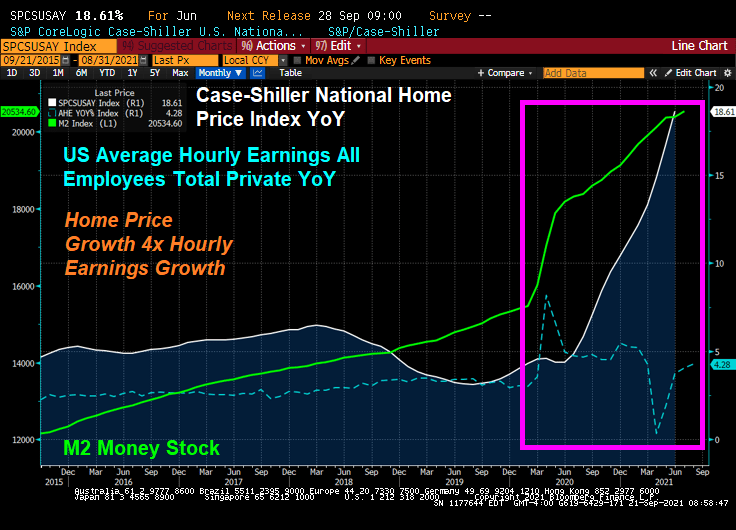
Given the high cost of housing in the USA, particularly in coastal metro areas, we see home price growth raging at over 4 times hourly earnings growth.
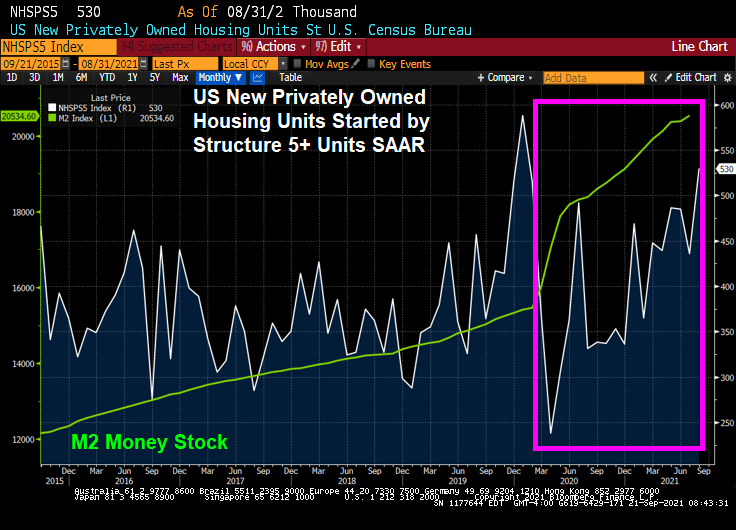
As a result, we are seeing a burst of 5+ unit (multifamily) housing starts. Note the burst of 5+ housing starts prior to Covid striking in early 2020.
Permits for 1-unit housing are up only slightly but 5+ unit permits are up 19.7%.
Remember, the withdrawal of fiscal stimulus will lead to a big fiscal cliff.
The US Bureau of Labor Statistics released their Real Earnings Report for August yesterday. And is it pretty depressing for US workers.
Real average hourly earnings for all employees increased 0.4 percent from July to August, seasonally adjusted. This result stems from an increase of 0.6 percent in average hourly earnings combined with an increase of 0.3 percent in the Consumer Price Index for All Urban Consumers (CPI-U).
Real average weekly earnings increased 0.3 percent over the month due to the change in real average hourly earnings combined with no change in the average workweek.
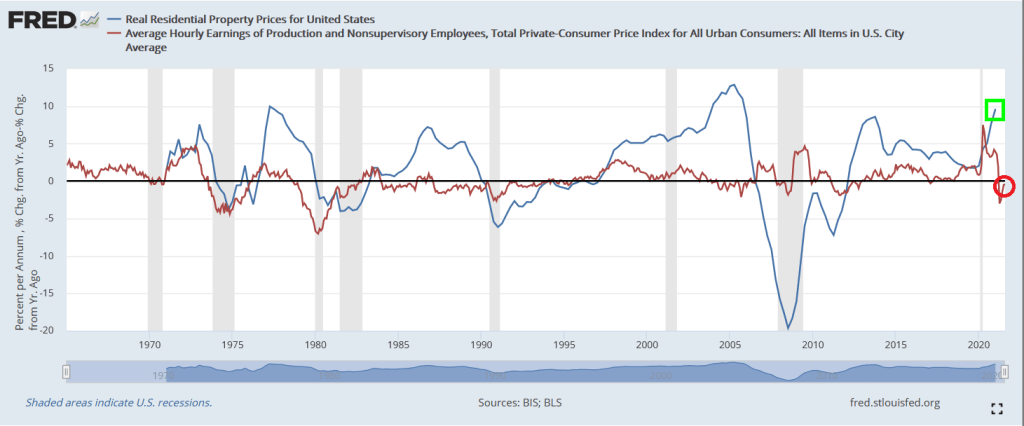
If we look at REAL US housing prices versus REAL average hourly earnings for production and nonsupervisory employees, we can see waves of imbalance between the two measures (also known as “bubbles”). Such as today.
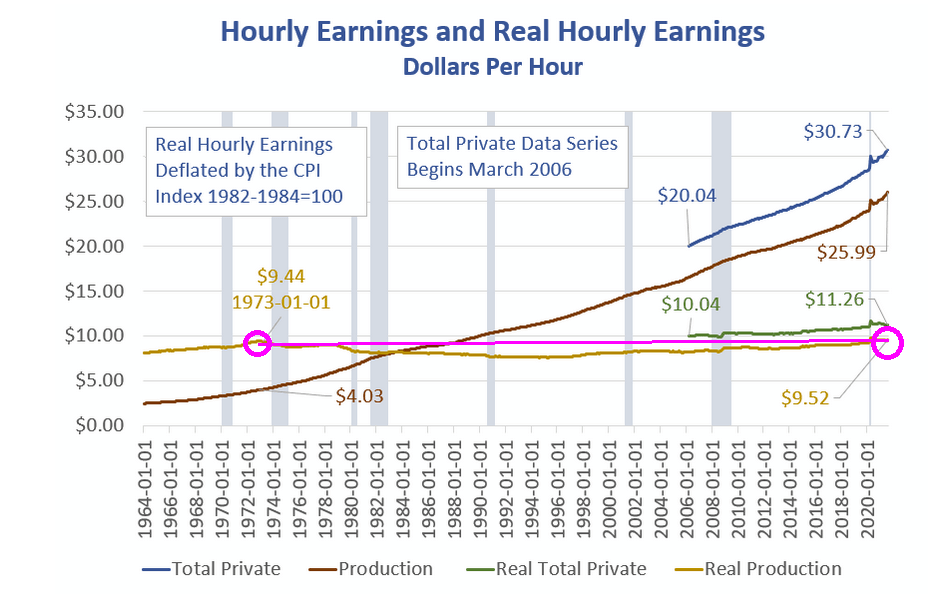
But the real horror chart is the following (courtesy of Mish). It shows that real hourly earnings have barely changed since January 1973.
Of course, labor outsourcing to lower labor cost countries is the chief culprit. Karsten Manufacturing, maker of Ping golf clubs, no longer makes their castings in Phoenix AZ thanks, in part, to EPA regulations. Ping clubheads are now made in Asia.
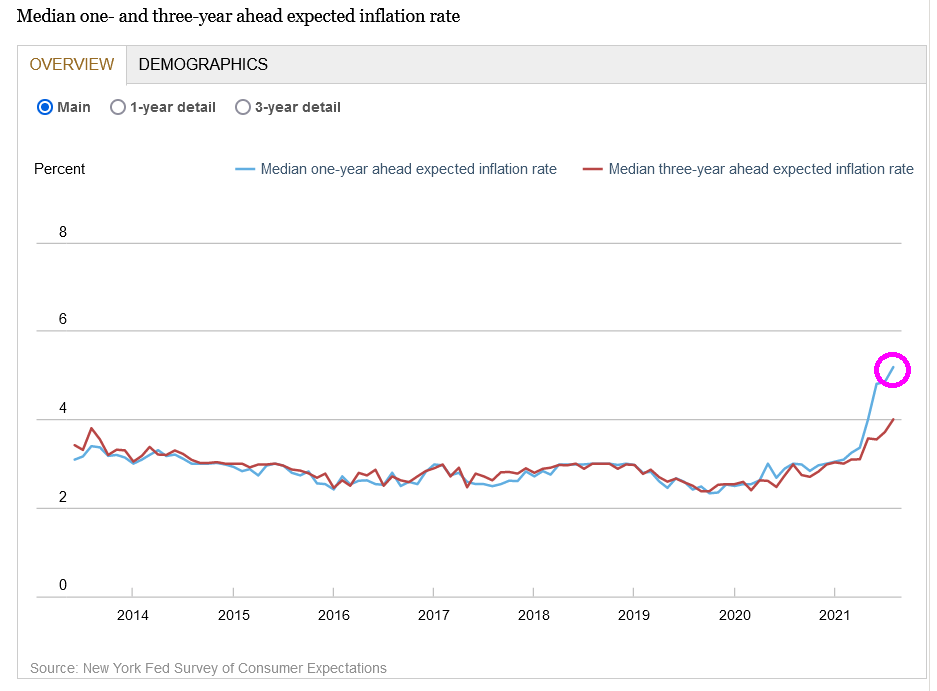
In its August Survey of Consumer Expectations, the bank said Monday that respondents see inflation a year from now at 5.2%, up from 4.9% the prior month. Three years from now, it is expected to be at 4%, up from 3.7% in July. Both readings mark record-high readings for data that goes back to 2013.
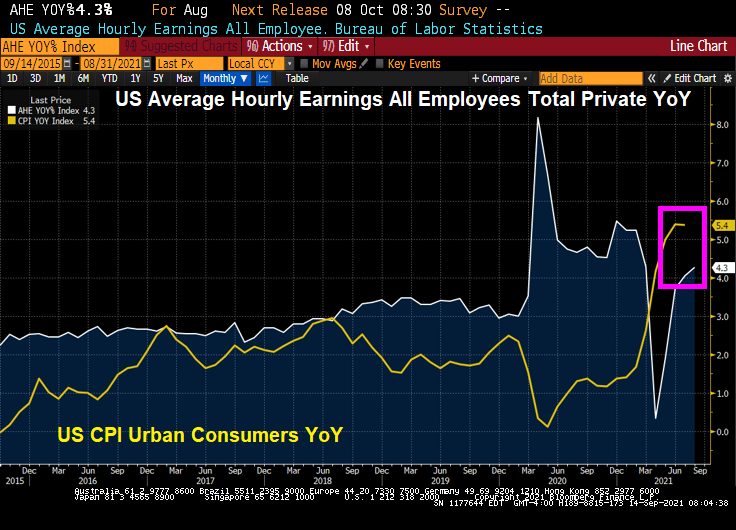
It is a shame that in that last reading that the CPI YoY exceeded Average Hourly Earnings YoY by a 5.4% to 4.3% margin.
Yes, inflation is hot, hot, hot and consumers are feeling it.


You must be logged in to post a comment.