The Fed’s new theme song is “Hold That Tiger” meaning that despite soaring inflation rates, The Fed kept their target rate at 0.25%. Way to really pull a Volcker and raise rates to choke off inflation. … NOT!
However, The Fed doubled the pace of tapering to $30 billion a month. Median forecast shows three rate hikes in 2022, three in 2023.
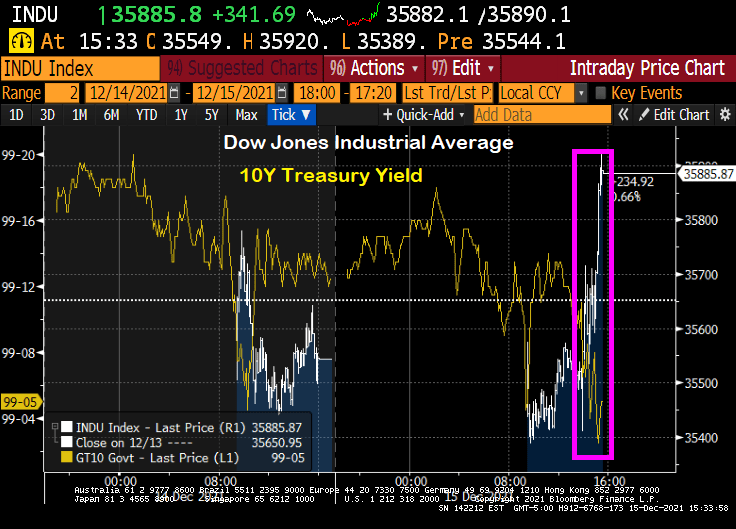
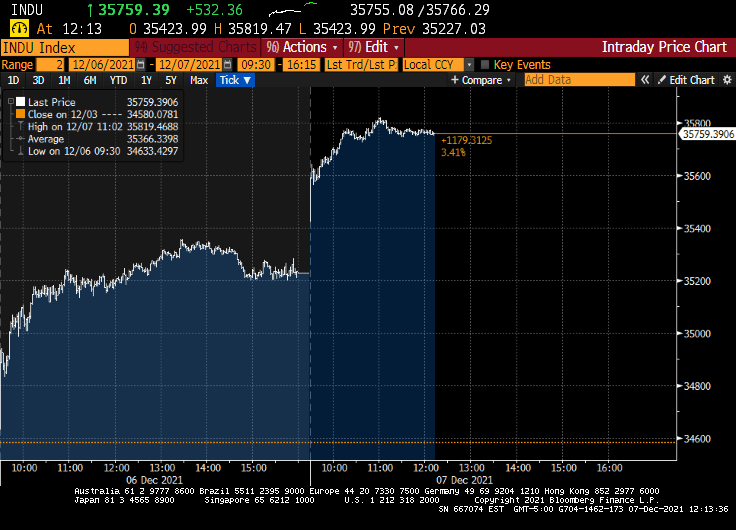
The reaction? The Dow rose 363 points as of 3:36pm EST and the 10-year Treasury yield rose a measly 1.9 bps as markets celebrate The Fed DOING NOTHING TO CURB INFLATION.
If price stability is squandered, financial stability is put at risk. If financial stability is lost, the economy is imperiled and the social contract is threatened.
During the past several quarters, U.S. inflation has surged—now running about triple the Federal Reserve’s 2% target. The surge in prices is unlikely to reverse on its own. The longer that prices are unstable, the greater the challenge to the conduct of macroeconomic policy. The last thing the country needs is its third major economic upheaval in a decade and a half.
The consequences of inflation—and the attendant risks—have long been understood. In 1898 economist Knut Wicksell explained: “Changes in the general level of prices have always excited great interest. Obscure in origin, they exert a profound and far-reaching influence on the whole economic and social life of a country.”
I agree with the op-ed, but as Paul Harvey liked to say, “And now for the rest of the story.”
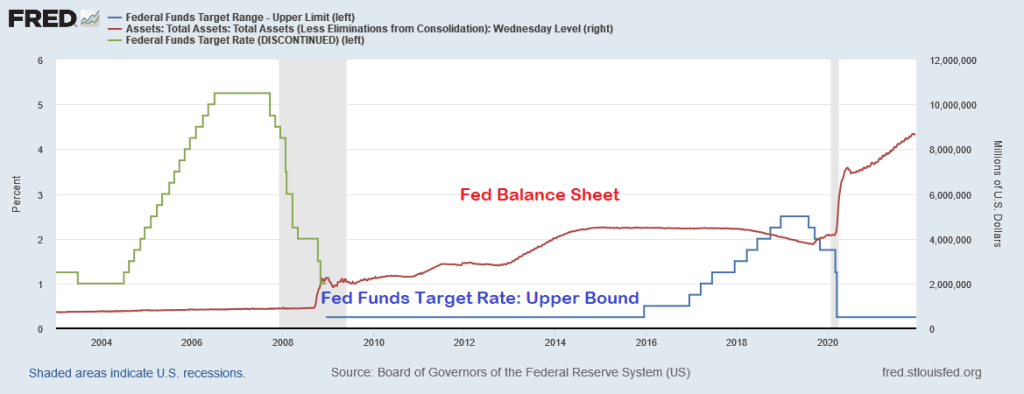
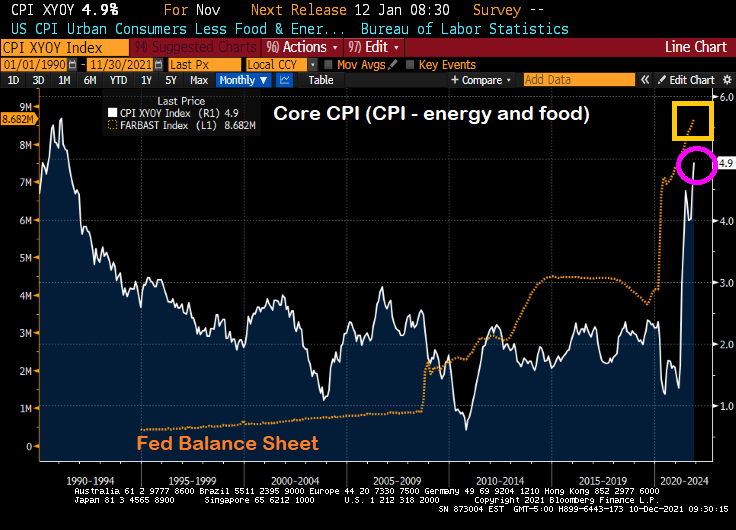
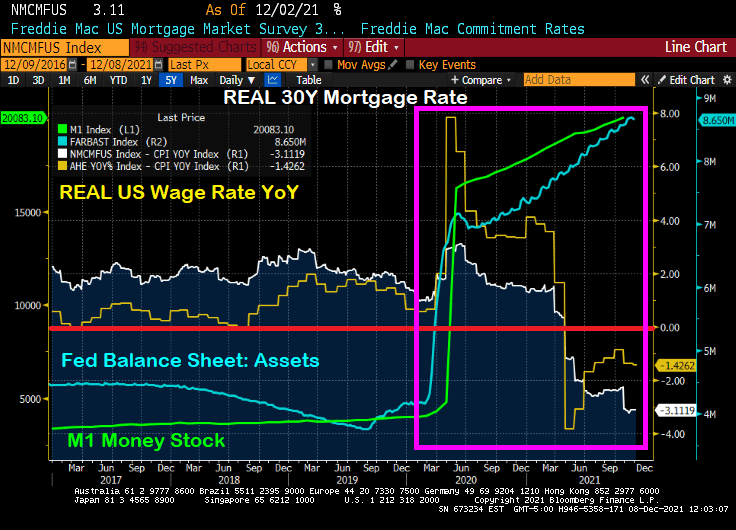
The Federal Reserve is only half of The Federal government “Stimulypto.” Starting in late 2008, The Fed crashed their target rate to 25 basis points and began their quantitative easing (QE) program where The Fed purchased Treasuries and Agency Mortgage-backed Securities (MBS) amongst other assets. Notice in the chart below that QE was adjusted, but never went away and The Fed’s target rate only was increased once before Trump’s election as President, then raised eight times then decreased five times. And no rate increases under Biden. So The Fed scorecard is Obama/Biden: 1 rate increase. Trump: 13 rate changes. And The Fed’s balance sheet has gone bananas since the COVID outbreak.
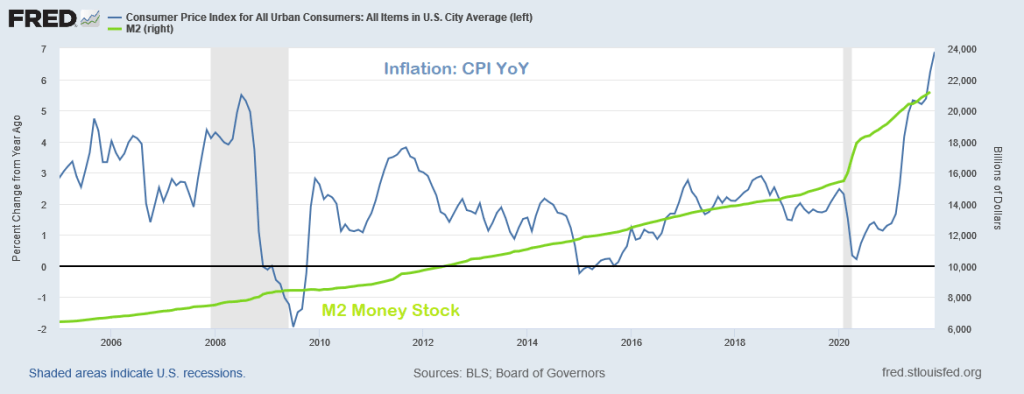
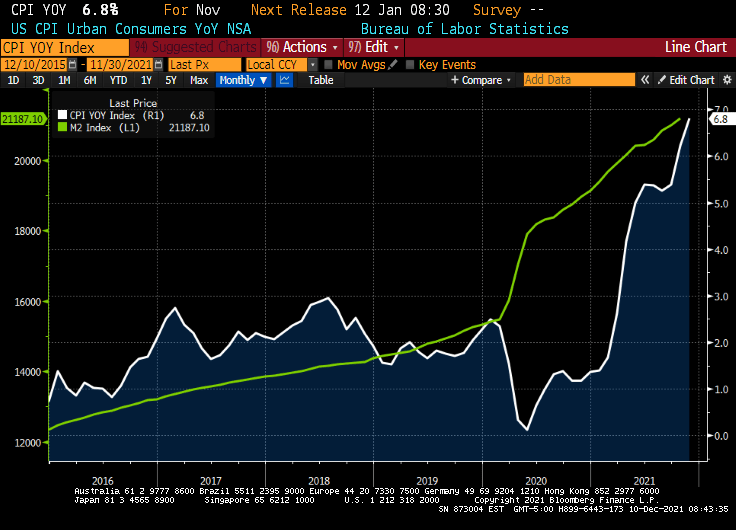
Inflation, as measured by the Consumer Price Index (CPI) didn’t really take-off until March 2021 as a result of STIMULYPTO (excessive monetary stimulus + Federal government spending).
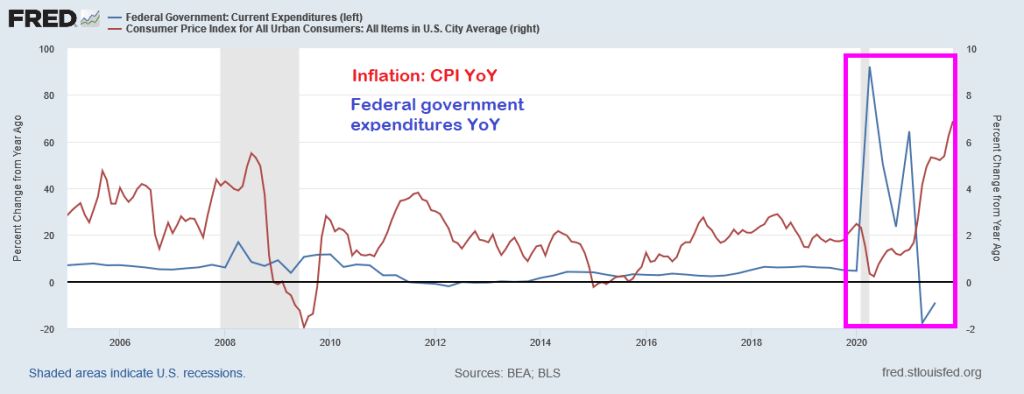
Here is the Federal government spending surge that helped generate the highest inflation in a generation.
So while the op-ed author blames inflation solely on The Federal Reserve, The Fed was unable to achieve its inflation goal for much of the post-financial crisis period. It was the double whammy of Fed monetary stimulus + Federal government stimulus (spending) that pushed inflation to 6.8%.
Following Paul Harvey’s “The Rest of the Story,” I choose baseball player Whammy Douglas to represent the double whammy of Fed + Fed government stimulus to produce inflation. THAT is the rest of the story.
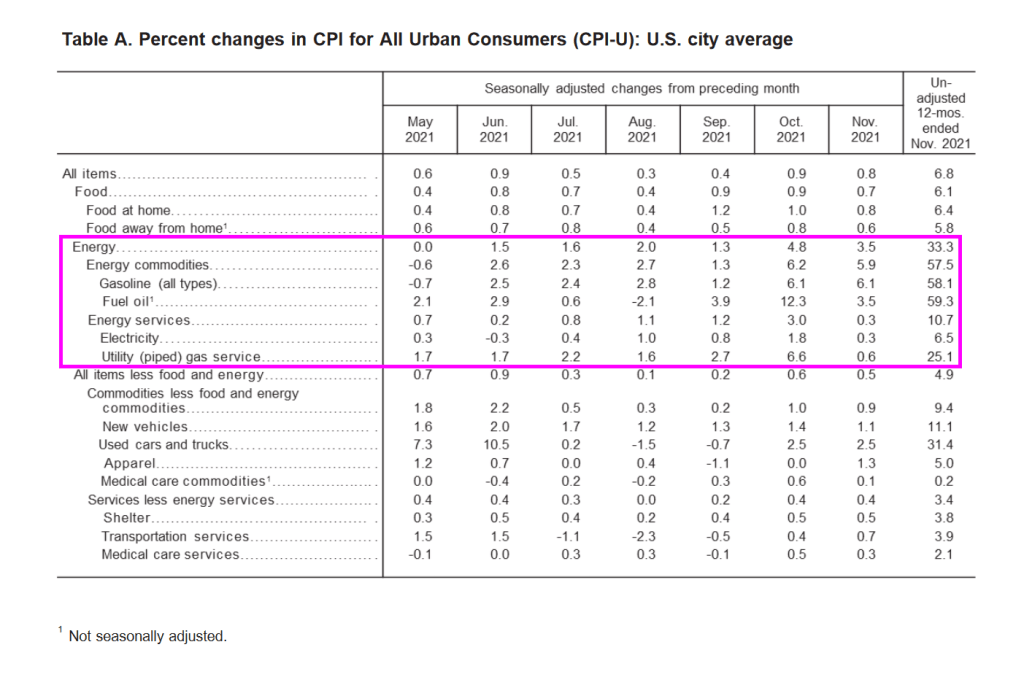
Throw in the Biden Administration’s war on fossil fuels (driving up energy costs by over 50%) and we have a TRIPLE WHAMMY!!
The WSJ op-ed author was focused only blaming The Fed. Sorry, it was a Double Whammy.
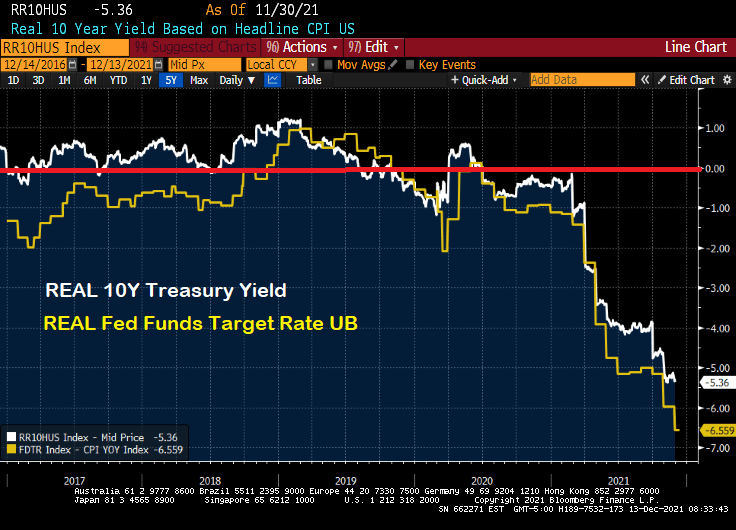
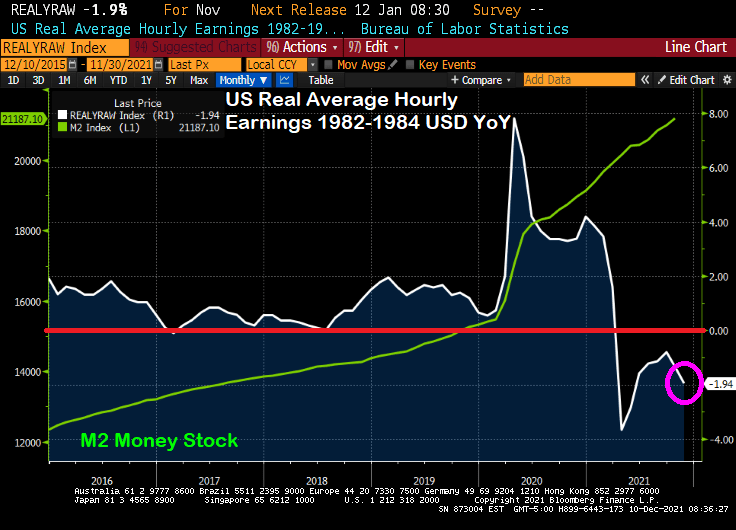
Inflation-adjusted return of Treasuries fell to lowest since the 1980s. For bond investors, this is their version of Kevin’s Famous Chili from The Office! Or The Fed’s Famous Chili!
(Bloomberg) — Treasury investors are losing more money than they have in four decades, once inflation is taken into account. And if markets are right, they’re unlikely to come out ahead for years.
The federal government’s debt has already lost about 2% outright over the past year as the Federal Reserve started removing pandemic-era stimulus from the economy and inched closer toward raising interest rates. But on top of that, the consumer price index has surged 6.8%, putting investors even deeper in the hole.
Taken together, that’s resulting in the worst real returns — or those adjusted for inflation — since the early 1980s, when then Fed Chair Paul Volcker was in the midst of fighting a wage-price spiral. What’s more, the dynamic isn’t expected to change: The bond market is projecting that 10-year Treasury yields will hold below the inflation rate for the next decade, meaning any investment income will be more than wiped out by the rising cost of living.
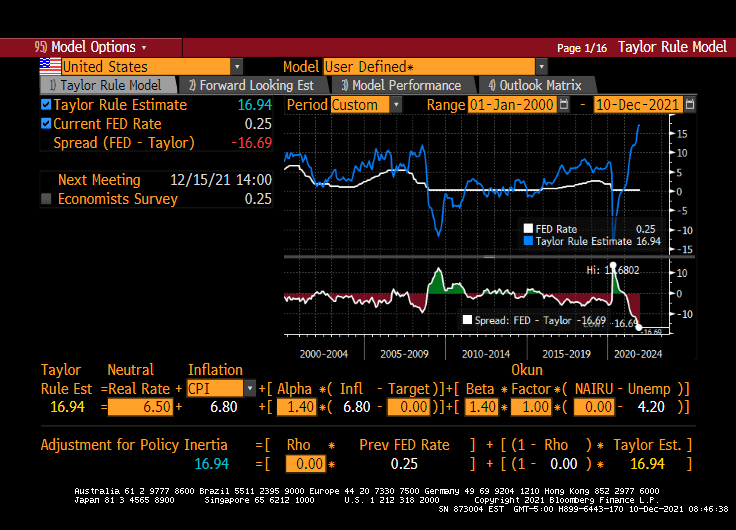
If we look at the REAL 10-year Treasury yield and REAL Fed Funds Target Rate, they are both negative.
Let’s see if Powell spills his famous chili on Wednesday at 2:00PM EST. The Fed keeps saying they are serious about controlling inflation, just like Kevin Malone.
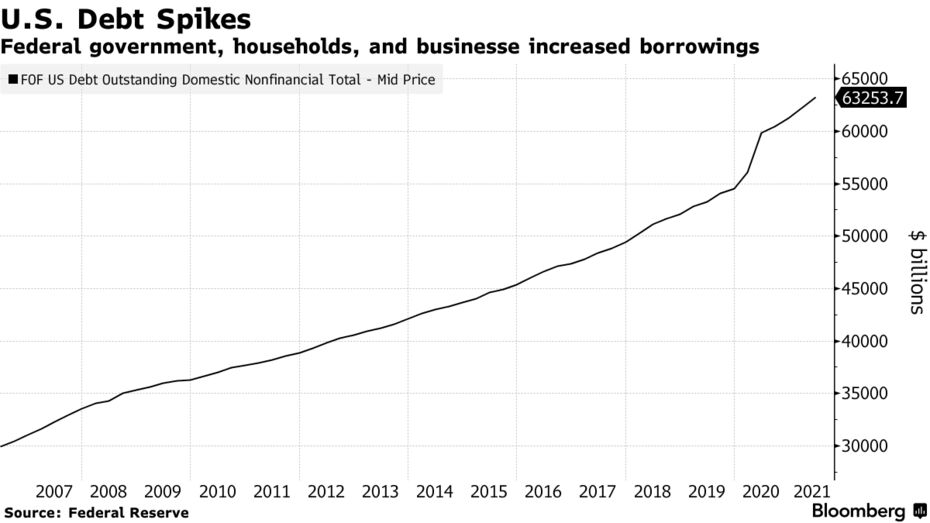
The U.S. went on a borrowing binge last year and the hangover could make it harder for the Federal Reserve to fight inflation without crashing the economy.
Corporate debt has surged $1.3 trillion since the start of 2020 as borrowers took advantage of emergency Fed action as the pandemic spread, slashing interest rates and backstopping financial markets to keep credit flowing. More debt held by more companies suggests potential risks as borrowing costs rise from currently low levels.
That could create financial stability concerns for Fed Chair Jerome Powell and his colleagues as they debate removing pandemic support in the face of what a report Friday showed were the hottest price rises in almost 40 years. And a tough task: Not since Alan Greenspan’s time has the U.S. central bank tried to navigate the economy back to price stability from too-high inflation.
Powell’s challenge is to try to curb price pressures without large costs to employment or growth, a move that would likely anger both political parties and blotch his record with the first Fed-assisted hard landing since the 1990-1991 downturn.”
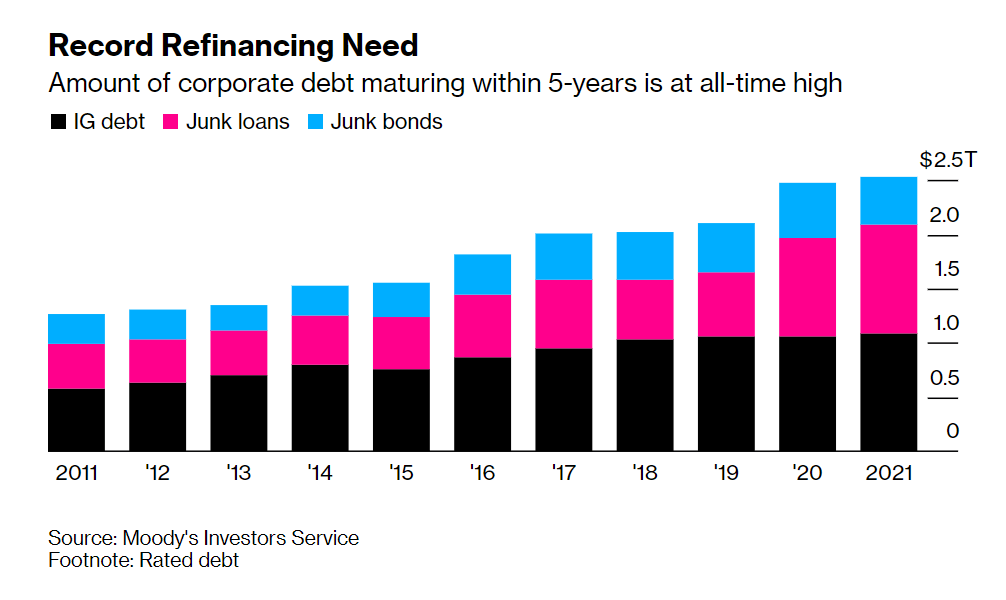
The Fed’s Financial Stability Report on Nov. 2 noted that key measures of vulnerability from business debt, including leverage and interest cover ratios, were back at pre-pandemic levels.
To be sure, big firms that used the opportunity to issue longer-dated bonds at lower rates have strengthened their balance sheets.
Source: Moody’s Investors Service
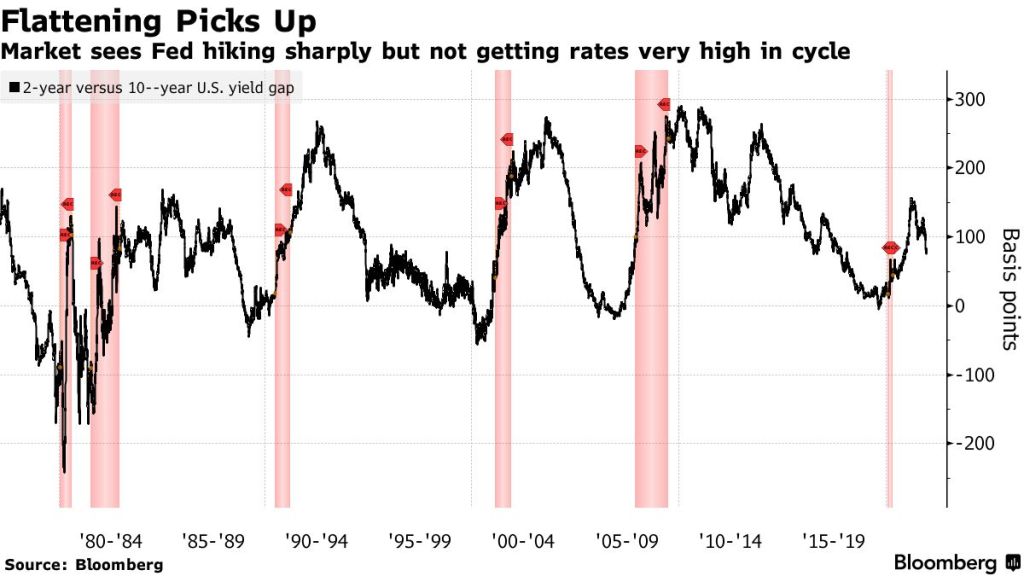
The Federal Reserve is laying the groundwork for the start of a cycle of interest-rate hikes that the bond market warns might be unusually constrained in how far it can go, setting the two on a collision course where one will eventually have to give.
The Treasuries yield curve — or the spread between short-term and long-term interest rates — looks set to be the flattest at the beginning of a Fed tightening cycle in a generation if the central bank begins raising its benchmark overnight rate in mid-2022 as now forecast. The two-year, 10-year spread is about 83 basis points, with futures indicating 55 basis points in June.
The problem facing Powell and The Fed is that they are stuck in a trap. They can’t raise their target rate more than just a little (say 50 basis points) and shrinking their enormous balance sheet is really their only option. And that may fail if the 10 year Treasury yield starts to rise too rapidly or gets too high.
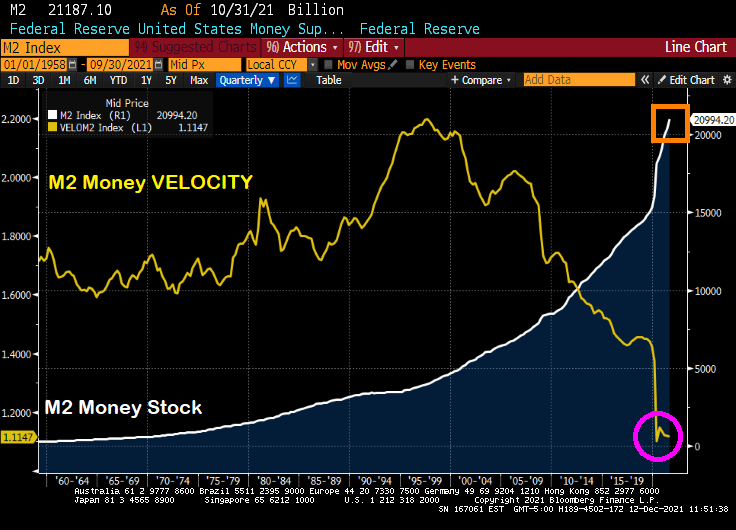
Here is one of the traps facing Powell and the Gang after their Covid printing splurge: dying M2 Money Velocity.
It will only get worse as Congress and the Biden Administration keep spending like drunken ORCs from Lord of the Rings. Particularly when the Penn-Wharton Budget Model finds that Build Back Better will reduce the long-term GDP by 2.8 percent, reduce wages by 1.5 percent, and reduce work hours by 1.3 percent. The only thing it will expand is government debt, by 25 percent.
The Washington DC spending Gollums need to control their urges.
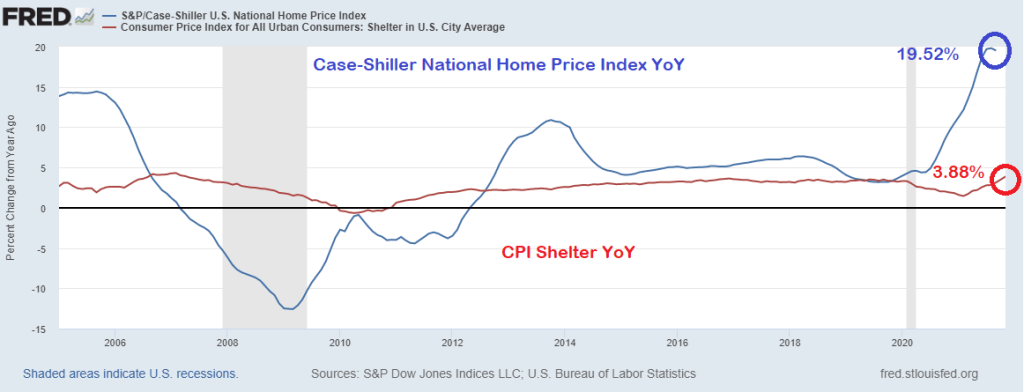
But that 6.9% YoY is very misleading because of the strange way the Bureau of Labor Statistics measures the largest asset in most households’ expenditures: housing.
The BLS measures inflation in housing using the Shelter measurement. Which was only 3.88% YoY. The problem is that the Case-Shiller National Home Price Index was 19.52% in its last reading. That is quite a discrepancy.
So, if we substitute the Case-Shiller National home price index for the CPI Shelter, we get an inflation rate of greater than 11%.
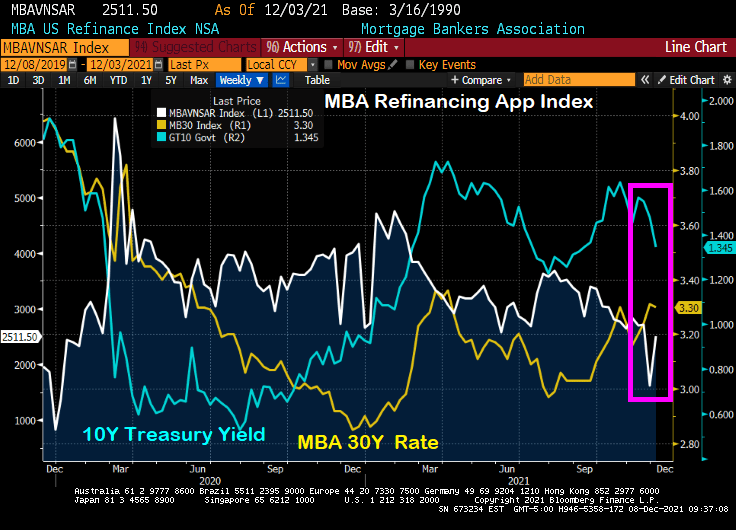
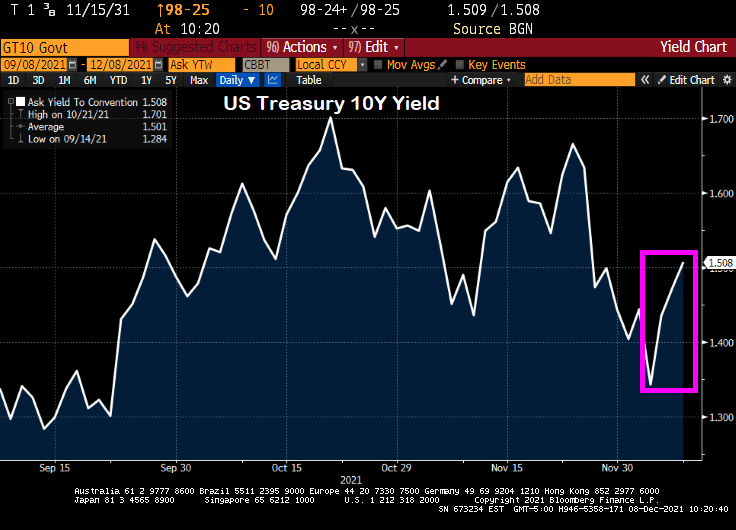
Despite the “Talk, Talk” from The Federal Reserve about balance sheet taper and rate “normalization,” we actually saw the 10-year Treasury yield fall from 1.6651% on 11/23/2021 to 1.343 on 12/3/2021. While the 30-year mortgage rate only fell from 3.31% to 3.3%, it is the SIGNAL that The Fed is sending that people should refinance their mortgages ASAP.
You can see the rise in mortgage refinancing applications of 56% week-over-week (WoW) (white line) with the drop in the 10-year Treasury yield (blue line) despite the relatively small drop in the Mortgage Bankers Association (MBA) tiny drop in their 30-year mortgage rate index.
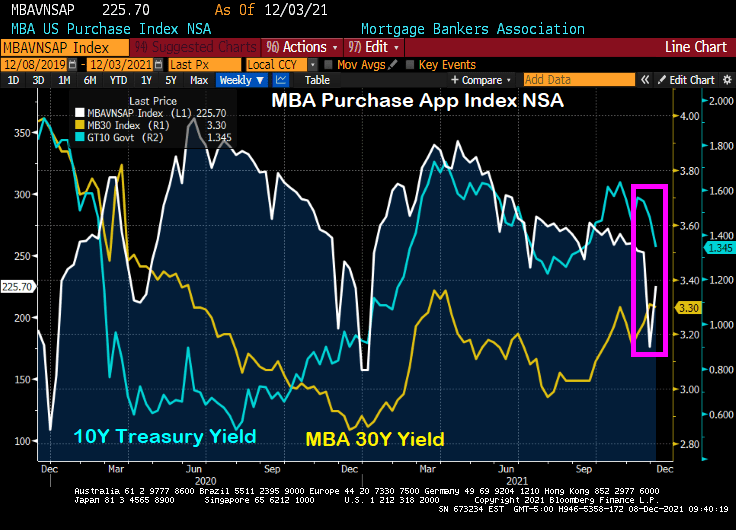
Ditto for the MBA mortgage purchase application index. The drop in the US Treasury yield (blue line) resulted in a 28% WoW increase in mortgage purchase applications.
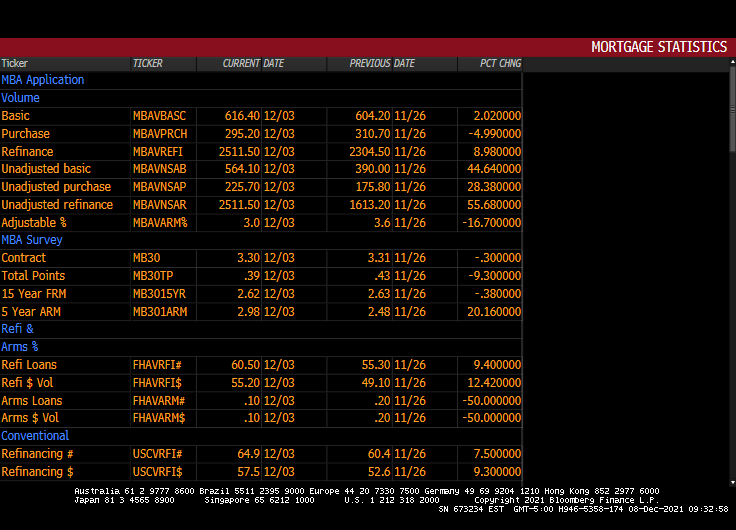
Here is the table of MBA data for the week of 12/03.
Please note that the 10-year Treasury yield have jumped since 12/03 indicating that mortgage application activity for the week of 12/10 will be lower.
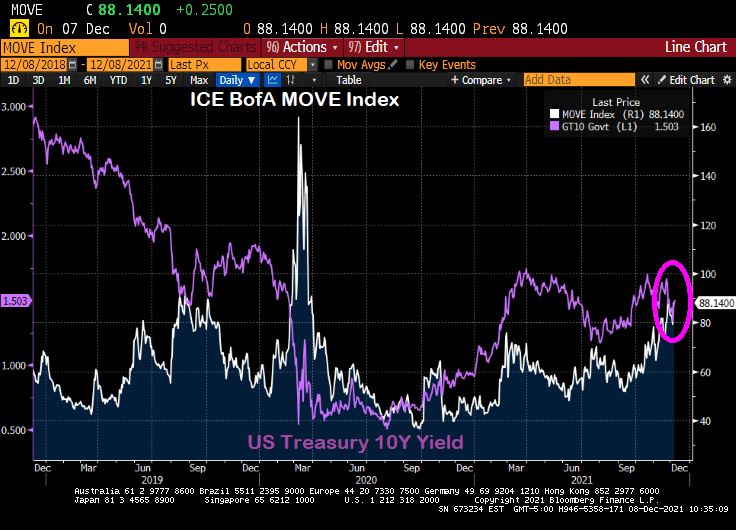
Here is the MOVE bond volatility index and the US Treasury 10-yield chart. Can you spot the COVID outbreak??
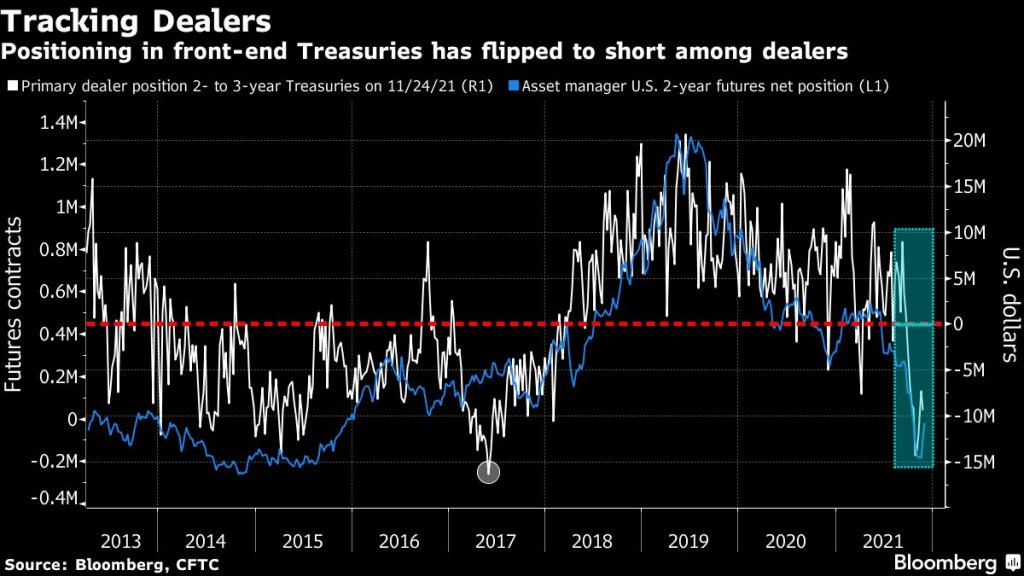
(Bloomberg) — The recent drop in primary-dealer holdings of front-end Treasuries is another warning of potential market dislocation heading into the year-end liquidity vacuum.
As of Nov. 24, primary dealers — which are mostly the large banks — were on the whole betting against two- to three-year Treasuries rather than buying. They had net short positions of just over $9 million, near the most bearish levels since 2017, signaling a pullback by buyers that provide crucial liquidity for older Treasury issues.
The positioning in the front-end of the curve “suggest less demand from the dealer community to fund off-the-run long positions,” Barclays strategists Anshul Pradhan and Andres Mok say in a Dec. 3 note. Off-the-run Treasuries are notes and bonds created in past years and traded less frequently than the newest issues; they’re the biggest part of the market and make up most of the Federal Reserve’s daily asset purchases, which are being scaled back.
Short positioning increased on a relative basis as a result, “which may also have crowded demand to borrow particular issues over others,” the analysts wrote.
Those forces together could contribute to an increase in market dislocations.
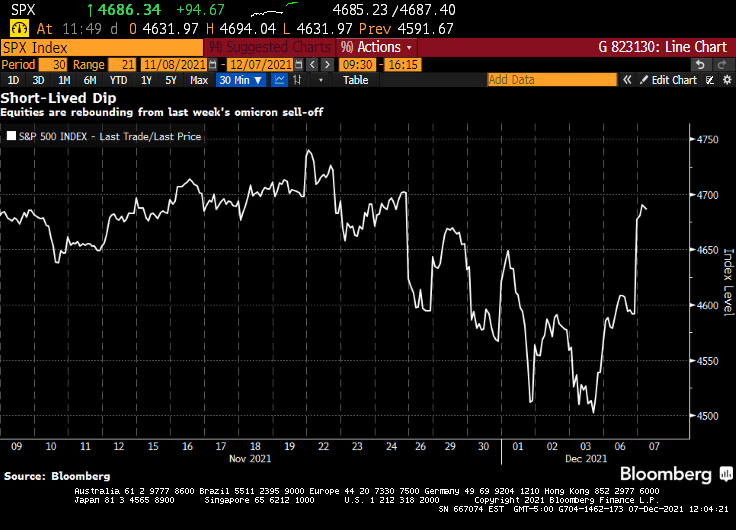
Jerome Powell’s hawkish pivot shocked financial markets. A week later, stocks are higher. The S&P 500 staged its biggest rally since March to wipe out losses from the past week. The speculative fringe that was a smoldering wreck Friday was soaring Tuesday. An index of meme stocks rallied more than 4%, while one composed of airlines added 1.6%. A gauge of newly public companies advanced more than 4%, SPACs jumped more than 2% and even cryptocurrencies rallied, with Bitcoin powering back above $51,000.
It’s a stunning about-face for risk assets that went into a tail spin after the Federal Reserve chair suggested he favored accelerating the removal of monetary support. What follows are takes from market-watchers on why the market is looking past the Fed’s potential change in policy.
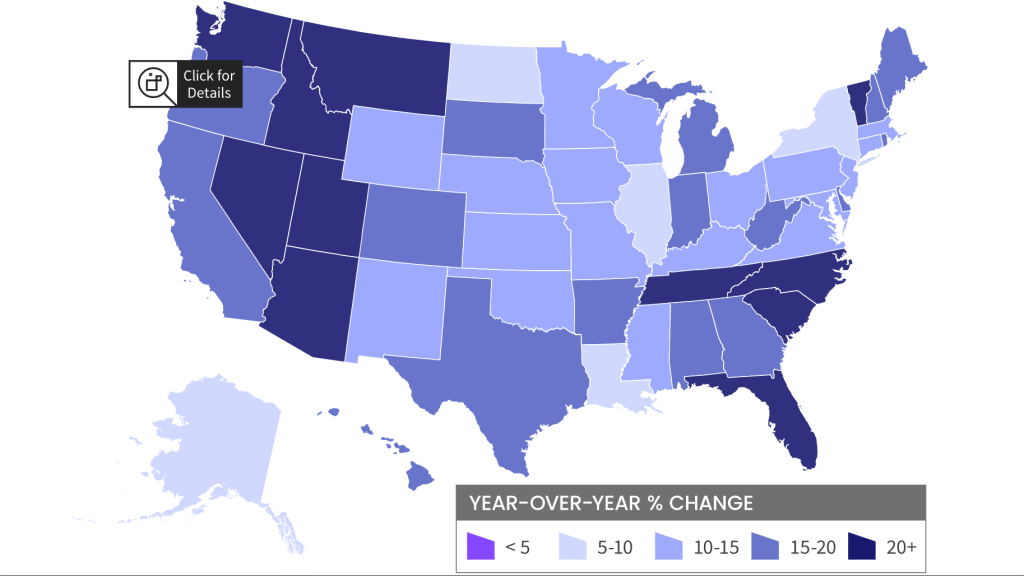
National home prices increased 18% year over year in October 2021, according to the latest CoreLogic Home Price Index (HPI®) Report . The October 2021 HPI gain was up from the October 2020 gain of 7.4% and was the highest 12-month growth in the U.S. index since the series began in 1976. The increase in home prices was fueled by low mortgage rates, low for-sale supply and an influx in homebuying activity from investors. Projected increases in for-sale supply and moderation in demand as prices grow out of reach for some buyers could slow home price gains over the next 12 months.
The non-California west (Arizona, Idaho, Utah, Nevada) and Florida have the strongest price growth while Washington DC has the slowest growth YoY.
Other “escape to” states like Vermont, Tennessee, North and South Carolina are also showing 20%+ rates of growth while the “escape from” states of Illinois, Louisiana, New York, and North Dakota are showing low growth as in 5-10% YoY.


You must be logged in to post a comment.