Since Q2 2020, US homeowners have been big winners in terms of home price gains and equity in their homes. Unfortunately, this means that renters are big losers. Once again, The Federal Reserve is benefiting once segment of the population while punishing the other segment.
*Homeownership mortgage source: 2016 American Community Survey.
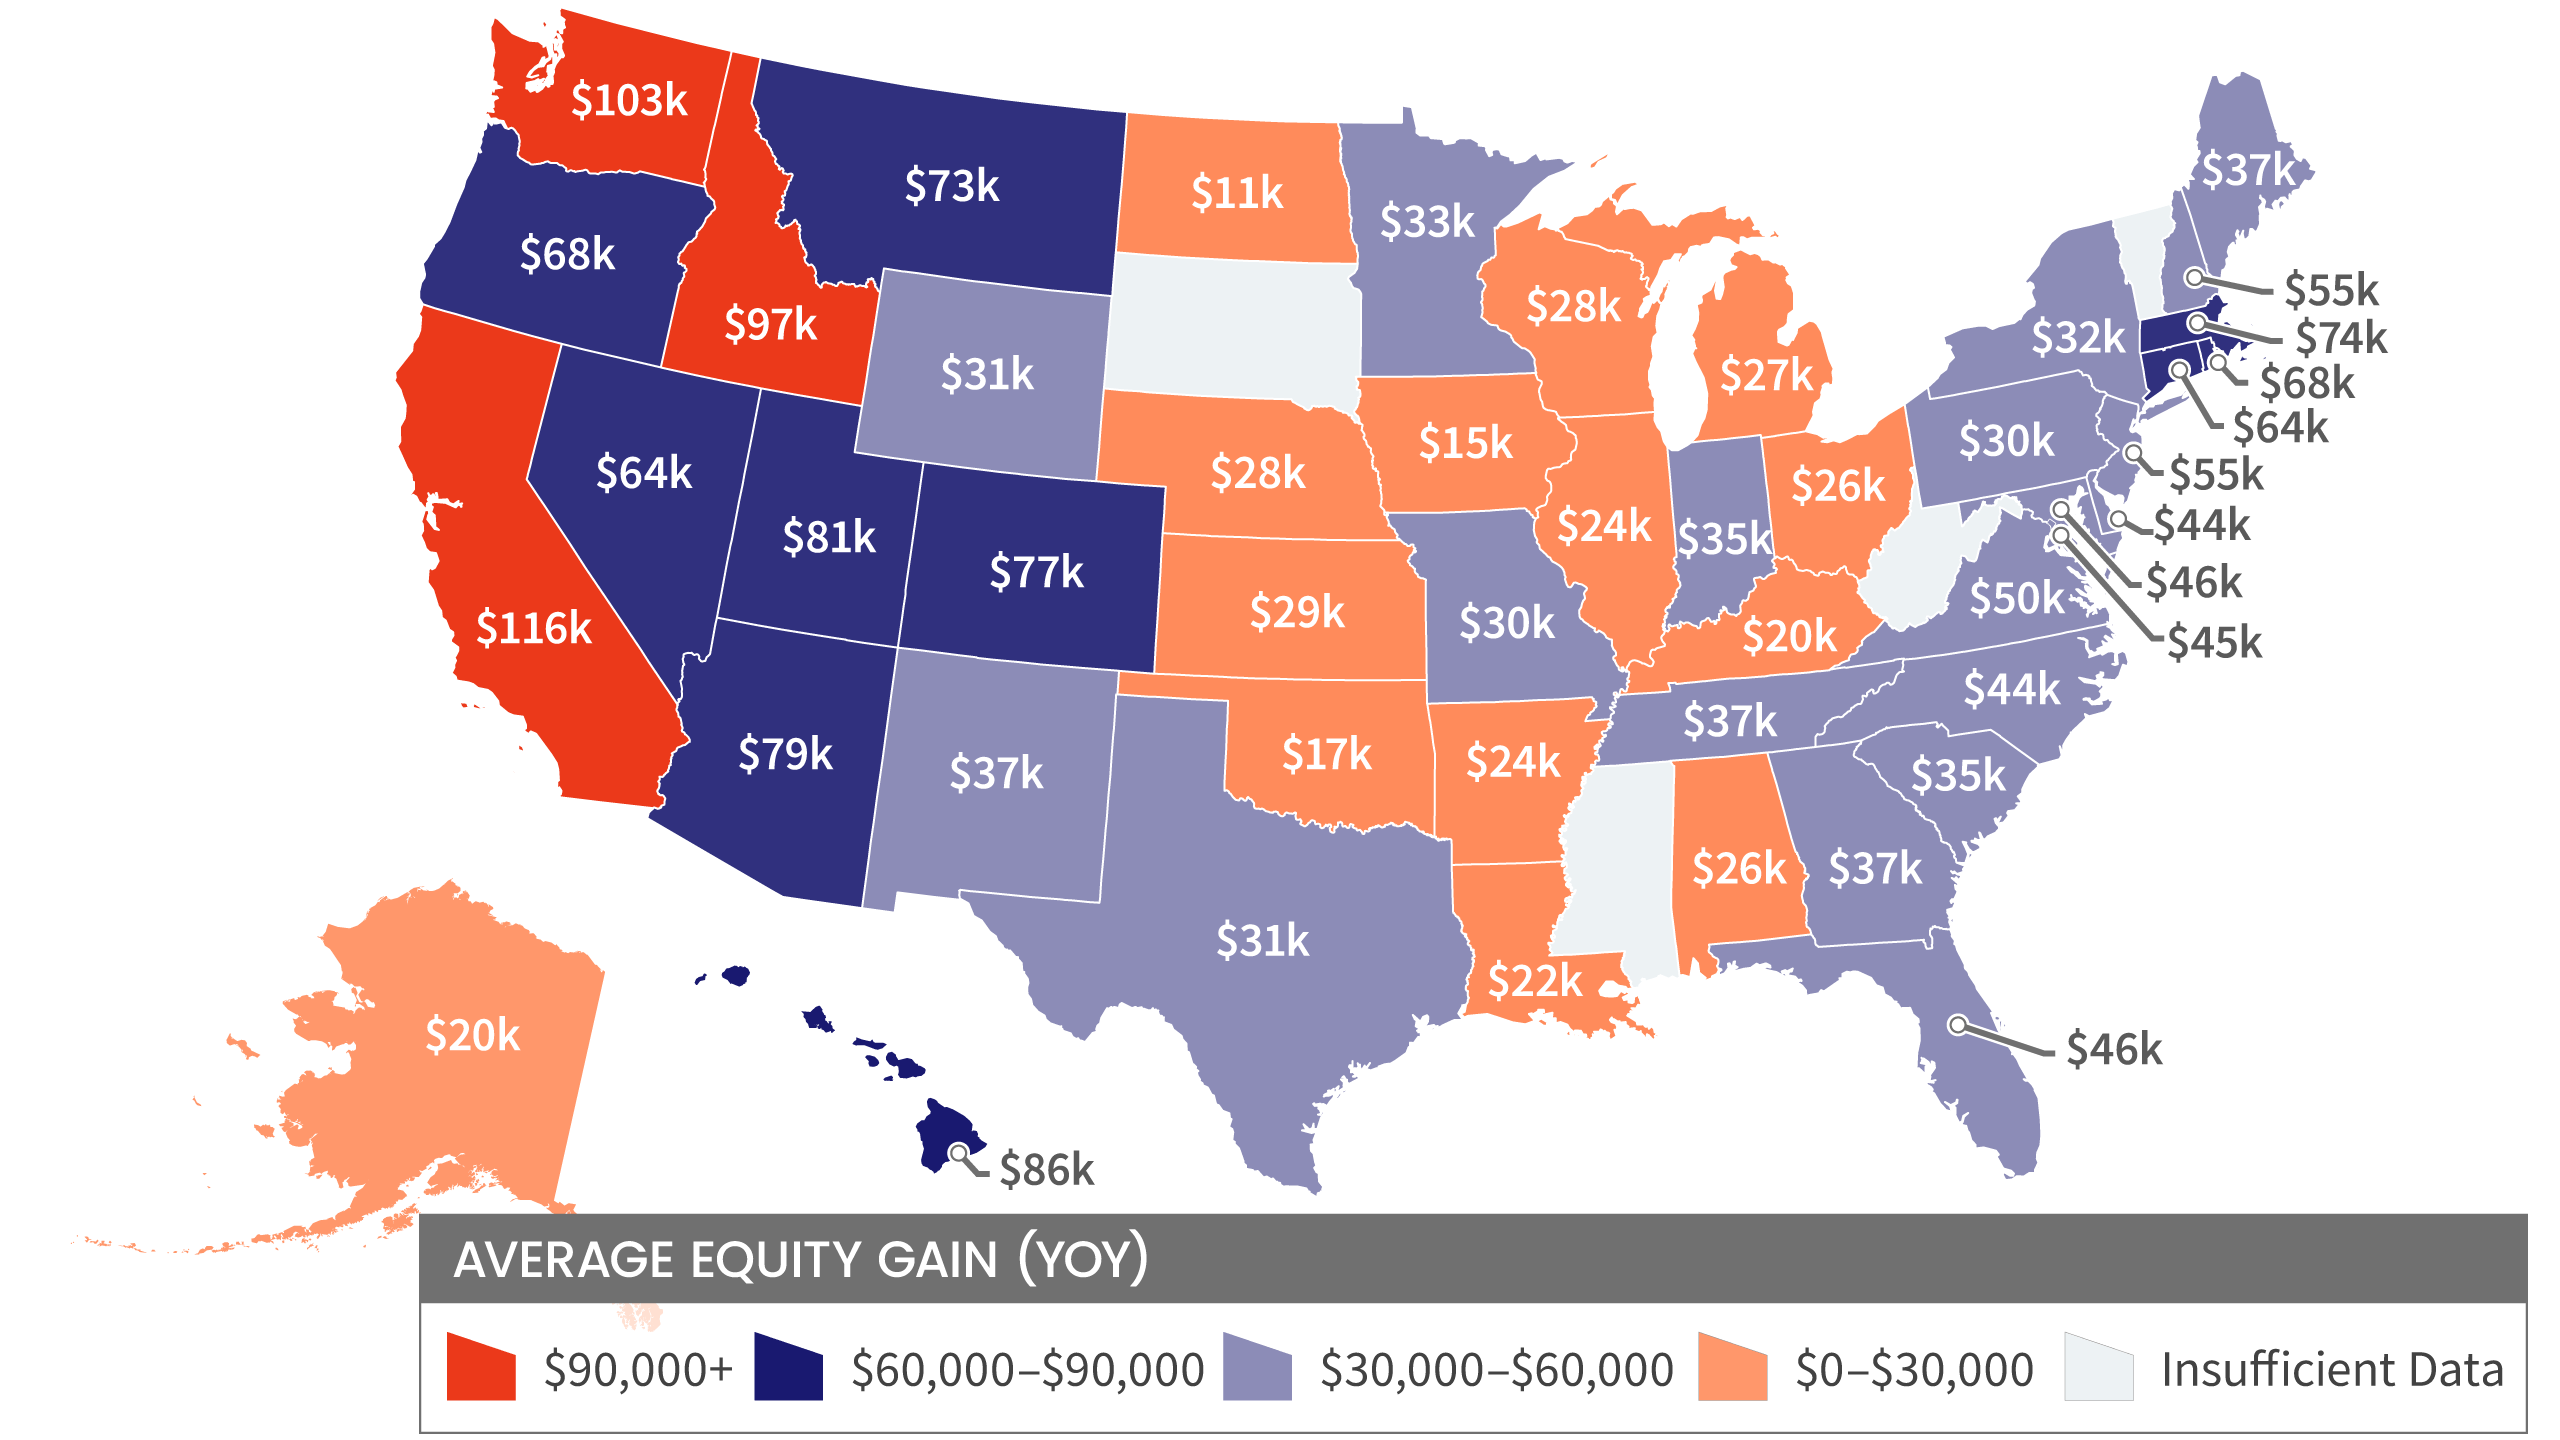
National Homeowner Equity
In the second quarter of 2021, the average homeowner gained approximately $51,500 in equity during the past year.
California, Washington, and Idaho experienced the largest average equity gains at $116,300, $102,900 and $97,000 respectively. Meanwhile, North Dakota experienced the lowest average equity gain in the second quarter of 2021 at $10,600.
10 Select Metros Change
CoreLogic provides homeowner equity data at the metropolitan level, in this graphic 10 of the largest cities, by housing stock are depicted.
Negative equity has seen a recent decrease across the country. San Francisco-Redwood City-South San Francisco, CA, is the least challenged, with Negative Equity Share of all mortgages at 0.6%.
Loan-to-Value Ratio (LTV)
The graph represents National Homeowner Equity Distribution across multiple LTV Segments.
Since growing home equity lead to lower default risk (or at least losses to the mortgage holder), we are seeing mortgage delinquencies fall after the Covid surge.
Building materials copper and PVC (pipes) both surged with The Fed’s Cat 5 hurricane approach to liquidity. Then copper backed-off, but PVC rose when Hurricane IDA struck the gulf coast.
The Fed will announcing their plans (maybe) at 2pm today.
What would it take to knock the U.S. recovery off course and send Federal Reserve policy makers back to the drawing board? Not much — and there are plenty of candidates to deliver the blow.
From one direction: U.S. debt-ceiling deadlock, China property slump or simply an extension of Covid caution could hit growth and jobs — taking the Fed’s proposed taper of bond purchases off autopilot, and pushing its first interest-rate increase back to 2024 or later. From the other: Sustained supply-chain snarl-ups could keep inflation stubbornly high and unmoor inflation expectations — forcing an acceleration of the taper, and an early rate liftoff in 2022.
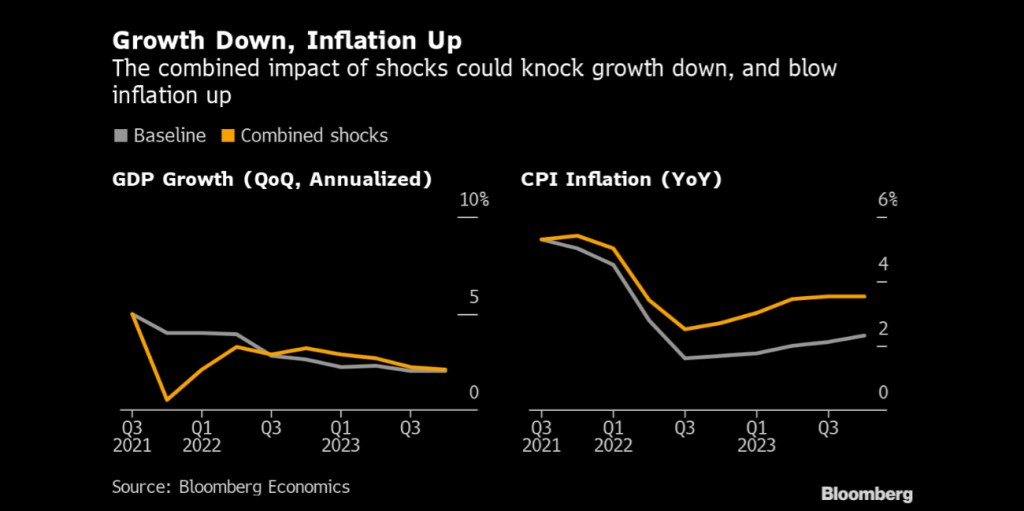
And if shocks arrive from both directions at once, the upshot could be a combination of weak growth and rapidly rising prices — not as severe as the stagflation of the 1970s — but still leaving Fed Chair Jerome Powell and his colleagues with no easy answers.
In the following, we use Bloomberg Economics’ new modeling tool SHOK to explore these scenarios. None of them represents our base case. At a moment of elevated uncertainty, it makes sense to pay more attention to the risks.
Is the U.S. Economy Headed for a Slowdown? Signs of a slowdown in the U.S. economy aren’t hard to find.
August payrolls — just 235,000 new jobs, one-third of the expected number — were a red flag. The delta variant has made consumers cautious again. The University of Michigan’s index of sentiment plunged in August; only six declines since the modern index was launched in 1978 have been bigger.
Add all these pieces together, and a recovery that looked unstoppable just a few weeks ago now appears to be losing steam. At Bloomberg Economics, we have cut our prediction for annualized third-quarter growth to 5%, from above 7% at the start of the quarter. Others have gone lower, with forecasters at some of the big banks anticipating growth closer to 3%. Even if delta subsides, it’s not hard to imagine scenarios where the slide continues.
One of them involves the partisan impasse over raising the U.S. debt ceiling. The U.S. government is expected to reach the limits of its debt-servicing capacity in October. Default, a potentially catastrophic event for the global financial system, still appears an outside possibility. But even without one, recent history shows that dancing around the possibility — triggering a persistent risk-off period in the markets — can have serious consequences. Separately, a government shutdown starting Oct. 1 would hardly be helpful when the recovery is already struggling to find its footing.
In the three weeks around the 2011 debt-ceiling standoff, the S&P 500 index plummeted more than 15% and corporate borrowing costs spiked. Using SHOK we estimate that a repeat performance would shave about 1.5 percentage points off annualized fourth-quarter growth — and ensure a rocky start to 2022.
Global Risks to the Fed’s Plan Not all the risks originate so close to home.
Fears of a China housing crash have long haunted global markets. Now, President Xi Jinping’s “common prosperity” agenda has turned that into a real possibility.
Regulators are cracking down on abuses that inflated property values, and tight controls on lending have helped push prices and new construction sharply down. That’s left Evergrande, one of the nation’s biggest developers, on the cusp of a default. The consequences of a wider slump could be severe, because real estate drives demand for everything from steel and concrete to furniture and home electronics — contributing as much as 29% of China’s GDP, all told.
It wouldn’t take a sub-prime style meltdown to send shockwaves around the world and move the dial for the U.S. China’s economy is currently forecast to enter 2022 with growth at around 5%. A property slump could take that down to 3%, triggering a blow to trade partners, a drop in oil and metal prices, and a risk-off moment in global markets. In that scenario, the U.S. would limp into 2022 with the recovery marked down and inflation back below the 2% target.
When Is Jerome Powell Likely to Raise Rates? Powell has set out the FOMC’s criteria for rates liftoff: maximum employment, and inflation that hits and is set to exceed the 2% target for some time. A blow to employment and demand from a debt-ceiling standoff or China shock might mean those criteria are not met. Rate hikes could be kicked into the long grass, with expectations moving from 2023 out to 2024 or beyond. The test for tapering is less stringent, and a start at the end of this year appears close to baked in. Even so, if the recovery stumbles the Fed might have to make a course correction, introducing discretion into a process that markets expect to run on autopilot.
In 2015, the stock-market and currency slump in China — and the sustained shift to global risk-off sentiment that triggered — was enough to delay the start and slow the pace of the U.S. tightening cycle. In 2021, the Fed might not have that luxury.
China’s residential property slowdown deepened last month, signaling that regulatory tightening and an escalating crisis at the country’s most indebted developer are hurting buyer sentiment.
Supply-chain breakdowns — from port closures to shortages of semiconductors and lumber — have been one of the main factors pushing U.S. inflation above 5% this summer. That’s enabled Powell to label the price jumps as “transitory” and soothe fears of an upward spiral. The lower CPI reading for August provides some support for that thesis.
It wouldn’t take much, though, for further supply shocks to keep inflation uncomfortably high. From home electronics to textiles, American consumers load their shopping carts with goods that are made in Asia and delivered via supply chains that crisscross the continent. When the inflation rate for used cars in the U.S. hit 45% this year, driven by semiconductor shortages that threw assembly lines into disarray, it illustrated what can happen when those fragile linkages break down.
All of this adds to the risk of further “transitory” shocks to inflation. One early-warning signal: according to press reports, semiconductor giant TSMC has announced plans for price hikes of as much as 20% next year.
The effects of pandemic-induced supply-chain disruptions are still rippling through businesses and households, reflected in higher prices for goods, delays in receiving them and flat-out shortages.
For the Fed, inflation running hot into 2022 would be troubling on its own, and worse if it triggers a shift in inflationary psychology. If businesses start to feel comfortable setting prices higher, and workers start demanding higher wages to compensate, the risk is a situation reminiscent of the wage-price spirals of the 1970s — when it took a recession engineered by the Volcker Fed to squeeze inflation expectations out of the system.
Unmoored inflation expectations would very likely trigger an early and aggressive response from the Fed: an accelerated taper, and a rate hike in 2022.
A no-win scenario would be if the two blows — to output and jobs, and to supply chains and prices — landed at the same time, leaving Fed officials in a quandary. Ease policy to support growth and they would add fuel to the inflationary fire. Tighten to bring prices under control, and they would exacerbate the drag on the recovery, throwing more Americans out of work.
Agreement in Congress, or decision by the Democrats to go it alone, could remove the default risk. China has in the past proved skillful at shifting gears to avoid a housing crash. Vaccination rates in Asia are rising. The latest U.S. data — inflation slowed and retail sales rose — have been encouraging.
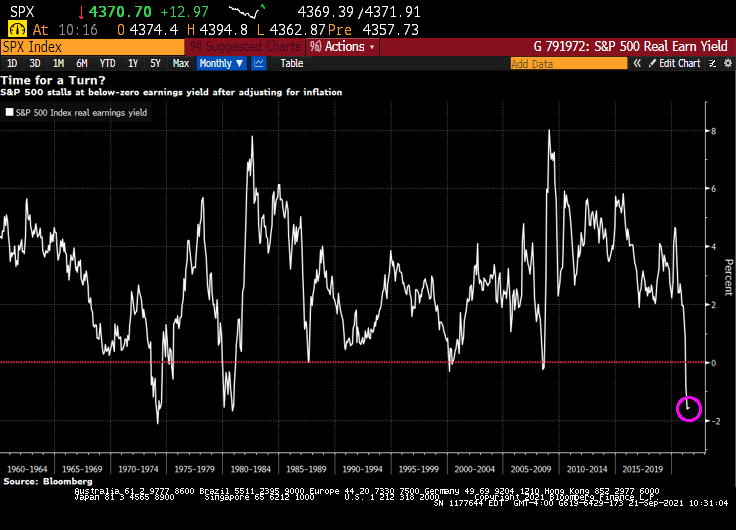
The stock market mildly rebounded from yesterday’s mild correction, but a glaring problem remains: S&P 500 real earning yields are negative.
With all the Federal government fiscal stimulus and Federal Reserve monetary stimulus, we are seeing inflation and that inflation is eating away at S&P 500 earnings yield.
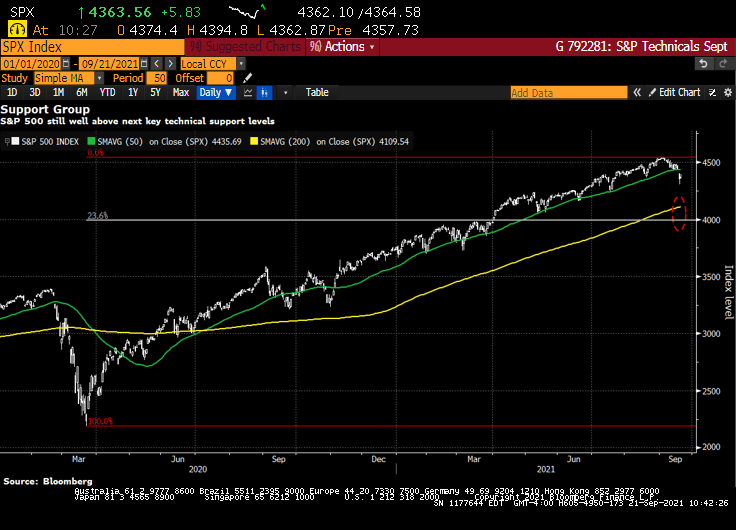
The S&P 500 is still well above key technical support levels.
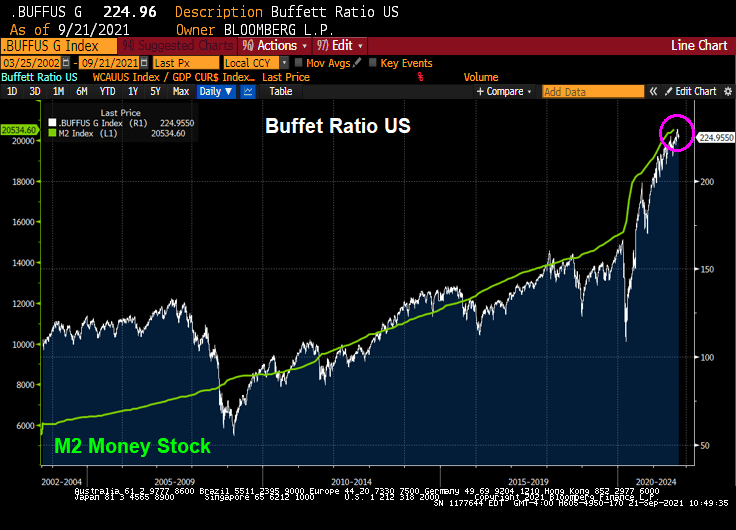
However, the Buffet ratio is raging along with Fed stimulus.
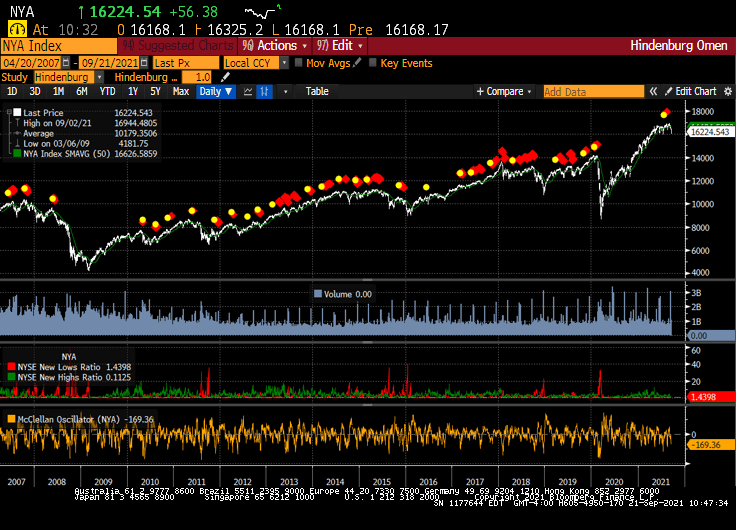
And the Hindenburg Omen is flashing RED!
The mystery of the Flying Fed is whether they will withdraw their massive monetary stimulus or not.
The next Federal Reserve Open Market Committee (FOMC) meeting is next week with an announcement on Wednesday, September 22nd.
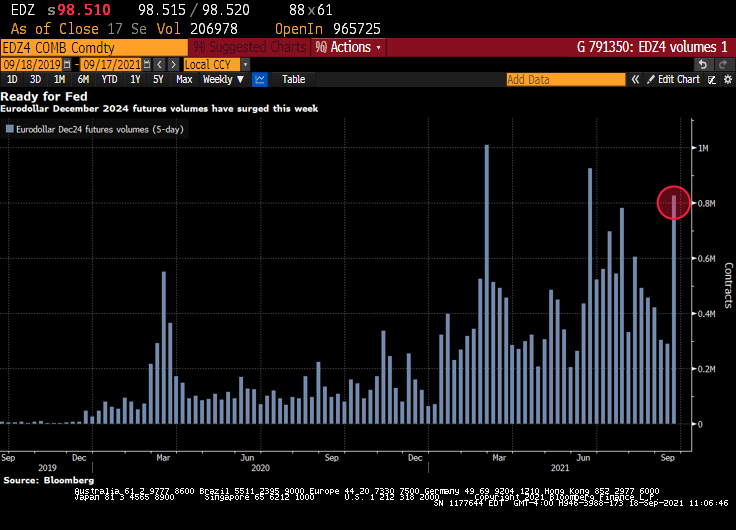
(Bloomberg) — Volume in the December 2024 eurodollar futures contract has surged Friday, approaching 200k, highest in the strip. Weekly volume exceeds 800k ahead of next week’s FOMC meeting. The December 2024 contract is a proxy for the Fed’s taper timeline, similar to the belly of the Treasuries curve (aka, the belly of the beast).
As of 2:30pm ET, nearly 197k Dec24 eurodollar contracts had traded, bringing weekly total to 816k, third most in its lifetime; notable flows on the day have included three block trades for 5k each:
The contract also appeared in curve trades including 9.3k Sep24/Dec24 3-month, 18.9k Dec23/Dec24 12-month and 24.8k Dec22/Dec24 24-month
The Dec22/Dec24 eurodollar spread has been in the spotlight since Morgan Stanley recommended the steepener in June as a way to exploit the disconnect between expectations for the pace and timing of Fed rate increases
As of today, we see a kink in the US Dollar Swaps curve at 21m.
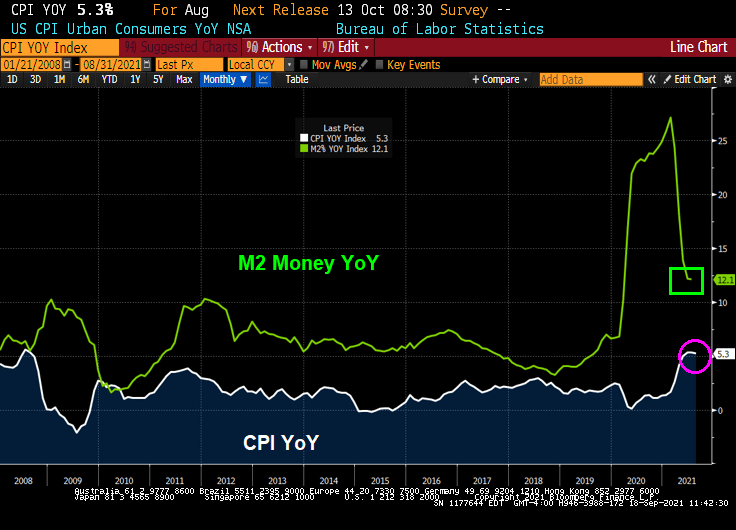
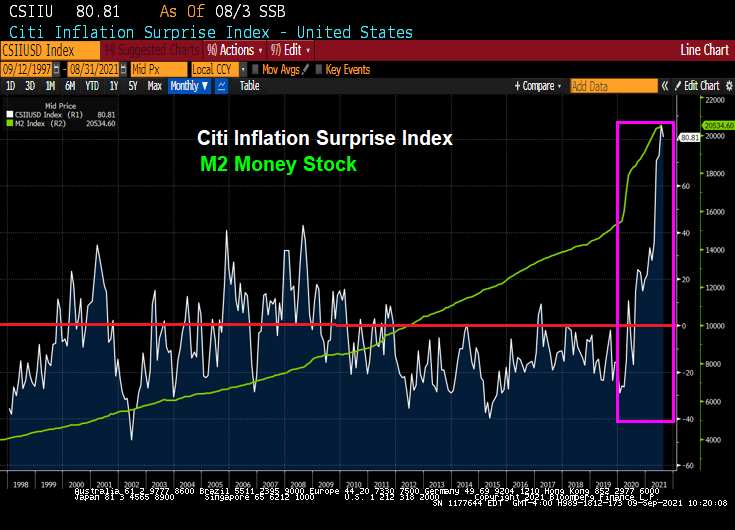
With inflation the highest since 2008, and M2 Money still growing at 12.1% YoY, it is time for The Fed to take it foot off the accelerator pedal.
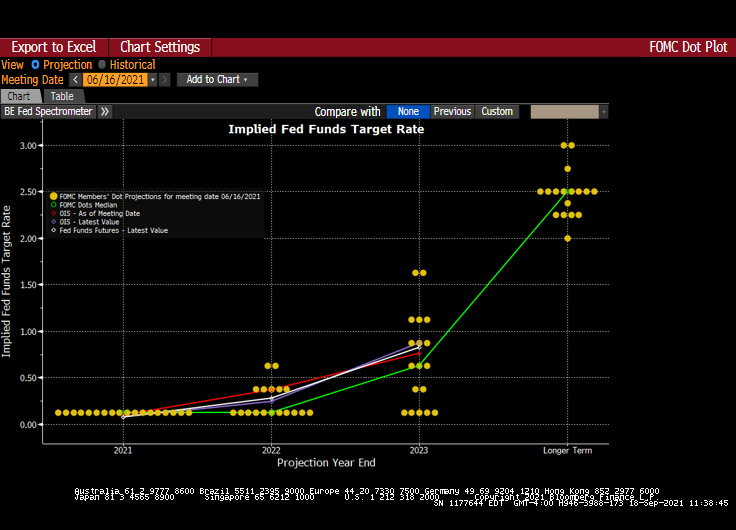
The Fed’s Dots Plot as of the last FOMC meeting indicates a willingness to let the Fed Funds Target rate start rising again after over a decade of rate suppression.
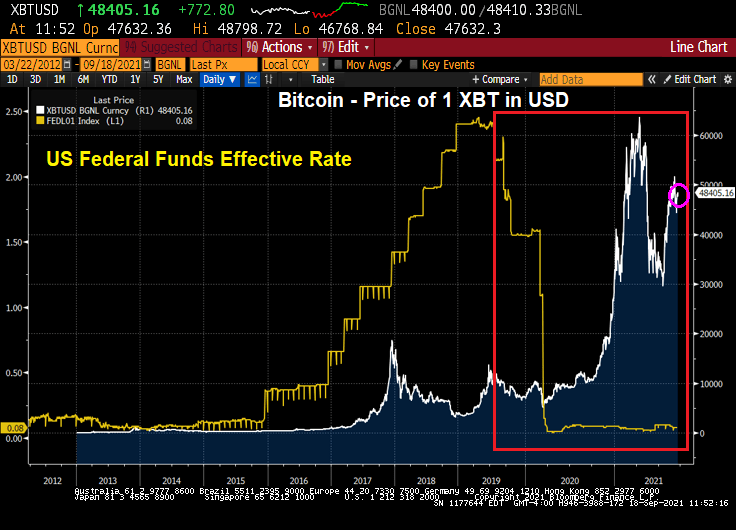
Given the fear of The Fed tapering (eventually), is it any wonders alternative investments such as Bitcoin have risen as The Fed cut rates?
According to Bloomberg, Chinese authorities told major lenders to China Evergrande Group not to expect interest payments due next week on bank loans, which takes the cash-strapped developer a step closer the nation’s largest modern-day restructurings, and guarantees that China’s “Lehman Moment” is now just a matter of days, if not hours.
According to Bloomberg, citing unnamed sources, the Ministry of Housing and Urban-Rural Development told banks in a meeting this week that Evergrande won’t be able to pay its debt obligations due on Sept. 20, and instead most of Evergrande’s working capital in now being used to resume construction on existing projects, the housing ministry told bankers, according to a Bloomberg source.
And since nonpayment of interest and principal will represent an event of default, the company is unlikely to make any subsequent interest, or principal, payments either since it will have already default even though Bloomberg claims that “Evergrande is still discussing the possibility of getting extensions and rolling over some loans.” It won’t, especially since the developer will also miss a principal payment on at least one loan next week, which means it’s game over.
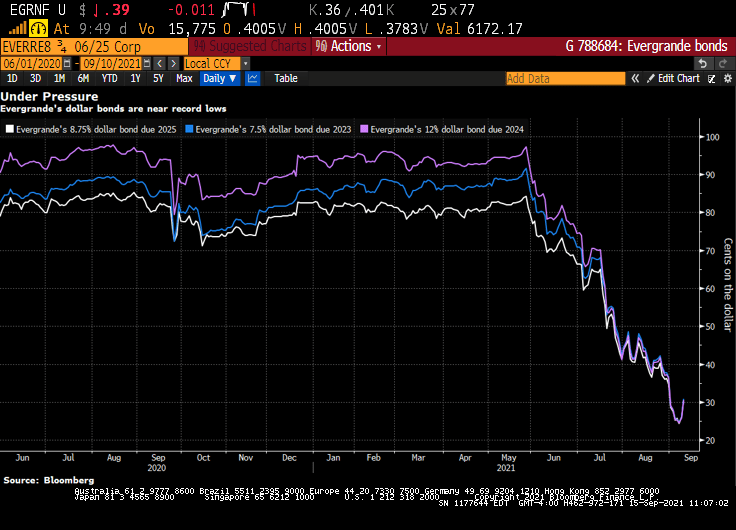
China Evergrande Group may undergo one of the country’s biggest-ever debt restructurings, if the developer’s distressed-level bond prices are any indication.
Singapore LLC, also predicts Evergrande may default and enter restructuring. That risk is being priced in, with many of Evergrande’s dollar bonds trading near 30 cents.
Debt delinquencies at developers the size of Evergrande are so rare in China that investors, analysts and regulators would only have a few case studies to go on. Kaisa Group Holdings Ltd. in 2015 became the first Chinese builder to default on dollar bonds. The restructuring of another, China Fortune Land Development Co., is currently under negotiation.
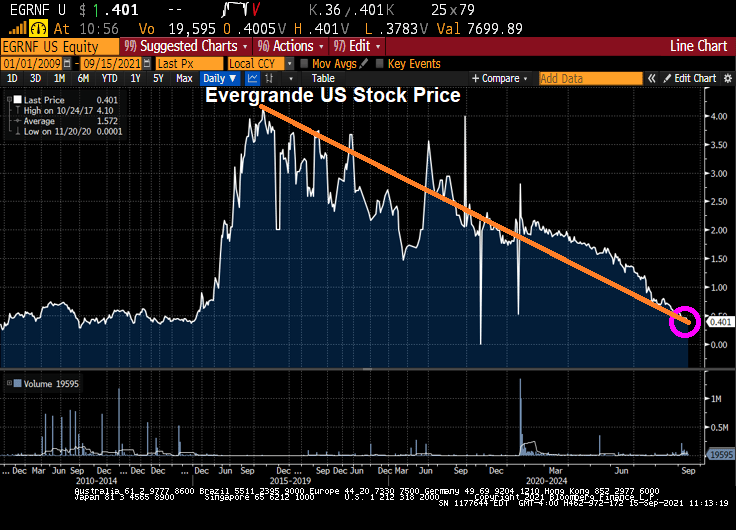
Do I detect a trend in Evergrande’s US stock price?
Update: China has a variation of the Wuhan Flu and it is spreading throughout other Chinese property developers after Evergrande’s main unit (onshore real estate) said that trading in all of its onshore bonds would be suspended on Sept 16 to ensure fair information disclosure following a downgrade to A from AA (which in China is viewed as the lowest investment grade rating) by China Chengxin International.
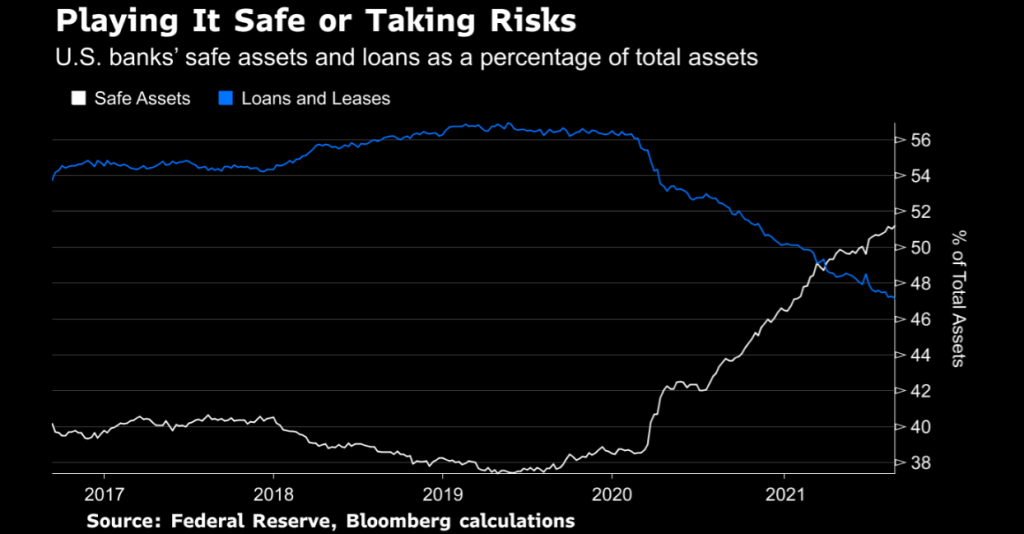
US bank loans and leases are slowing, yet The Federal Reserve has helped keep their stock values elevated thanks to the extraordinary monetary stimulus.
(Bloomberg) — U.S. banks’ loans and leases dropped to 47.15% of total assets in the week to Sept. 1 from 47.24% the week before, according to the Fed
Total assets increased to $22.19 trillion from $22.10 trillion
The share of safe assets — virtually riskless investments such as cash, Treasuries, and securities effectively guaranteed by the U.S. government — increased to 51.2% of total assets from 51.0%
Loans and leases as a percentage of deposits were unchanged at 59.7% Cash was the highest as a percentage of total assets since January 2015 Residential real-estate loans hit a historic low as a percentage of total assets at 10.0% Commercial real-estate loans were the lowest as a percentage of total assets since August 2015 Consumer loans were the lowest as a percentage of total assets since May Commercial and industrial loans were the lowest as a percentage of total assets since June 2012
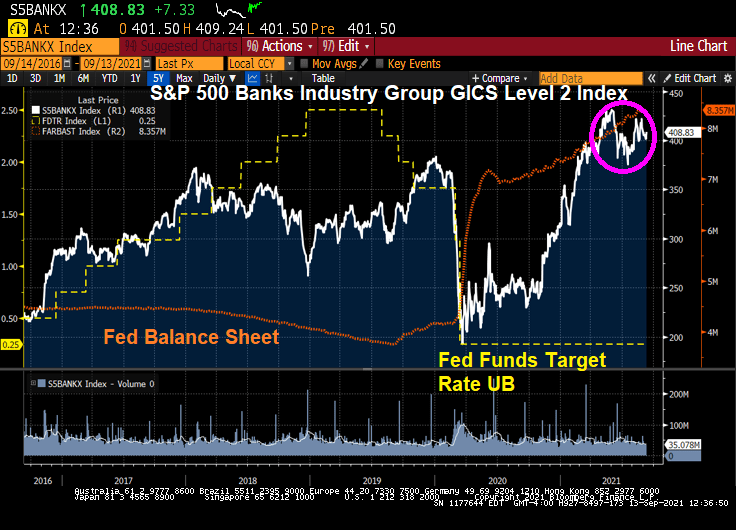
Only in this deranged, hyper-stimulated market can bank stocks be soaring despite slowing loan and lease growth.
Covid struck in early 2020 and The Fed spiked the punchbowl with a massive surge in M2 Money. Like a storm surge.
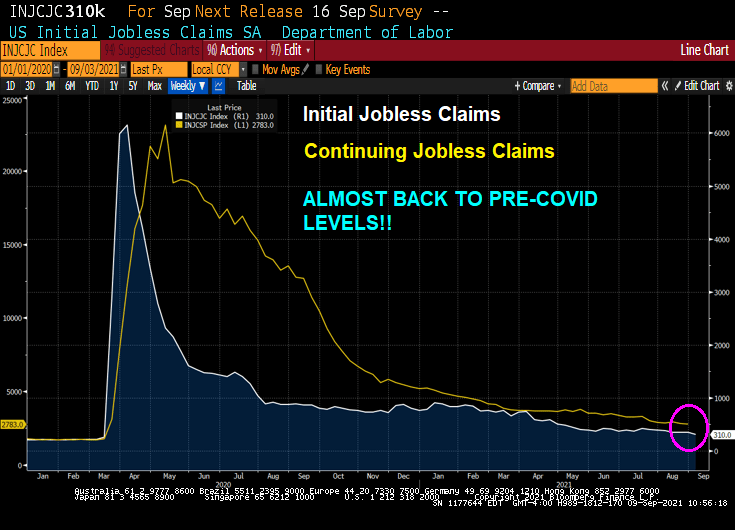
Today’s unemployment report showed initial jobless claims and continuing jobless claims ALMOST at pre-Covid levels.
So it appears that The Fed’s job is done (under the assumption that The Fed had anything to do with the recovery).
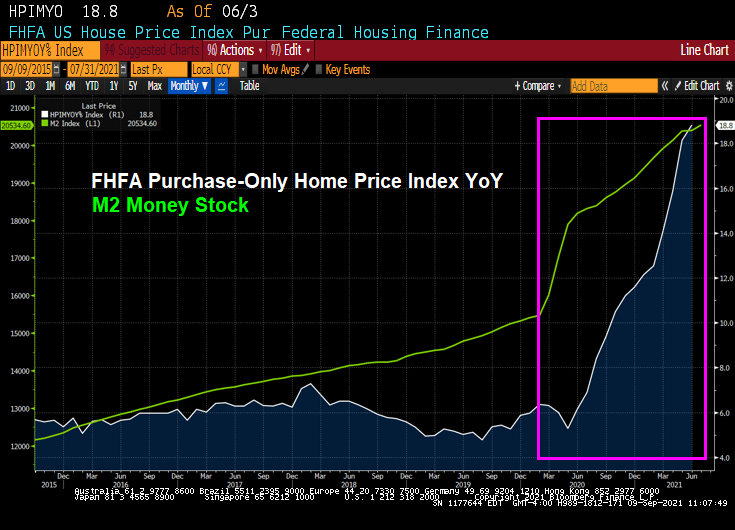
So did The Fed almost violently overreact to the Covid crisis? The Atlanta Fed’s Raphael Bostic says it is too early to withdraw while St Louis Fed’s James “Bully” Bullard says it is time to taper.
Really Raph? 18.8% price growth is not enough for you?
Since the original model of The Federal Reserve was to purchase Treasuries and Agency MBS in an effort to push down interest rates, it will be quite difficult to delink the two: taper the balance sheet while not raising short-term rates.
(Bloomberg) — Bond investors may not wait long to start pushing back against Federal Reserve Chair Jerome Powell’s efforts to delink the start of asset-purchase tapering from the countdown to eventual policy-rate hikes.
Since Powell last week said the central bank could begin reducing its monthly bond buying this year, traders have stuck with early 2023 as the likely timing for the Fed’s liftoff from zero interest rates, and Treasury yields have barely budged.
But that calm faces a test starting Friday. The potential for volatility comes from the fact that when Fed officials gather this month, they will release fresh projections for the fed funds rate for the next few years. And with the labor market pivotal for Fed policy now, Friday’s August jobs report is seen as laying the foundation for these forecasts — collectively known as the dot plot — especially as some Fed officials have already been pushing for an early taper.
The upshot is that a robust reading Friday could have investors pulling forward tightening bets regardless of Powell’s efforts last week in his virtual speech at the Fed’s Jackson Hole symposium. The risk is traders will prepare for a repeat of June, when a hawkish signal via the dot-plot took markets by surprise and triggered an abrupt unwinding of wagers on a steeper yield curve.
If the employment report is “even deemed acceptable, regional presidents will be back on the tape in a flash,” sounding hawkish again, said Jim Vogel, an analyst at FHN Financial. “And you may have more officials penciling in a 2022 hike. And that would have to flatten the yield curve.”
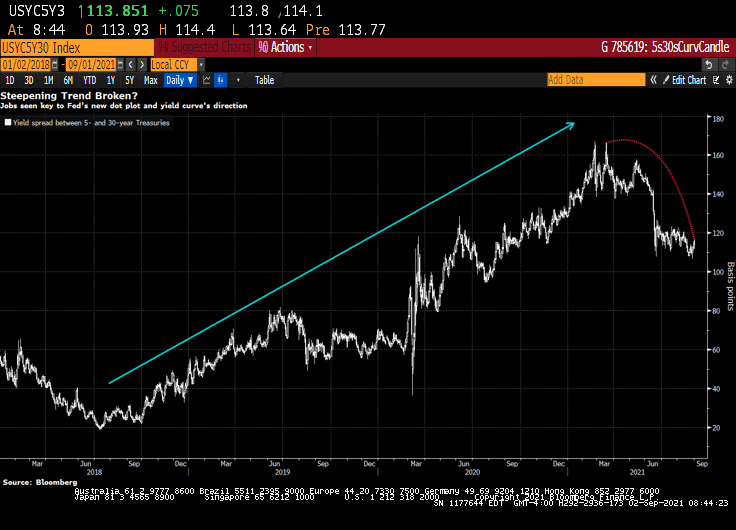
Expectations for a hawkish shift would lift 5-year Treasury yields in particular, shrinking the gap with 30-year rates, Vogel said. That spread was around 114 basis points Wednesday, down from about 140 just before the Fed met in mid-June.
Dots Math
Officials’ June quarterly forecasts not only showed a median funds rate projection of two hikes in 2023 — after the March dot plot indicated no tightening until at least 2024 — but that seven participants saw at least one increase next year. This time around, it will take just three officials to raise their dots for 2022 for a full hike to be the new median for next year, assuming everyone else keeps their projections where they were.
Traders responded to the Fed’s June rate projections by driving 5-year yields up the most in almost four months. That was even as Powell said in his press conference that the dot plot should be taken with a “big grain of salt” and discussion about raising rates would be “highly premature.”
Powell last week said “the timing and pace of the coming reduction in asset purchases will not be intended to carry a direct signal regarding the timing of interest rate liftoff, for which we have articulated a different and substantially more stringent test.”
But the leadup to the Fed decision on Sept. 22 may culminate in a dot-plot unveiling that yet again presents a communication challenge for policy makers, as has been seen several times since the Fed introduced the projections in 2012.
“There’s information in the dots, and generally it’s good information,” said Shahid Ladha, head of Group-of-10 rates strategy for the Americas at BNP Paribas SA. It makes sense for the Fed, regarding tapering and rate hikes, “to try to separate them, but I don’t think they’ll be ultimately successful in separating them.”
Trouble Ahead
Even some Fed officials are wary of being able to disentangle the tapering from rate hikes, minutes from the July Fed meeting showed.
Kevin Flanagan, head of fixed-income strategy at WisdomTree Investments Inc., which runs exchange-traded funds with assets of $75 billion, sees trouble for the Fed.
His view is that the labor market will keep gaining ground in its rebound from the pandemic, and that the median September dot may show a hike in 2022. That bodes for higher yields, a flatter curve and makes floating-rate notes appealing, he said.
The median of economists’ projection is for a gain of 725,000 jobs in August, a slowdown from June and July but well above the average for 2021. Of course, with millions still out of work relative to pre-pandemic levels, the Fed may prove to take longer to lift rates than traders expect, especially given the central bank’s “broad and inclusive” maximum-employment goal. But the market may be about to challenge that approach.
Note: Yesterday’s ADP jobs gain was forecast to be 625k jobs added in August, but only 374k jobs were actually added.
Fed Faces ‘Ugly Fight’ Over Jobs Goal in Next Big Policy Debate
“We are going to be all of a sudden talking about rate hikes potentially next year, and that is where the focus of the bond market is going to go,” Flanagan said. “The dot plot will be the Fed’s initial message for its forward guidance on rates. And then it will begin to come from Fedspeak — which is when the rubber will really meet the road.”
And with the stock market, particularly technology stocks, rising with Fed asset purchases, I wonder if The Fed forecasts that assets prices will keep going if they withdraw the punch bowl?
Let’s see if Powell and The Gang can forecast the stock market if they taper the balance sheet and raise rates.


You must be logged in to post a comment.