Hello Hello! March US Consumer Prices Fall Most In 5 Years (Rent Inflation Back To Pre-Biden Levels)

Hello Hello pre-Biden inflation levels!

The normally crucial consumer price index measure of inflation printing today for March is likely to take a back seat to the next red flashing headline on tariffs on everyone’s Bloomberg terminal, but under the hood – with the Trump Put now exposed – can a cooler than expected CPI print raise the Powell Put strike enough to enable a true tradable bottom here?

Having dipped lower in the previous month (following a few straight months of re-acceleration), expectations were for both headline and core measures to continue trending lower on a YoY basis… and they were.

Headline CPI FELL 0.1% MoM (vs +0.1% exp), which dragged the YoY CPI to +2.4%, matching the September lows…

Source: Bloomberg

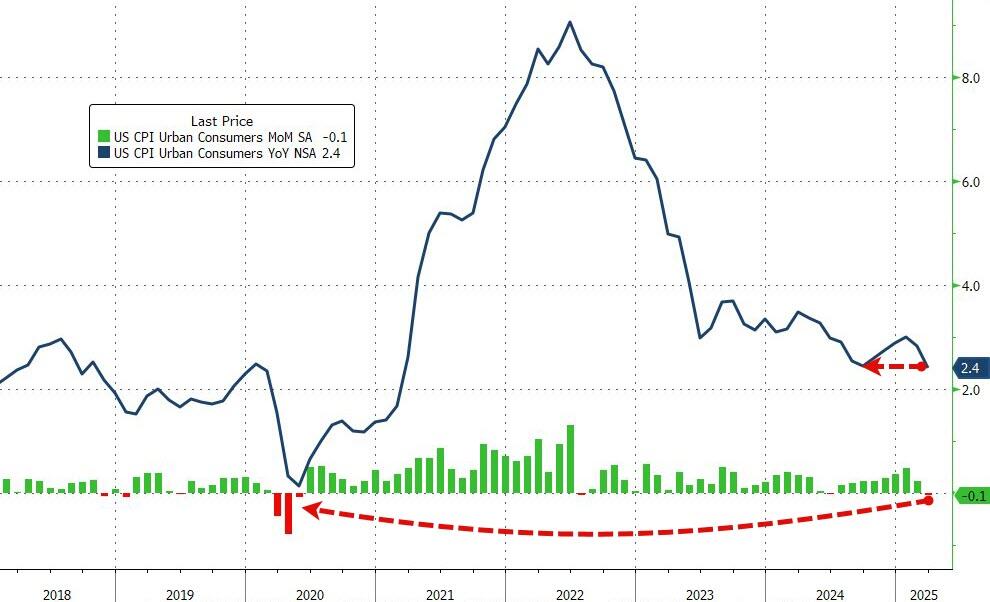
That is the weakest MoM print since May 2020.

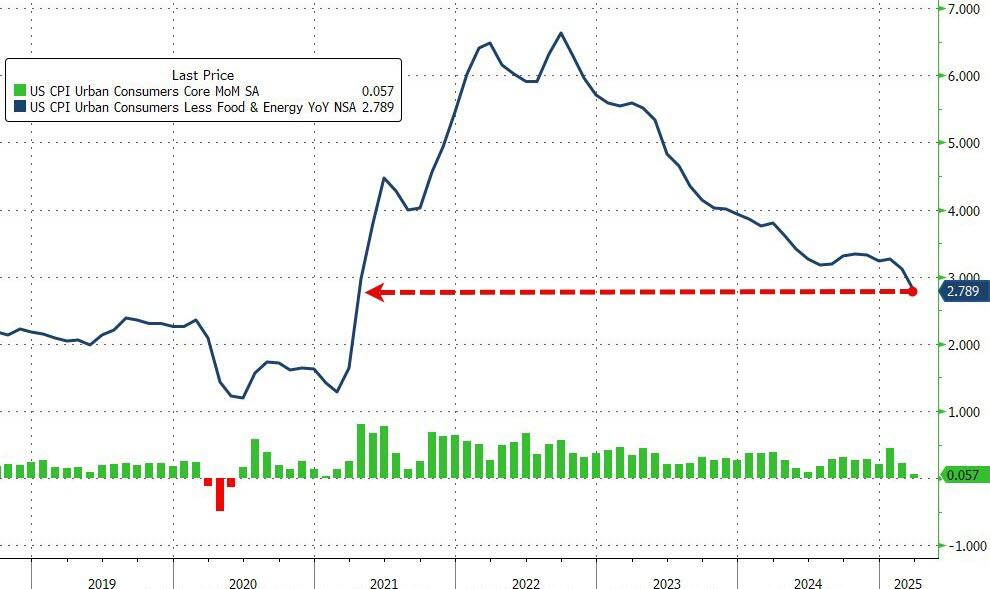
Core CPI also printed cooler than expected (+0.1% MoM vs +0.3% MoM exp), pulling the YoY print down t0 +2.8% YoY – the lowest since March 2021

Source: Bloomberg

Services inflation tumbled…
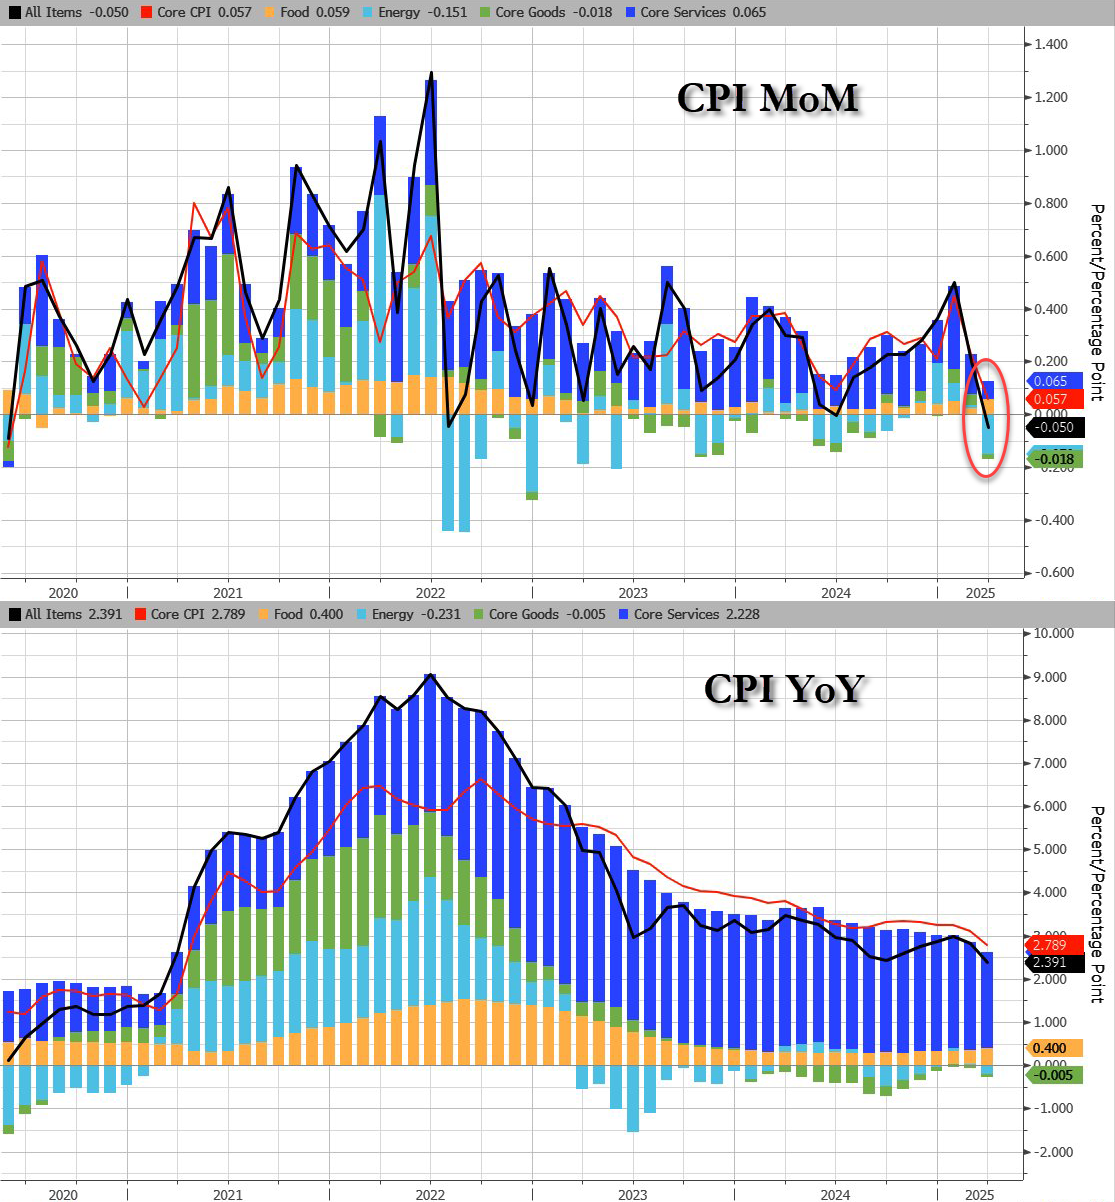
Source: Bloomberg

CPI breakdown:

Headline:

  • CPI decreased 0.1% after rising 0.2% in February, and below the +0.1% estimate. Over the last 12 months, CPI rose 2.4%, below the 2.5% estimate.
  • Energy CPI fell 2.4% in March, as a 6.3% decline in the index for gasoline more than offset increases in the indexes for electricity and natural gas.
  • Food CPI rose 0.4% in March as the food at home index increased 0.5% and the food away from home index rose 0.4 percent over the month.
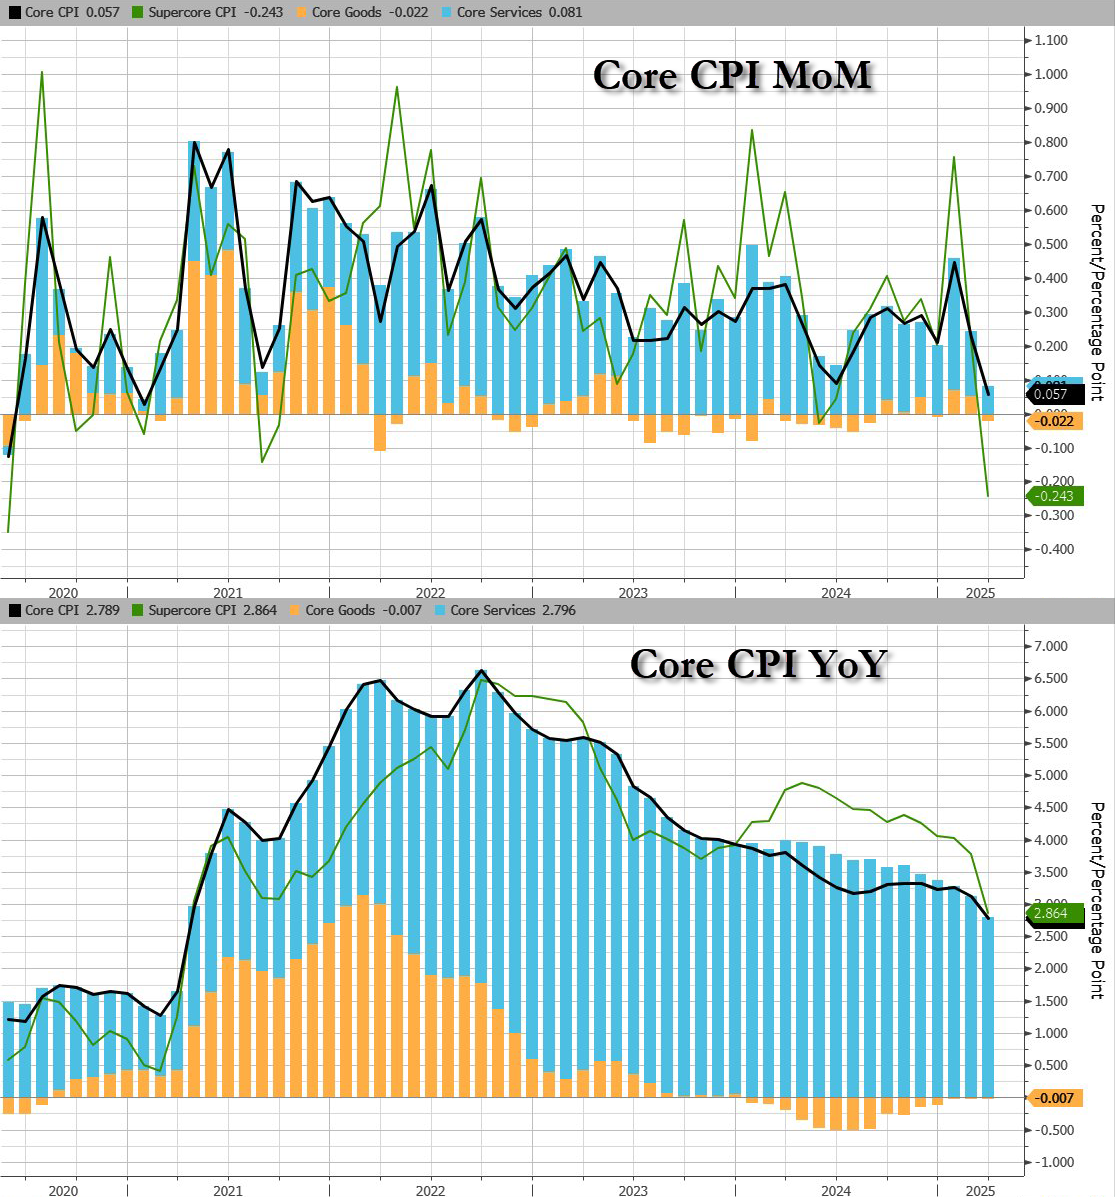
Core CPI:

  • The index for all items less food and energy rose 0.1% in March, following a 0.2% increase in February.
    • Indexes that increased over the month include personal care, medical care, education, apparel, and new vehicles.
    • The indexes for airline fares, motor vehicle insurance, used cars and trucks, and recreation were among the major indexes that decreased in March.

Core CPI details (MoM increase):

  • The shelter index increased 0.2% over the month.
    • The index for owners’ equivalent rent rose 0.% in March and the index for rent increased 0.3%.
    • The lodging away from home index fell 3.5 percent in March.
  • The personal care index rose 1.0%in March.
  • The index for education rose 0.4% over the month, as did the index for apparel.
  • The new vehicles index also increased over the month, rising 0.1%.
  • The index for airline fares fell 5.3% in March, after declining 4.0% in February.
  • The indexes for motor vehicle insurance, used cars and trucks, and recreation also fell over the month.
  • The household furnishings and operations index was unchanged in March.
  • The medical care index increased 0.2% over the month.
  • The index for hospital services increased 1.1% in March and the index for physicians’ services rose 0.3% over the month. In contrast, the prescription drugs index fell 2.0% in March.

Core CPI details (YoY increase):

  • The index for all items less food and energy rose 2.8 percent over the past 12 months.
  • The shelter index increased 4.0 percent over the last year, the smallest 12-month increase since November 2021.
  • Other indexes with notable increases over the last year include motor vehicle insurance (+7.5 percent), medical care (+2.6 percent), recreation (+1.9 percent), and education (+3.9 percent).

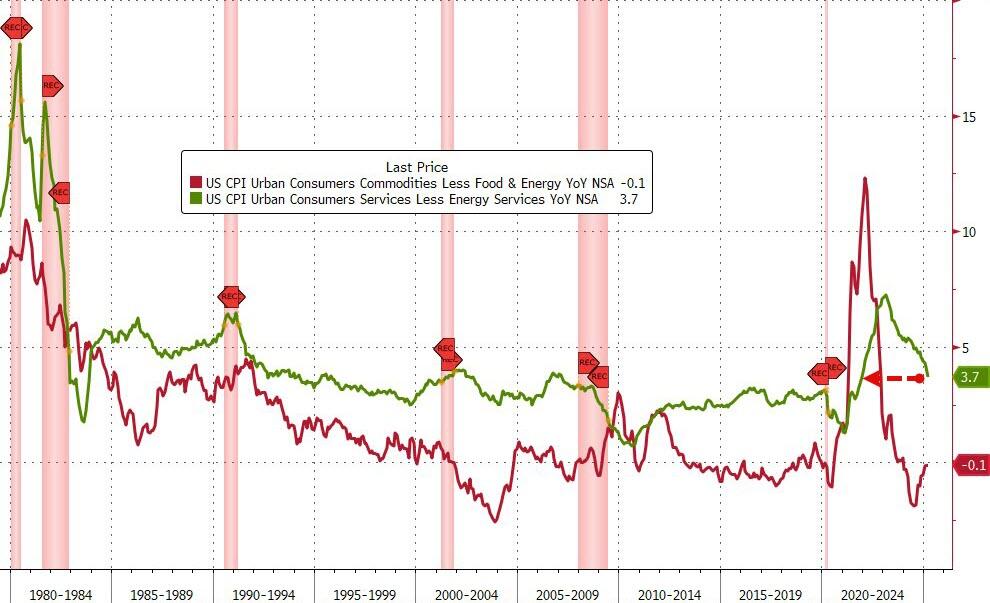
While goods inflation is flat (zero-ish), services cost inflation is fading fast…

Source: Bloomberg

Shelter and Rent inflation is slowing fast:

  • Shelter inflation +0.3% MoM, +3.99% YoY, down from 4.25% in February (lowest since Nov 2021)
  • Rent inflation +0.3% MoM, +3.99% YoY, down from 4.09% in February (lowest since Jan 2022)

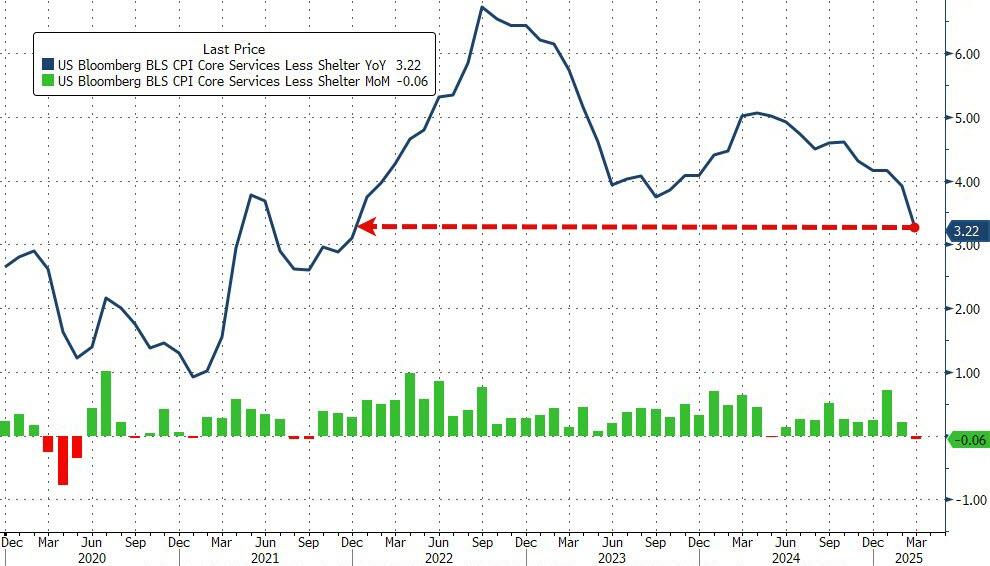
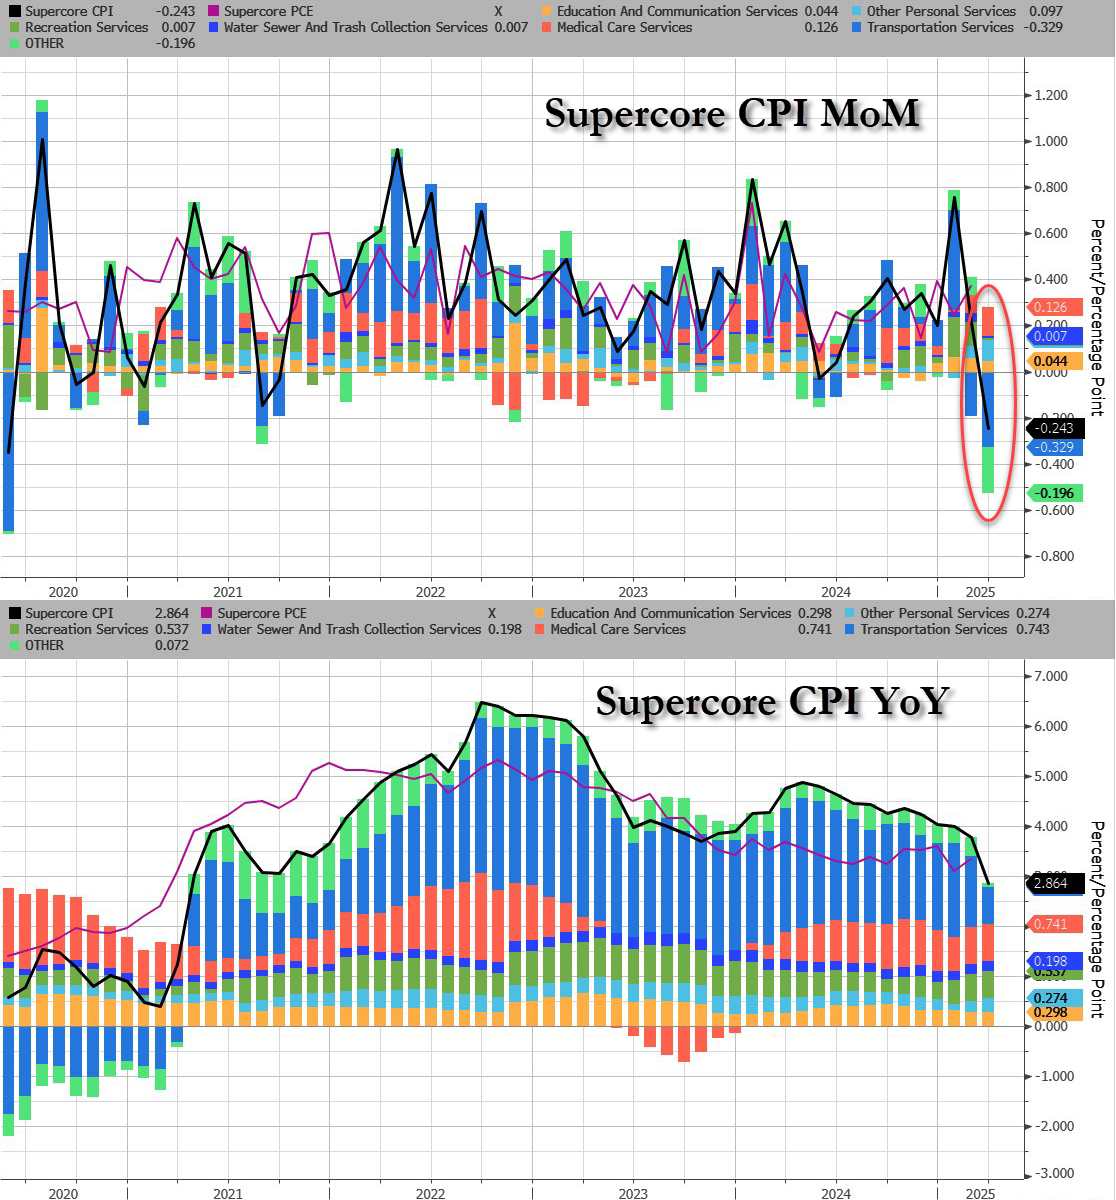
The so-called SuperCore CPI – Services Ex-Shelter – dropped 0.1% MoM dragging it down to +3.22% YoY – the lowest since Dec 2021…

Source: Bloomberg

Source: Bloomberg

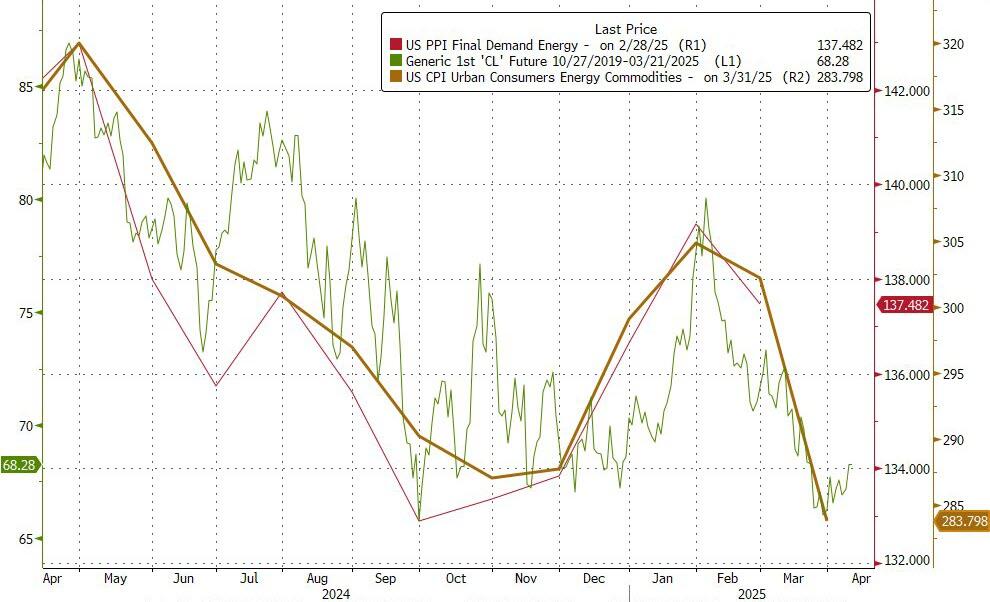
Drill Baby Drill (and tariffs recession fears) have dragged energy prices lower and pulled CPI lower with it…

Source: Bloomberg

Fear! Tariff Fears Are Spooking Markets (China Is Acting Childish)

Markets are ranked by fear about tariffs. Particularly since China is acting like a child.

Bond vs equity fear

Bond volatility has shot up higher, but remains “muted” compared to the VIX move.

Source: Refinitiv

FX vs equity fear

FX volatility has shot up higher as well, but is pale in comparison to the VIX move.

Source: Refinitiv

Credit “crunched”

Credit protection has surged during the “chaos”. Chart shows the US and the European versions.

Source: Refinitiv

Equity vs credit protection

VIX vs CDX IG.

Source: Refinitiv

Europe as well

V2X vs iTraxx main.

Source: Refinitiv

Correlation – the upside crash

Implied correlations showing a lot of “fear” as pretty much everything has been treated as if it were the “same” during the crash.

Source: Refinitiv

Massive

Intraday range was huge during yesterday’s session, but close to close very modest. Imagine trading short gamma….and hedging the extremes.

Source: GS

The Yuan is having a volatile day.

Fear!

Mortgage Applications Decline -1.6% From Previous Week (30Y Mortgage Rates UP 137% Since Biden Was Elected President)

The mortgage market got its mind set on a recovery, but Biden’s mindless economic policies have jammed up the mortgage market. Example? Mortgage applications are down in a season where they typically increase.

Mortgage applications decreased 1.6 percent from one week earlier, according to data from the Mortgage Bankers Association’s (MBA) Weekly Mortgage Applications Survey for the week ending March 28, 2025.

The Market Composite Index, a measure of mortgage loan application volume, decreased 1.6 percent on a seasonally adjusted basis from one week earlier. On an unadjusted basis, the Index decreased 1 percent compared with the previous week. The seasonally adjusted Purchase Index increased 2 percent from one week earlier. The unadjusted Purchase Index increased 2 percent compared with the previous week and was 9 percent higher than the same week one year ago.

The Refinance Index decreased 6 percent from the previous week and was 57 percent higher than the same week one year ago.

Treasury yields continue to be volatile as economic uncertainty dominates markets. Most mortgage rates finished last week lower, with the 30-year fixed essentially unchanged at 6.70 percent. Last week’s level of purchase applications was its highest since the end of January, driven by a 3 percent increase in conventional purchases, while government purchase applications were down 2 percent.

The average contract interest rate for 30-year fixed-rate mortgages with conforming loan balances ($806,500 or less) decreased to 6.70 percent from 6.71 percent, with points increasing to 0.62 from 0.60 (including the origination fee) for 80 percent loan-to-value ratio (LTV) loans.

Conforming 30Y mortgage rates are up 137% since Biden was elected President.

Biden was the destroyer!

Soothe Me? Q1 GDP Now At -2.8% As 10Y Treasury Yield Falls To 4.157% (Recession Jitters?)

Soothe me? As we move further away from Sleepy Joe’s horrid economic policies, we should see an improvement in GDP from the current Atlanta Fed GDP Now Q1 Forecast of -2.8%.

The GDPNow model estimate for real GDP growth (seasonally adjusted annual rate) in the first quarter of 2025 is -2.8 percent on March 28, down from -1.8 percent on March 26.

The alternative model forecast, which adjusts for imports and exports of gold as described here, is -0.5 percent. After recent releases from the US Census Bureau and the US Bureau of Economic Analysis, the nowcast of the contribution of net exports to first-quarter real GDP growth declined from -3.95 percentage points to -4.79 percentage points in the standard model and from -1.92 percentage points to -2.53 percentage points in the alternative model.

The US Treasury 10Y yield has fallen to 4.157% as recession fears mount.

Simply Unaffordable! Multifamily Serious Delinquencies Soar To Highest Since 2000 (Home Prices UP 37% Under Biden, Rents UP 25%)

Housing and rental properties are simply unaffordable.

Freddie Mac Serious Delinquency Rate on Multifamily (Apartment) loans soared to highest rate since 2000. Since it is as of January 31, 2025, you can’t blame this on Donald Trump (although I am sure they will try).

Of course, home prices and rents soared under Biden. Home prices rose 37% under Biden and rents rose 25%. Simply unaffordable.

And The Fed will keep on printing money!

Credit has been deteriorating.

Won’t Get Fooled Again? New Homes For Sale Hits 500k (Glut), Existing Homes Inventory At 1.24 Million

Apparently, we DID get fooled again. In February, there were 500,000 new homes for sale.

While new home inventory hit 500k, existing home inventory rose to 1.24 million homes.

Cause? Home prices are too damn high. Thanks to Powell and The Fed.

Mortgage originations have dwindled under Biden/Harris.

Jerome Powell and the Blackhearts.

Keep On Printing? Case-Shiller National Home Price Index Up 4.1% YoY As Mortgage Applications Decline 2% Since Last Week

The Fed keeps on printing money M2! The Case-Shiller National home price index is up 4.1% since last year YoY as The Fed continues to print money.

Mortgage applications decreased 2.0 percent from one week earlier, according to data from the Mortgage Bankers Association’s (MBA) Weekly Mortgage Applications Survey for the week ending March 21, 2025.

The Market Composite Index, a measure of mortgage loan application volume, decreased 2.0 percent on a seasonally adjusted basis from one week earlier. On an unadjusted basis, the Index decreased 2 percent compared with the previous week. The seasonally adjusted Purchase Index increased 1 percent from one week earlier. The unadjusted Purchase Index increased 1 percent compared with the previous week and was 7 percent higher than the same week one year ago.

The Refinance Index decreased 5 percent from the previous week and was 63 percent higher than the same week one year ago.

Existing-Home Sales Increased to 4.26 million SAAR in February, But Down 1.16% YoY (M2 Money Printing Isn’t Helping)

Existing-home sales rose in February, according to the National Association of REALTORS®. For both monthly and year-over-year sales, two major U.S. regions experienced growth, one region remained stable and the other registered a decline.

Total existing-home sales – completed transactions that include single-family homes, townhomes, condominiums and co-ops – progressed 4.2% from January to a seasonally adjusted annual rate of 4.26 million in February. Year-over-year, sales slid 1.2% (down from 4.31 million in February 2024).

But Fed M2 Money printing isn’t helping existing home sales of a YoY basis!

The Empire Strikes Out! NY’s Empire State Activity Survey Drops To -19.30 (Biden Hangover)

The Imperial March from Star Wars should have been the theme for Bidenomics, the top-down government-directed economy (mainly to political donors). It will take a while for the economy to recover from its addiction to Federal government spending.

Speaking of The Empire, the New York Fed’s Empire State business activity survey declined to -19.30. Would Jerome Powell and The Fed have cut rates had they known about the Empire activity survey yesterday?

Emperor Palpatine. Aka, 10% Joe.

Keep On Printing! Mortgage Applications Decreased 6.2 Percent From Previous Week

Keep on printing!

Mortgage applications decreased 6.2 percent from one week earlier, according to data from the Mortgage Bankers Association’s (MBA) Weekly Mortgage Applications Survey for the week ending March 14, 2025.

The Market Composite Index, a measure of mortgage loan application volume, decreased 6.2 percent on a seasonally adjusted basis from one week earlier. On an unadjusted basis, the Index decreased 6 percent compared with the previous week. The seasonally adjusted Purchase Index increased 0.1 percent from one week earlier. The unadjusted Purchase Index increased 1 percent compared with the previous week and was 6 percent higher than the same week one year ago.

The Refinance Index decreased 13 percent from the previous week and was 70 percent higher than the same week one year ago.

Mortgage rates increased for the first time in nine weeks, with the 30-year fixed rate rising to 6.72 percent. This increase in rates led to a decrease in refinance volume. However, purchase application volume inched up to its highest level in six weeks, led by a 3 percent increase in FHA purchase applications. Overall, purchase application volume is up 6 percent compared to last year at this time. Growing inventories of homes on the market and steadier mortgage rates are supporting homebuying activity thus far this spring.

Keep on printing!