Now we have people like JPMC’s Jaime Dimon speculating about 7 rates increases in 2022 and other bankers speculating about a faster than expected withdrawal of the The Fed’s monetary stimulus in the form of asset purchases, we have to anticipate what the result will be in markets.
Like what will happen to housing starts if and when the stimulus is removed.
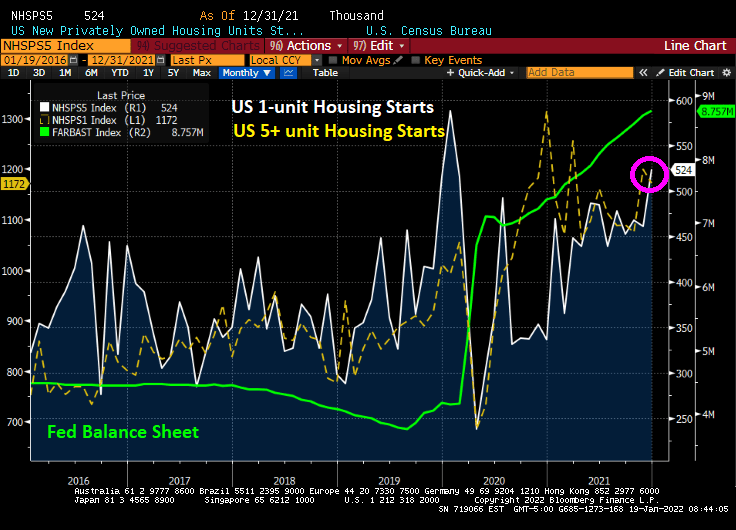
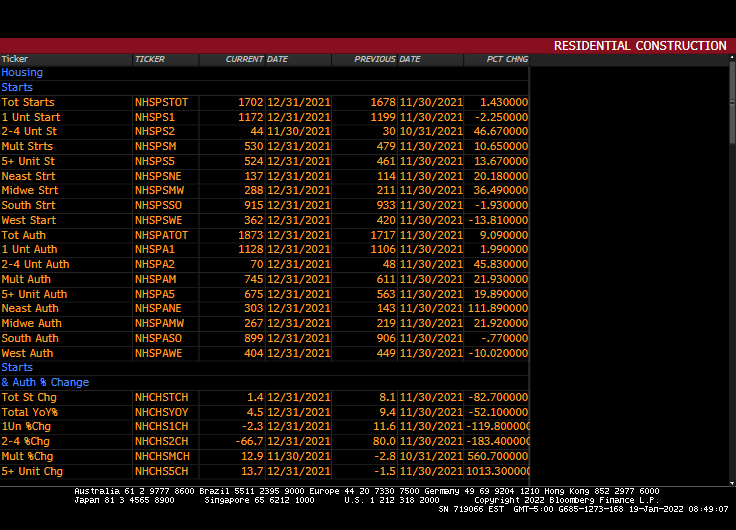
Today, we saw 1-unit housing starts fall 2.25% from November to December, but multifamily (5+ unit) starts rise 13.7%.
Of course, home price growth of near 20% YoY combined with declining REAL hourly earnings points to more multifamily housing and less single-family detached housing.
Here is the rest of the story, as Paul Harvey used to say. 5+ unit permits are up 19.9% in December while 1-unit permits are up 1.99%.
The 10-year Treasury Note yield rose to 1.869% this afternoon as Freddie Mac’s 30-year mortgage commitment rate rose to 3.45%.
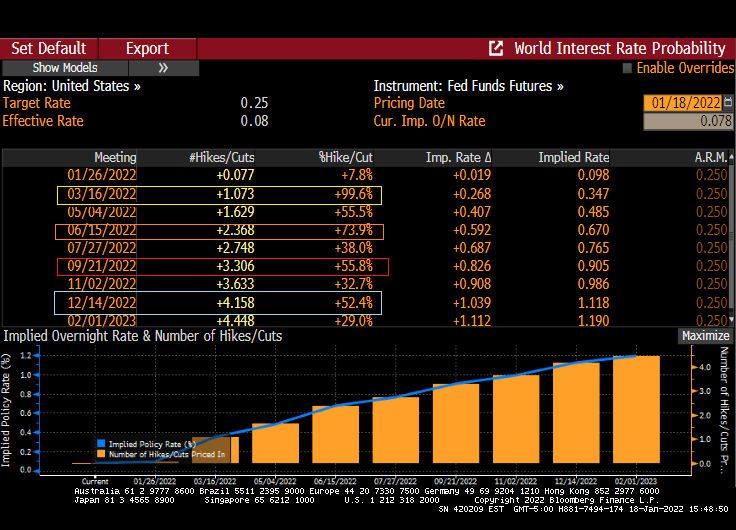
And if you like The Fed Funds Futures data, it is pricing in 4 rate hikes by The Fed (March, June, September and December). For a grand total of … 100 basis points or 1%.
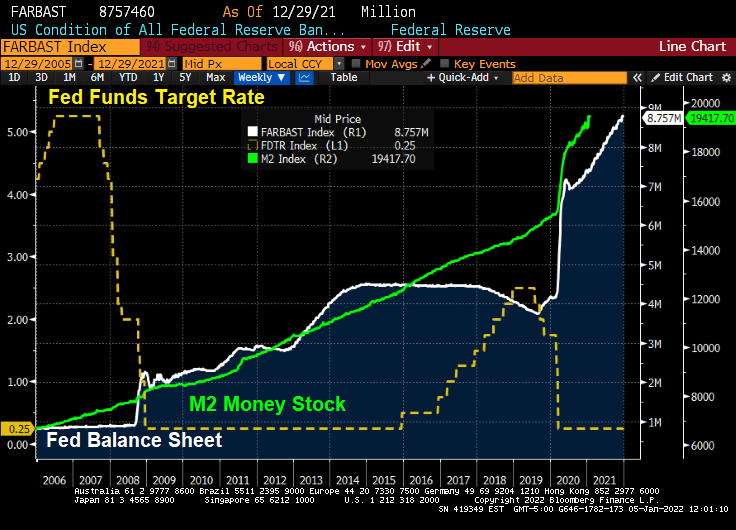
By keeping rates soooo low for soooo long, The Fed has committed a serious policy error. Or as Kevin Malone calls it, “The Fed’s Famous Chili!”
If you look at the following chart, you can see multifamily (5+ unit) starts remain elevated (pink box) which is not surprising given that home prices at growing at 19.1% YoY nationally (orange circle) and REAL hourly earnings have declined (yellow triangle) thanks to reemergence of inflation after 40 years.
Then we have the humming dragon, rising mortgage rates, that will reduce housing affordability even further.
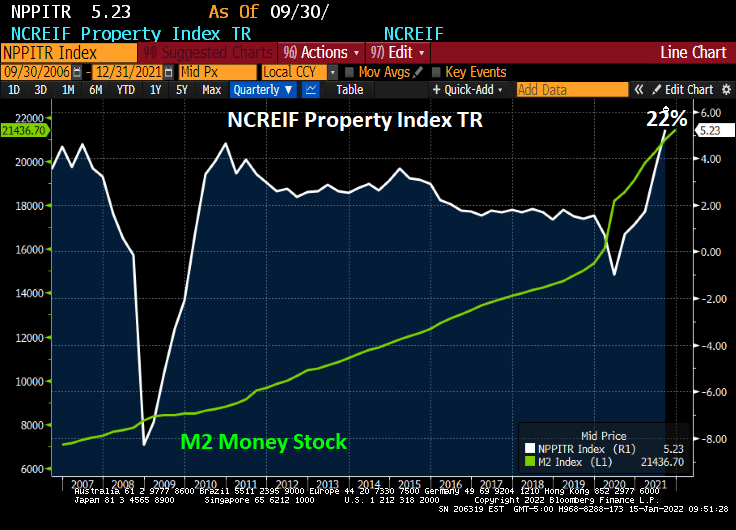
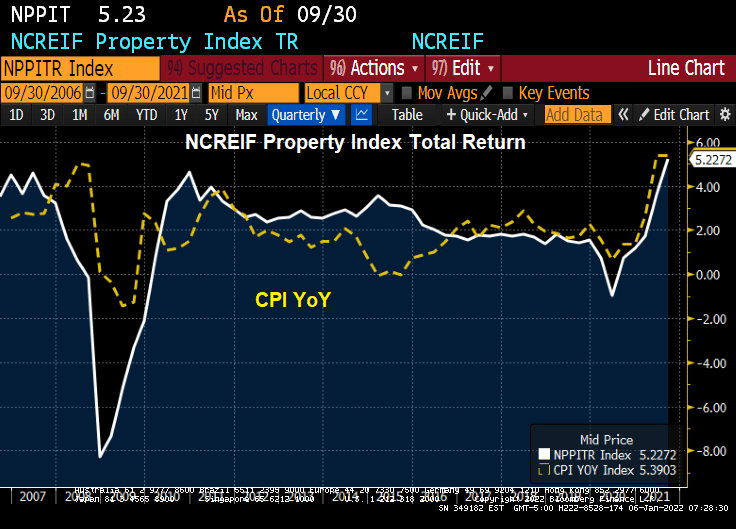
Inflation is burning out of control. While home price growth has been off the cherts (as Jean-Ralphio would say), commercial real estate has jumped incredibly at 22% YoY. The Bloomberg charting function hasn’t updated for the Q4 NCREIF report yet so I had to manually write-in 22% on the following chart.
So, what will happen IF The Fed follows through with its monetary stimulus reduction? JPMC’s Jaime Dimon warns that The Fed could hike 7 times in 2022 and not be ‘sweet and gentle’.
Mortgage rates in the U.S. rose for a third straight week, reaching the highest point in almost two years.
The average for a 30-year loan was 3.45%, up from 3.22% last week and the highest since March 2020, Freddie Mac said in a statement Thursday.
Rates tracked a jump in yields for 10-year Treasuries, which climbed to levels not seen since early 2020, before the pandemic roiled financial markets. Signs point to borrowing costs rising further as the job market improves and the Federal Reserve steps up its efforts to tame inflation.
That would increase the burden on homebuyers who are already stretching to afford a purchase. Rates for 30-year mortgages tumbled to a record low of 2.65% a little more than a year ago.
Cheap loans have helped fuel a housing rally that’s still running hot even as home prices soar out of reach for many Americans.
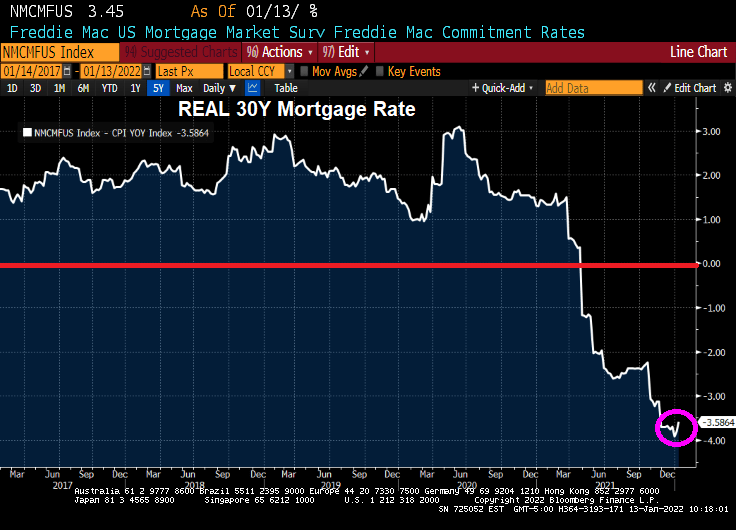
But wait! The REAL 30-year mortgage rate (nominal 30-year rate – CPI YoY) is -3.59%.
Lael Brainard, Biden’s nominee to be Vice Chairman of The Federal Reserve, has been one of the “inflation is transitory” crowd. US Senator Toomey is questioning Brainard in today’s hearing. From Toomey’s opening statement:
Last year, Governor Brainard repeatedly insisted that inflation was transitory. We have now had nine consecutive months where inflation has been more than two times the Fed’s 2% target. That makes it pretty clear that inflation is not transitory. Yesterday’s CPI release of 7.0%—the highest in 40 years—confirms that.
Inflation is a tax that is eroding Americans’ paychecks every day. Even though wages are growing, inflation is growing faster and causing workers to fall further and further behind.
At least the REAL mortgage rate is negative!
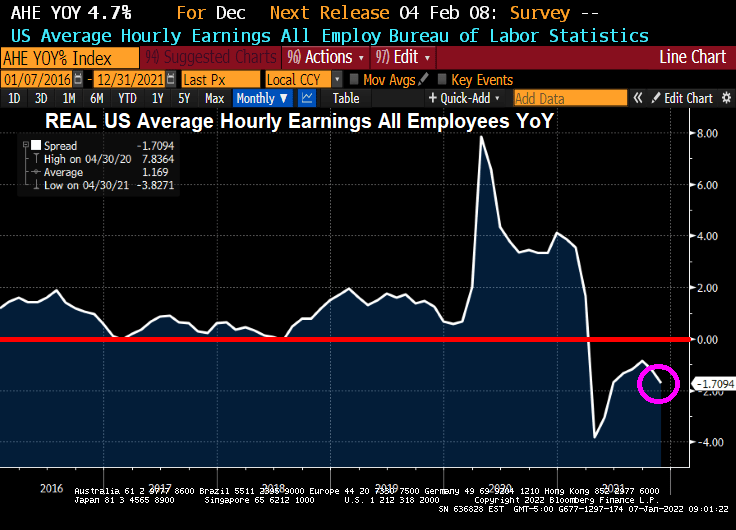
I hope Senator Toomey shows Brainard this chart of “transitory” negative wage growth.
Negative wage growth and negative REAL mortgage rates. What a total mess!
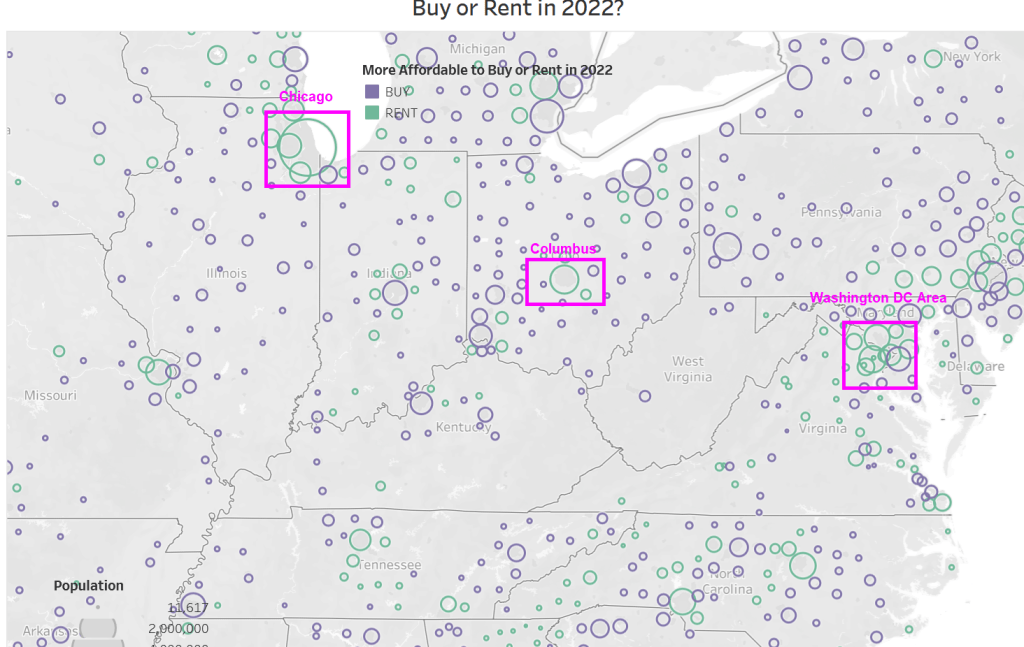
According to Attom, US home prices are growing faster than rents in nearly 90 percent of the nation; but prices are still more affordable in almost 60 percent of U.S. markets; Renting remains more financially viable in most-populous urban areas.
If we look at Attom’s map of affordability, you can see that in western states, it is more affordable to rent. And in megalopolis (Boston, New York, Philadelphia, Washington DC). And Miami. But elsewhere in the eastern states, it is more affordable to buy than to rent.
Of course, any where I live like Phoenix, Fairfax VA, Chicago IL, and Columbus OH it is more affordable to rent than to own.
You will notice that the areas where buying is more affordable than renting tend to be smaller towns with slower growth, while larger cities tend to be more affordable to rent.
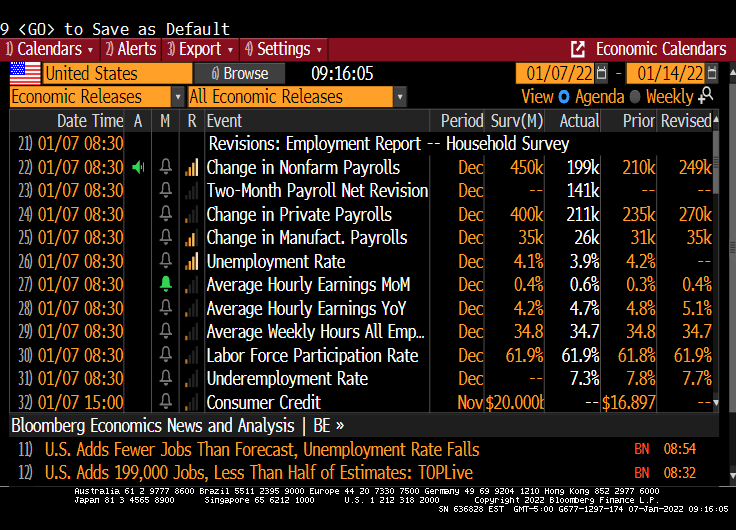
The November jobs report is out and the highlight is that US Average Hourly Earnings GREW at a rate of 4.7% YoY. Unfortunately, inflation is still raging resulting in REAL US Average Hourly Earnings DECLINING at a rate of -1.71% YoY.
REAL US home price growth is slowing and is at 12.856% YoY as REAL average hourly earnings slowed to -1.7094% YoY.
The lowlight of the November jobs report is that only 199K jobs were added versus the 450K jobs expected to be added. At least the unemployment rate fell to 3.9%.
WHERE we the jobs added? Leisure and hospitality led the way! Hey bartender.
Yes, REAL wage growth and REAL home price growth are slowing.
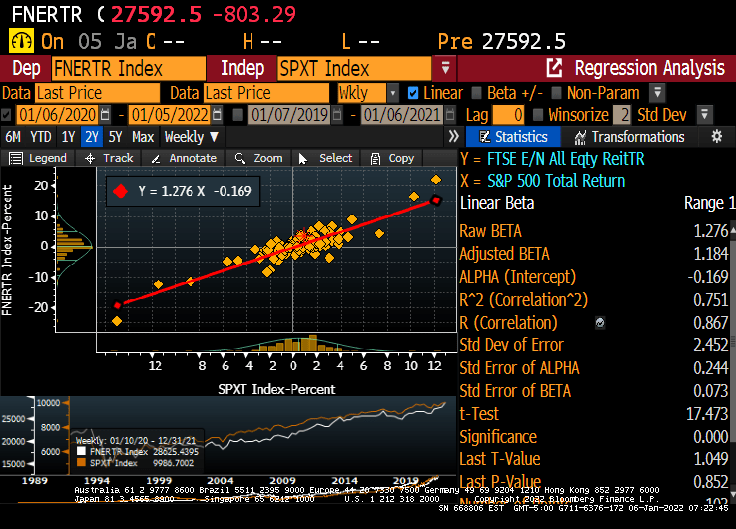
How about real estate investment trusts? The NAREIT all-equity index rose by 35.6% YoY while inflation rose at 6.8%. The S&P 500 index rose 28.9% YoY.
Of course, the NAREIT all-equity index has a beta of 1.276.
How about the NCREIF All-property commercial real estate index? For Q3, the NCREIF property index rose by 5.22%, less than the most recent inflation reading of 6.8%.
So for the past year, housing has beaten the pants-off inflation, REITs have earned a higher return than inflation, and the NCREIF index seems to be rising slower than inflation (but with its lag problems, I anxiously await the Q4 numbers which should be higher.
When we look at the Buffett Indicator, we can see how The Federal Reserve’s loose monetary policies (or follycies) are driving up stocks to unsustainable levels that may not survive without The Fed’s “Do Ho Big Bubble Policies.”
How about the Shiller CAPE (Cyclically-adjusted Price/Earnings) ratio? While not up to dot.com levels yet, the Shiller CAPE ratio is climbing with the assistance of The Fed and their insane money printing.
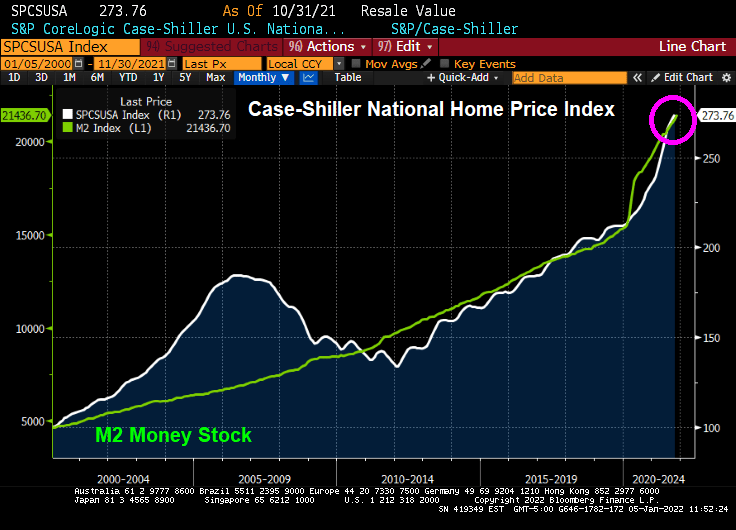
How about house prices? The Case-Shiller National home price index is far above the level last scene during the housing bubble of 2005-2007. Again, with a little help from The Federal Reserve.
I can’t wait to see how the equity market and housing market reacts IF The Fed actually follows through with reducing monetary stimulus. Probably not just adding more stimulus, just reinvesting the Treasury and MBS proceeds (aka, not shrinking the balance sheet).
The inventory of existing homes for sale in the US is extremely low. The lack of available inventory to buy is helping drive home prices through the roof.
Available inventory for purchase peaked back in the 2007-2008 period during the dreaded housing bubble in the US. But inventory for sale has declined ever since. Why?
I think it has something to do with the aging of the US population. Look at this chart of Existing Home Sales Inventory against the growth 65+ years old.
Perhaps households 65+ are resisting moving to states like Florida and Arizona as they had in the past, leaving them stationary in their dwelling.
Another reason for the bewildering lack of inventory is the growth of the HECM (Home Equity Conversion Mortgage) that allows elderly households to drain the equity in their home rather than have to sell to utilize it. But HECMs have not taken-off sufficiently to explain the mystery of the missing inventory.
So we know that housing inventory is very low and we know that the number of Americans 65 and over is increasing. But we do not know the reason for the decline in inventory.


You must be logged in to post a comment.