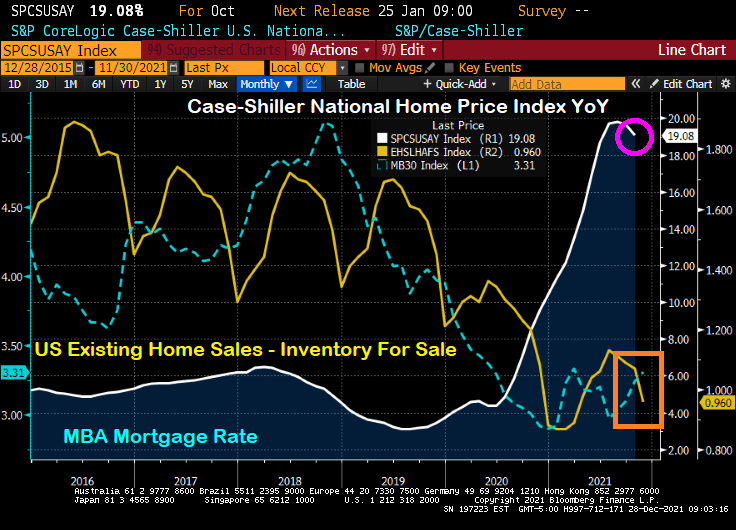
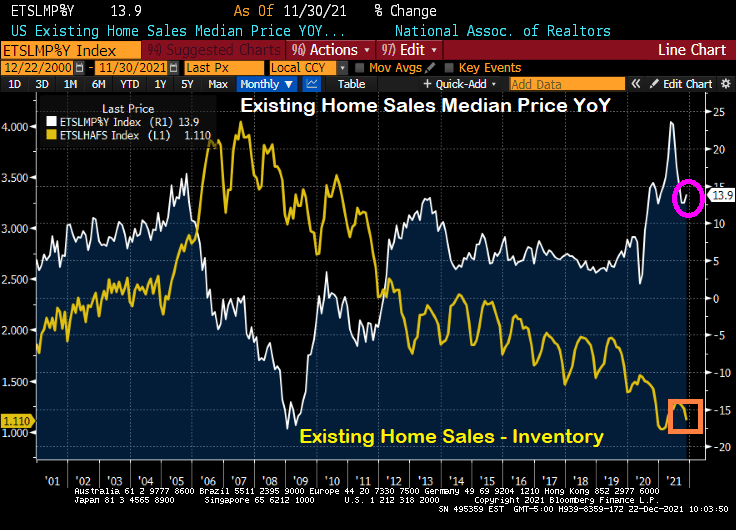
There is a lot going on in the US housing market. Excessive monetary stimulus keeping mortgage rates low, historically low inventory available for sale, and FOMO (fear of missing out … on rapidly rising home prices).
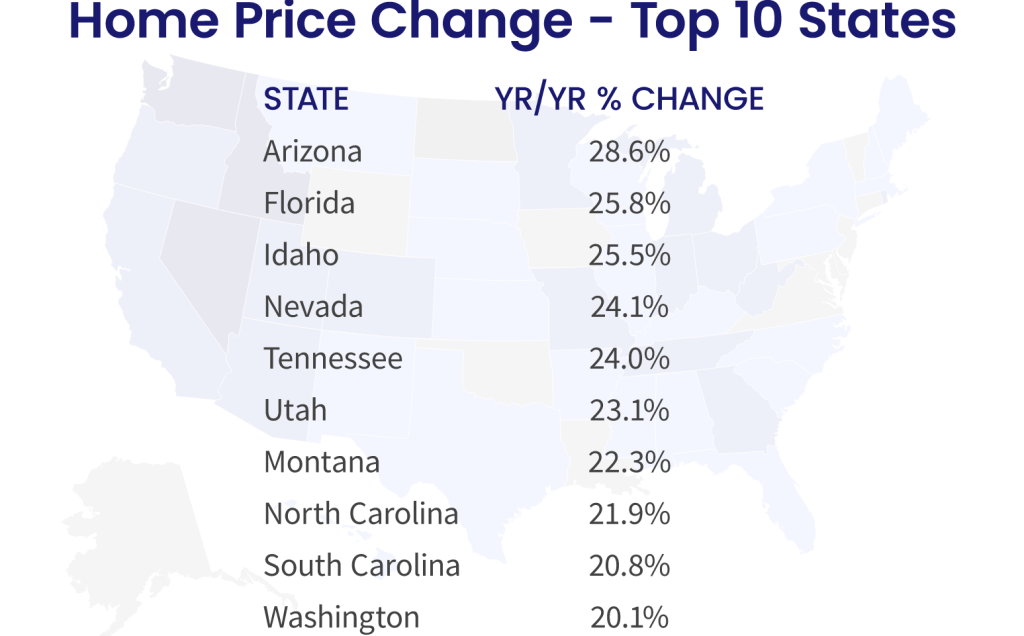
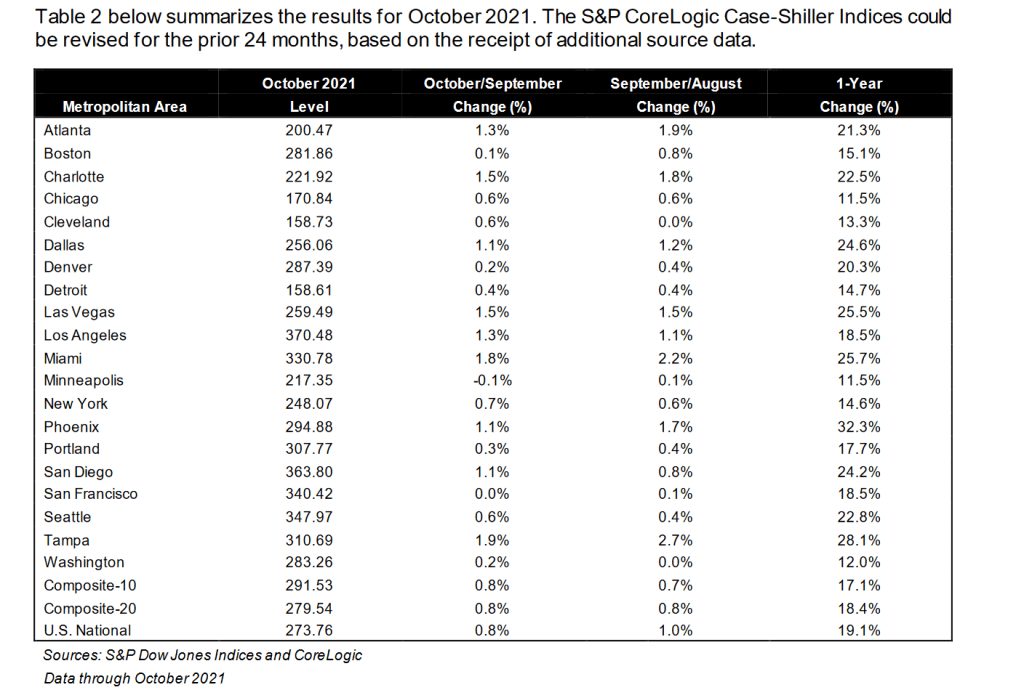
By metro area, Phoenix AZ once again leads with 32.3% YoY. Minneapolis MN is the slowest growing metro area in terms of home prices at 11.5% (tied with Chicago, IL).
Housing in the US is getting “simply unaffordable.” And it has gotten far worse over the past year. Thanks to BAD government policies.
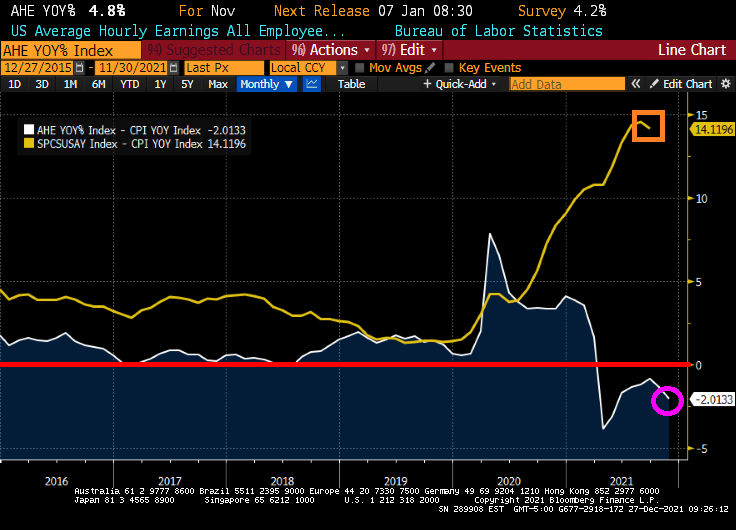
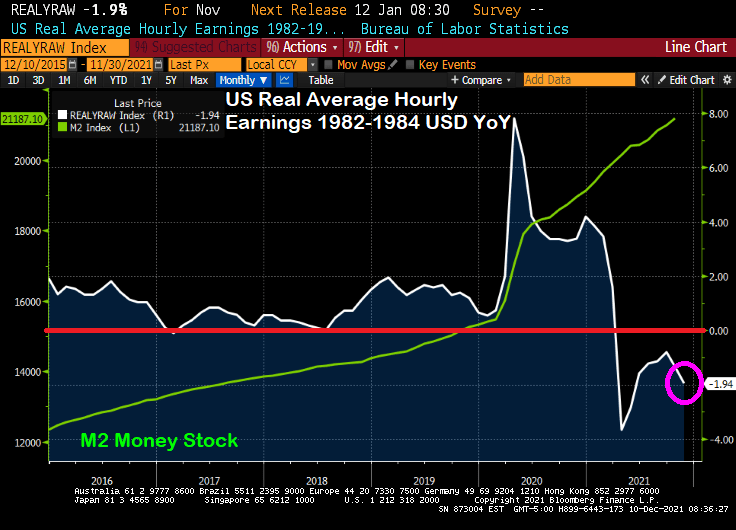
While wage growth is positive, inflation is sucking the life from consumers. REAL average hourly earnings growth is -2.0133%. Even worse, home prices are rising at a 14.12% pace in REAL terms. So, wages are losing to inflation and housing is pulling away from renters in terms of affordability.`
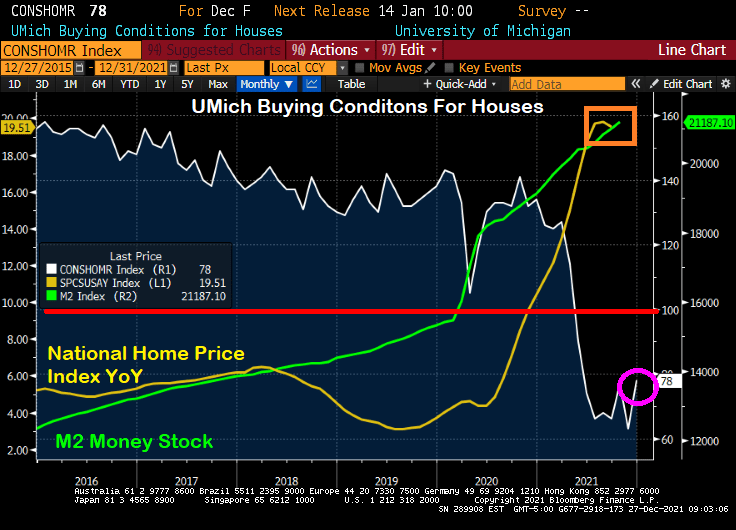
So it is not surprising that the University of Michigan consumer survey for “Buying Conditions For Housing” remains below 100 (meaning that more people think buying conditions for housing are negative than positive). With the Case-Shiller National home price index growing at a 19.51% YoY pace, it is no wonder that consumers are getting scared of the housing market.
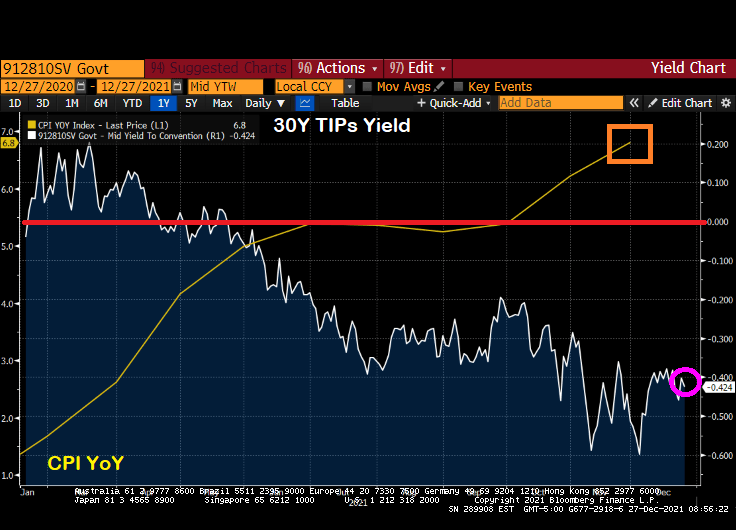
Yes, US inflation is at a 40-year high and the 30-year Treasury Inflation Protected (TIP) yields is at -0.424%. That says quite a bit about the pickle US consumers are in.
US consumer confidence overall has declined to the lowest level since just after the financial crisis and housing bubble burst of 2008-9.
Doctor, Doctor (Yellen), please don’t try to make housing more “affordable” which will result in housing being even LESS affordable.
But I do like how Biden took credit for lowering gasoline prices a little after his anti-energy policies drove up gasoline prices in the first place from $2.20 to $3.40 a gallon, a 55% price increase. Thanks for nothing, Joe!
And with Omicron raging (with few reported deaths), Anthony Fauci, President Biden’s top medical adviser, indicated support for making vaccinations a requirement for domestic fights.
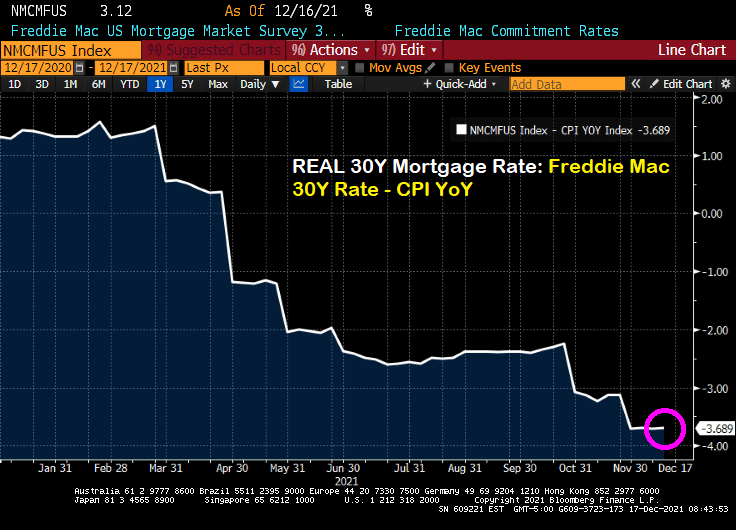
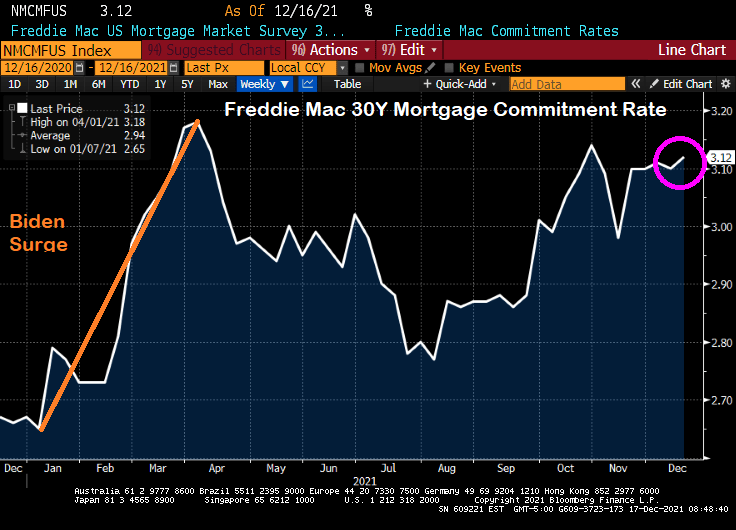
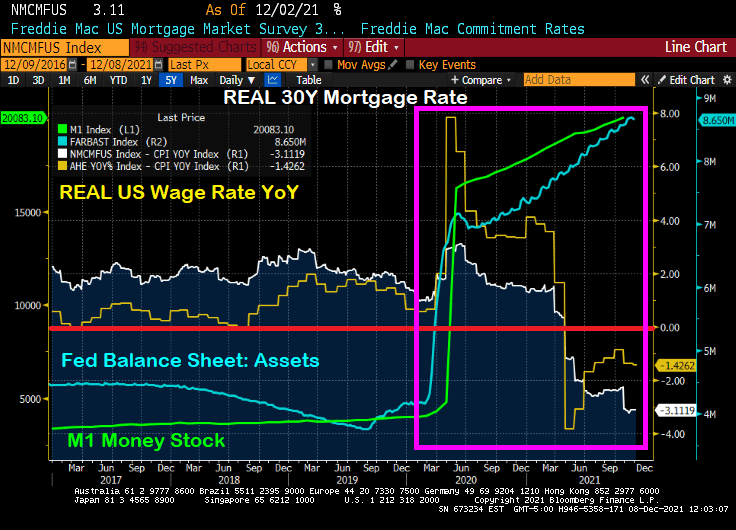
The Freddie Mac 30-year mortgage commitment rate rose to 3.12%. But once we subtract the gut-wrenching inflation rate, the REAL 30-year mortgage rate is -3.689%.
The nominal Freddie Mac 30-year commitment rate rose to 3.12% which is still lower than 3.18% back on April 1, 2021 after surge in rates following Biden’s taking the office of Presidency in January.
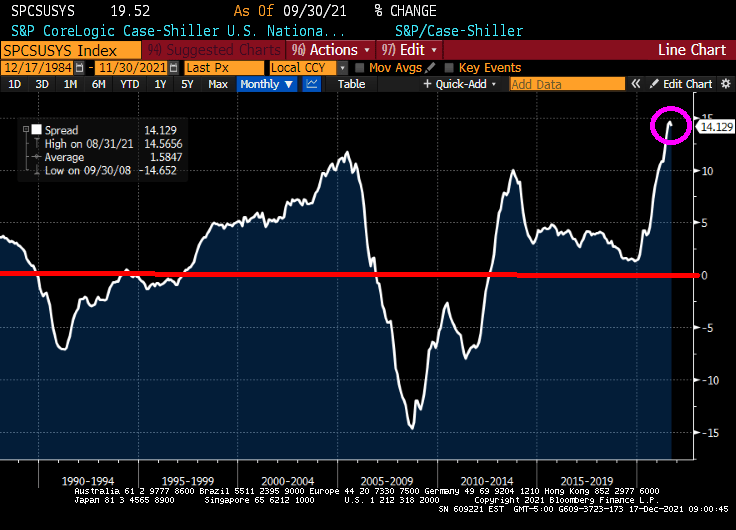
Meanwhile, the REAL Case-Shiller National home price index (CS National YoY – CPI YoY) is growing at the fastest rate in history. Great if you already own a home, but lethal if you are renting and want to move to homeownership.
Meanwhile, REAL wage growth is at -1.94% YoY.
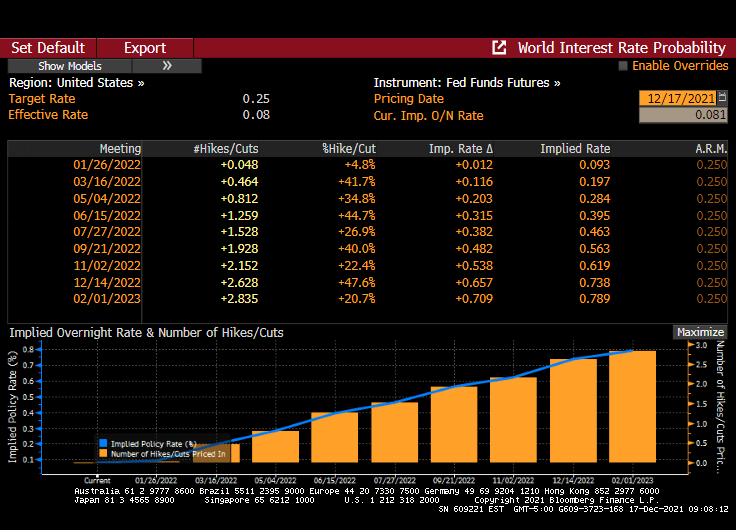
Well, Chairman Powell and The Gang failed to raise the Fed Funds Target Rate yet again, but let us know that they will tighten someday soon. The Fed Funds Futures are signalling a rate hike at the June 2022 meeting and another at the November meeting.
While The Fed couldn’t care less about the Taylor Rule, it is still interesting to note just how out of touch The Fed FOMC is with reality. The Taylor Rule indicates that their target rate should be 16.94% rather than the current target rate of 0.25%.
Keeping the target rate unchanged in the face of gut-wrenching inflation is a bold strategy, Cotton.
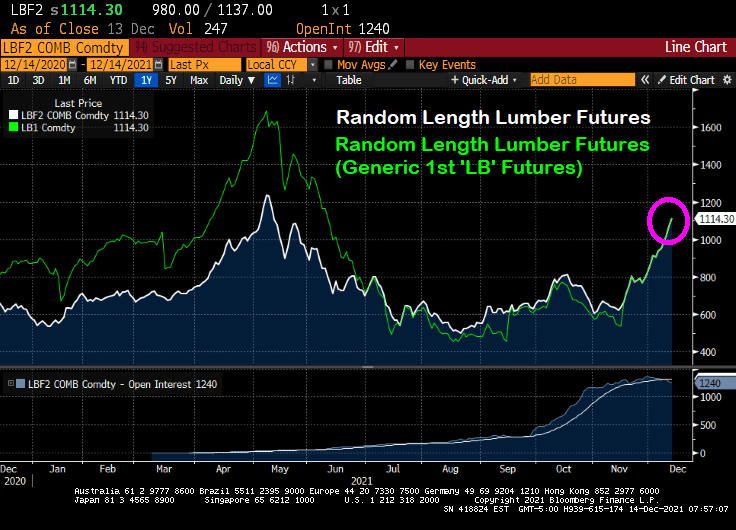
According to Markets Insider, lumber prices are up 127% from its most recent low. With demand high and supplies low, record low interest rates still drive homeowners to the market, so much that builders are struggling to keep up.
Note the surge in lumber futures prices back in April and May 2021 that eased. But lumber futures prices are gaining steam again.
Let’s see what happens to lumber prices and new home prices if and when The Federal Reserve decides to takes its gargantuan foot off the monetary accelerator pedal.
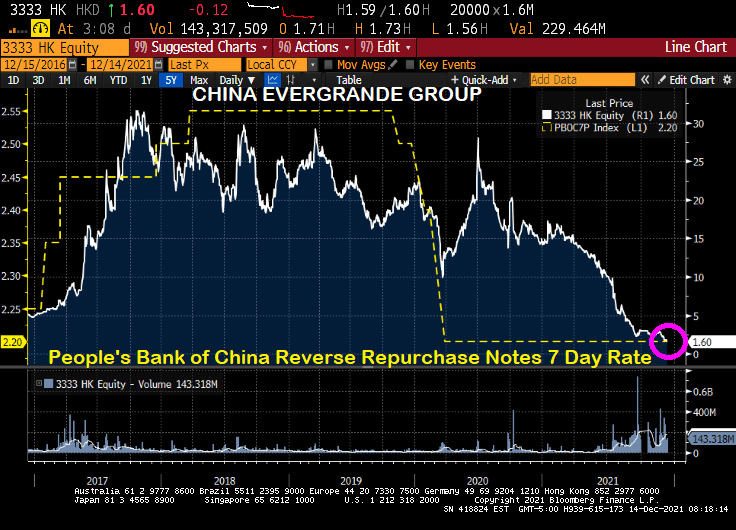
In other housing-related news, China’s Evergrande remains in the news as its stock price founders.
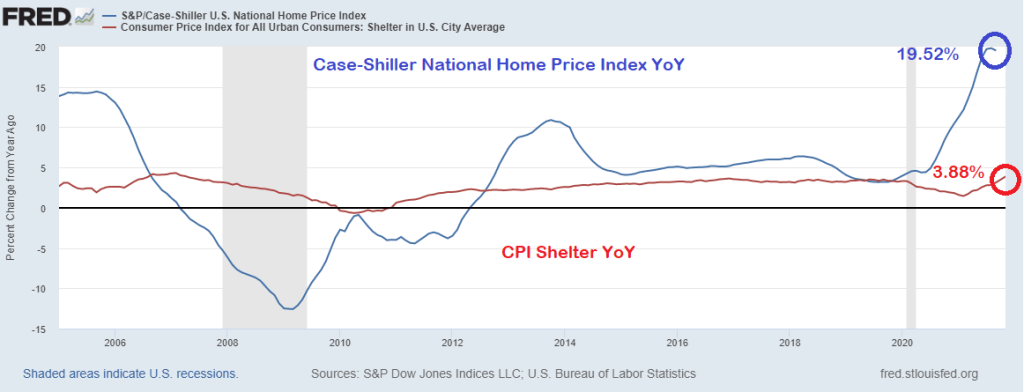
But that 6.9% YoY is very misleading because of the strange way the Bureau of Labor Statistics measures the largest asset in most households’ expenditures: housing.
The BLS measures inflation in housing using the Shelter measurement. Which was only 3.88% YoY. The problem is that the Case-Shiller National Home Price Index was 19.52% in its last reading. That is quite a discrepancy.
So, if we substitute the Case-Shiller National home price index for the CPI Shelter, we get an inflation rate of greater than 11%.
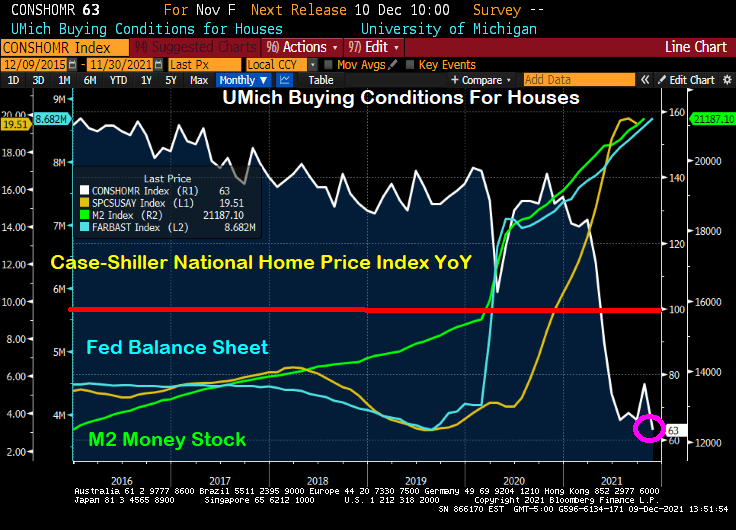
Just look at this chart of the University of Michigan Buying Conditions For Houses index. It was positive (meaning above 100) until shortly after COVID struck and The Federal Reserve rode to the rescue. National home price growth was already at 4.57% YoY in March 2020, then ballooned to 19.51% YoY at the last reading.
Here is the same chart with the broader M2 Money stock and The Fed’s Balance sheet. Same results, just not as dramatic as M1.
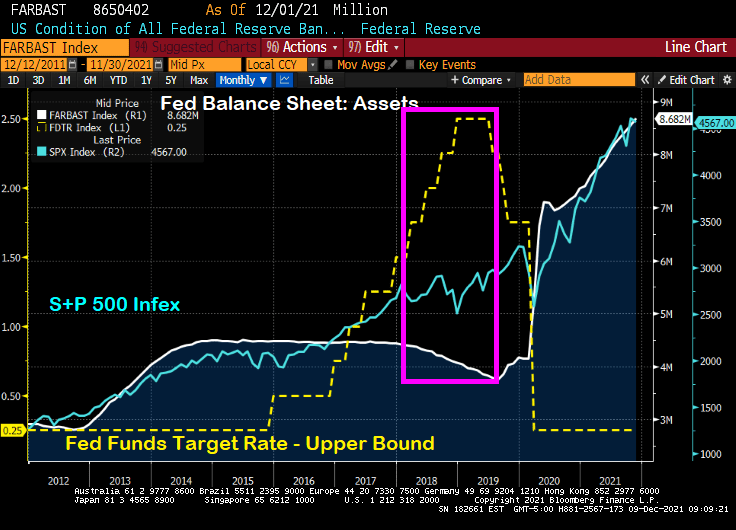
We will soon find out if The Federal Reserve will announce a rate hike or taper news. They are likely to confirm tapering, particularly if they believe that tapering won’t roil markets. After all, then Fed Chair Janet Yellen and the FOMC decided to let the Fed’s balance sheet taper (white line) while, at the same time, increasing the Fed’s target rate (yellow line). The S&P 500 index rose 9.5% over the taper/rate increase period of 12/29/2017 to 8/30/2019.
But since Stimulypto (2/28/2020 to 11/30/2021), the Fed’s balance sheet doubled+ from $4,158,637 to $8,681,771. And The Fed Funds Target Rate (UB) immediately fell from 1.75% in February 2020 to 0.25% in March 2020 … and has stayed there ever since. The S&P 500 index rose 54.6% over this Stimulypto period.
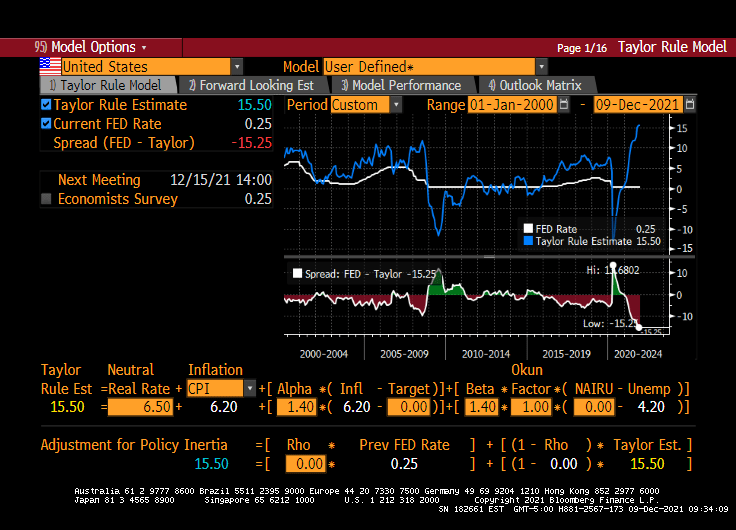
But The Fed’s upcoming decision on December 15, 2021 may be a Yellen-pivot (taper balance sheet, but raise The Fed Funds Target rate). But, then again, maybe not. The Fed is getting really bad about forward guidance and choose instead to surprise us. Hence, this is why an a-political rule is preferred (such as the Taylor Rule).
Unfortunately, the Taylor Rule infers a Fed Funds Target rate of 15.50% (using CPI YoY running at 6.20% YoY. If The Fed raises their target rate by 25-50 basis points at the December 15th meeting, color me surprised.
So, the Powell Pivot may just be the Yellen Pivot after all.
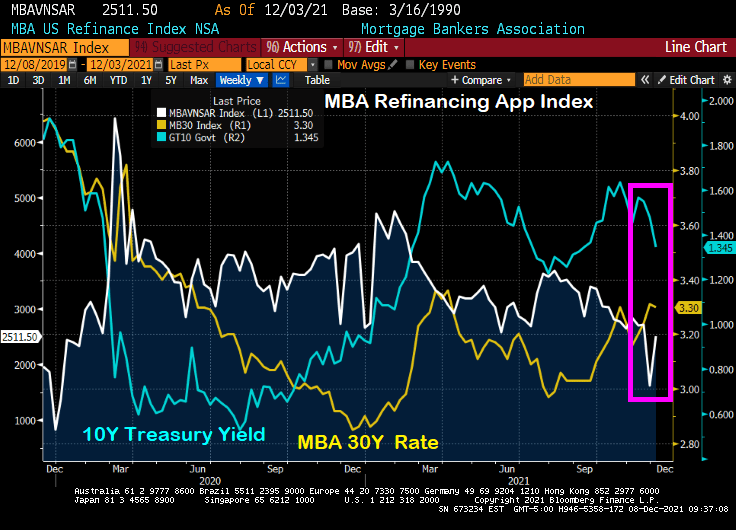
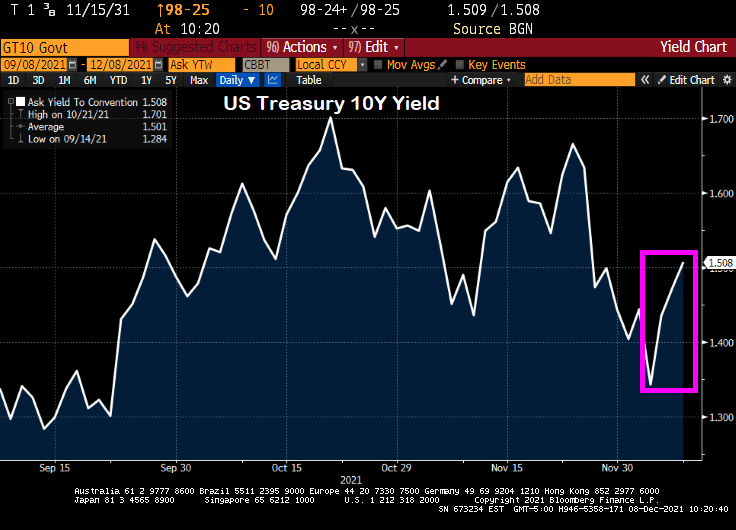
Despite the “Talk, Talk” from The Federal Reserve about balance sheet taper and rate “normalization,” we actually saw the 10-year Treasury yield fall from 1.6651% on 11/23/2021 to 1.343 on 12/3/2021. While the 30-year mortgage rate only fell from 3.31% to 3.3%, it is the SIGNAL that The Fed is sending that people should refinance their mortgages ASAP.
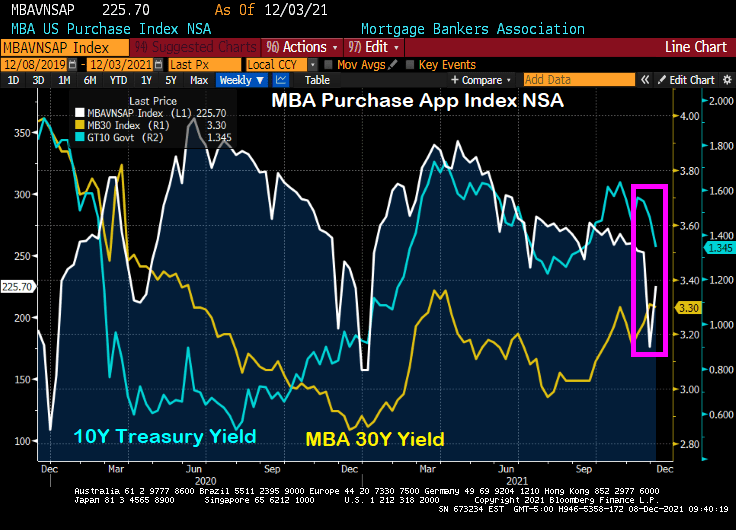
You can see the rise in mortgage refinancing applications of 56% week-over-week (WoW) (white line) with the drop in the 10-year Treasury yield (blue line) despite the relatively small drop in the Mortgage Bankers Association (MBA) tiny drop in their 30-year mortgage rate index.
Ditto for the MBA mortgage purchase application index. The drop in the US Treasury yield (blue line) resulted in a 28% WoW increase in mortgage purchase applications.
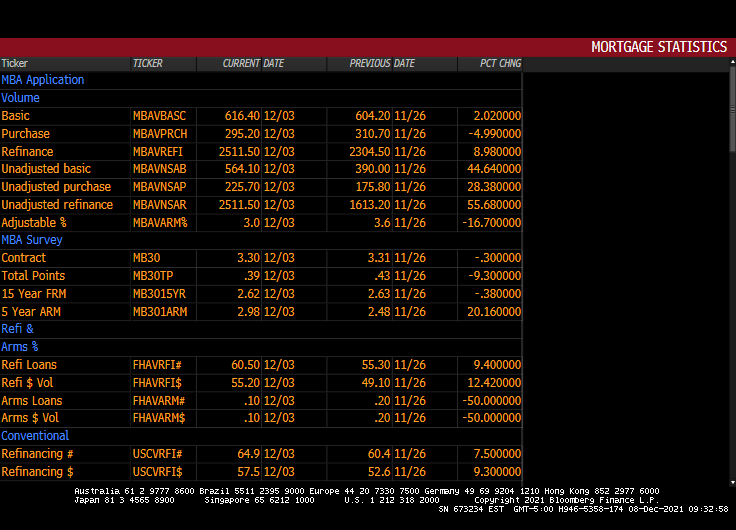
Here is the table of MBA data for the week of 12/03.
Please note that the 10-year Treasury yield have jumped since 12/03 indicating that mortgage application activity for the week of 12/10 will be lower.
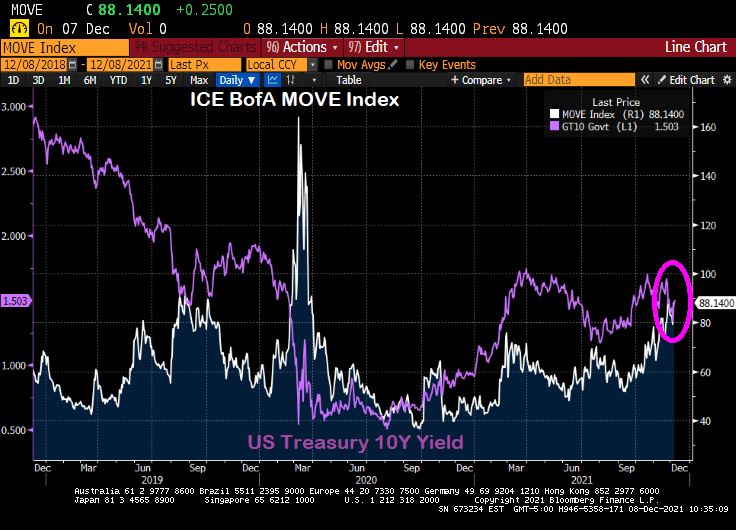
Here is the MOVE bond volatility index and the US Treasury 10-yield chart. Can you spot the COVID outbreak??


You must be logged in to post a comment.