Inflation soared under Biden/Harris, primarily due to their outrageous wasteful government spending.

US government spening soared with Covid and politicians enjoyed the unbridled spending.

Let’s see if Trump and Republicans can do any better.
Confounded Interest – Anthony B. Sanders
Financial Markets And Real Estate
Inflation soared under Biden/Harris, primarily due to their outrageous wasteful government spending.
US government spening soared with Covid and politicians enjoyed the unbridled spending.
Let’s see if Trump and Republicans can do any better.
It is a brave new world as the US attempts an Argentina-like shift from an over-regulated, corrupt economy to a more free economy. While Argentina has Javier Milei, the US is stuck with greedy Democrats and RINOs and their bloated spending sinking any attempt to cut wasteful spending.
So as we transition from woefully corrupt and demented Joe Biden to Donald Trump, the labor market is … terrible. The job finding rate of unemployed workers has collapsed.

This occurred as the Philly Fed Business Outlook plummeted.

Here is Javier Milei of Argentina and The View’s image of a libertarian leader, Javier Bardem from No Country For Old Men.


Government didn’t build this country. The private sector did.
Housing Starts:
Privately-owned housing starts in November were at a seasonally adjusted annual rate of 1,289,000. This is 1.8 percent below the revised October estimate of 1,312,000 and is 14.6 percent below the November 2023 rate of 1,510,000. Single-family housing starts in November were at a rate of 1,011,000; this is 6.4 percent above the revised October figure of 950,000. The November rate for units in buildings with five units or more was 264,000.
And down -10.2% year-over-year.

Building Permits:
Privately-owned housing units authorized by building permits in November were at a seasonally adjusted annual rate of 1,505,000. This is 6.1 percent above the revised October rate of 1,419,000, but is 0.2 percent below the November 2023 rate of 1,508,000. Single-family authorizations in November were at a rate of 972,000; this is 0.1 percent above the revised October figure of 971,000. Authorizations of units in buildings with five units or more were at a rate of 481,000 in November.
As we watch Biden and Democrats attempt to demolish the country as Biden leaves office. Let’s see how many criminals Biden will pardon on the way out … like the Jan 6th “select” committee of Adam Schiff, Adam Kinzinger, Liz Cheney, Bennie Thompson, etc.

Apparently, the late Hawaiian crooner Don Ho foresaw Biden’s irresponsible spending spree. That is, BIG BUBBLES.
Let’s start with the Buffett Indicator (Warren, not Jimmy!). It indicates that the stock market is STRONGLY OVERVALUED.

The S&P 500 Mean Reversion Model also shows the stock market to be STRONGLY OVERVALUED.

How about the Shiller P/E Ratio? Also showing strong overvaluation.

House prices under Biden have exploded partly due to the outrageous Federal spending following COVID.

The Feral Reserve also had a hand in the housing bubble. While mortgage rates remain high (relative to the Trump years), The Fed’s balance sheet remains elevated.

To be sure, some Republicans were complicit in the spending spree. But mostly it was Democrats and the Biden/Harris Administration … which is still doling out millions.

It is the Biden Boogie!
Joe Biden is leaving the Presidency with an attrocious record. While saying he is leaving Trump with the strongest economy in modern times, the is actually leaving Trump and Republicans with a hollow shell for an economy. It is the final punch in the jaw from an angry, failed President.
The following chart shows that in October and November, the US deficit exploded to a staggering $624.2 billion, and even though this included several calendar adjustments – which explains the freak September surplus which as we said was due to calendar effects – the November deficit of $367 billion was $14 billion more than consensus estimates of $353 billion. Worse, combining October and November we find that not only was the combined number of $624 billion some 64% higher than the corresponding period one year ago, but it was also the highest deficit on record for the first two-months of the year (and that includes the spending insanity during the covid crisis).

Putting the deficit in context, the budget deficit in October and November – the first two months of fiscal 2025 – are now officially the worst start a year for the US Treasury on record.

No wonder even Statist Janet Yellen (Treasury Secretary who failed utterly at her job) apologized that her abysmal performance. “I am concerned about fiscal sustainability and I am sorry that we haven’t made more progress,” she said adding that “I believe that the deficit needs to be brought down especially now that we’re in an environment of higher interest rates.” Meanwhile Biden keeps handing out $$$ to Ukraine, Africa, Syria, illegal immigrants and anything else that asks … unless it it American citizens. Man, does Biden HATE America!
Here is Yellen’s record on debt. A total of $15.2 TRILLION under her leadership.

Under Biden/Yellen (don’t forget Senate fools like Schumer and McConnell!), debt interest has surpassed Social Security and Medicare as the second largest government agency expense.

Biden is a classic progressive Democrat, spending other people’s money like a wild man (sort of like California Governor “Greasy Gavin” Newsom’s father. Or grandfather. And let’s not forget the $222 TRILLION in UNFUNDED liabilities such as Social Security and Medicare.

“See Joe, I can destroy California’s economy just like you destroyed the US economy!”

The last gasp of the Biden/Harris reign of (economic) error!
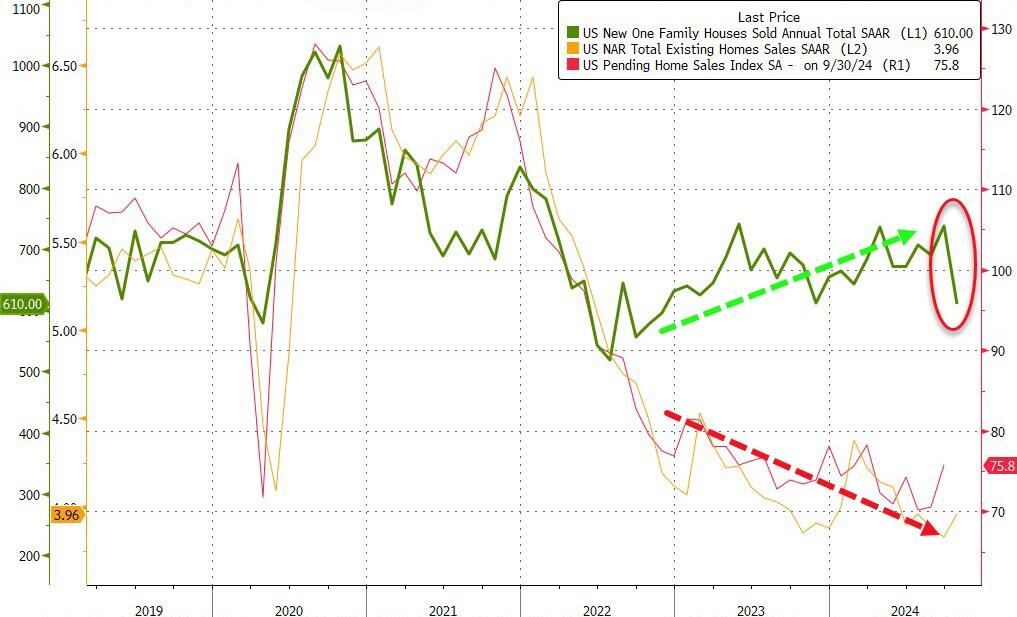
After existing home sales unexpectedly ticked up in October, analysts expected new home sales to slow after their recent resurgence (-1.8% MoM). They were right… BUT… the magnitude is mind-boggling!
New Home Sales collapsed 17.3% MoM in October. That is the largest MoM drop since July 2013.

That MoM plunge dragged sales down 9.4% YoY to 610k SAAR – the lowest since Nov 2022
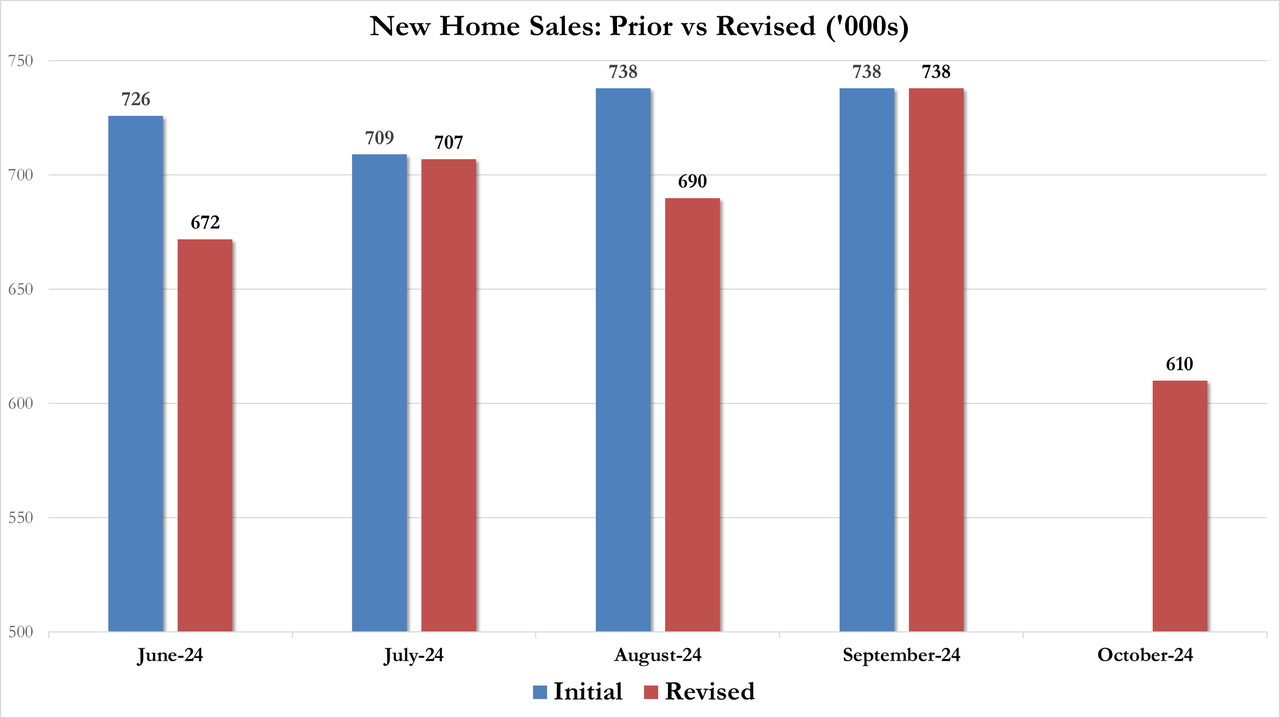
Of course, all the revisions are lower…
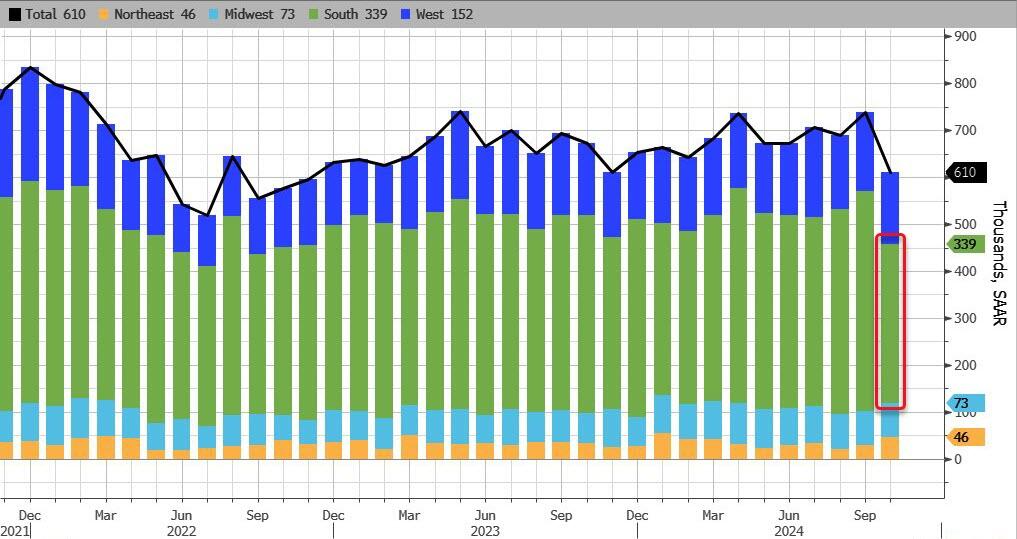
Hurricanes Helene and Milton, which tore through parts of the Southeast, delayed sales in the nation’s biggest housing region and dragged down sales overall.
Sales in the South decreased 28% to 339,000, the slowest pace since April 2020. Sales also fell in the West, but rose in the Northeast and the Midwest.
Finally, we note that the median sale price of a new home increased to $437,300 in October, the highest in 14 months.
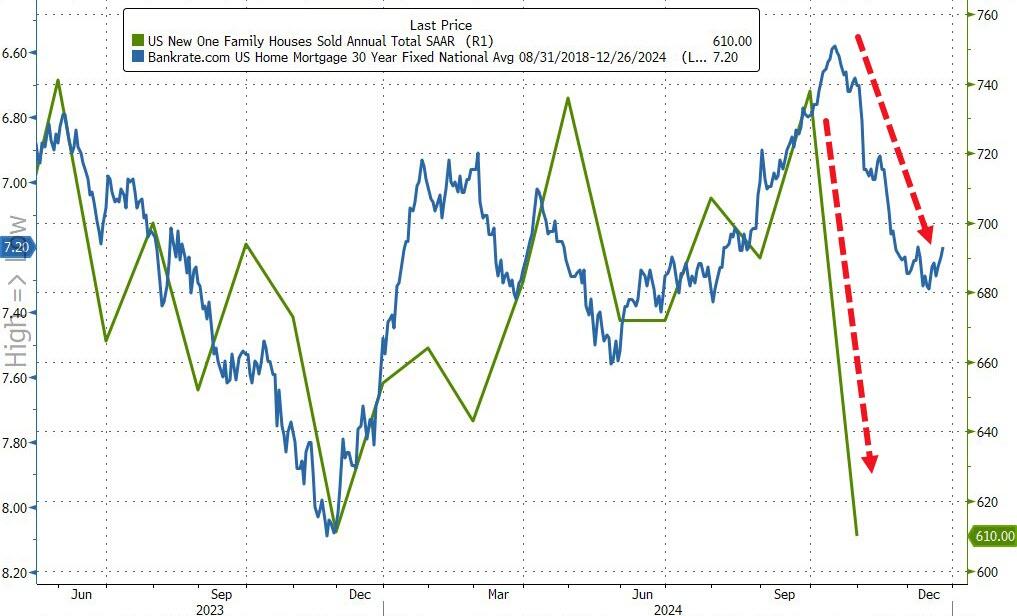
Does this mean November’s data will see a massive surge in new home sales? …even as rates have increased significantly?
Rolling into Cleveland to the lake.
NEW YORK, NOVEMBER 26, 2024: S&P Dow Jones Indices (S&P DJI) today released the
September 2024 results for the S&P CoreLogic Case-Shiller Indices. The leading measure of U.S.
home prices recorded a 3.9% annual gain in September 2024, a slight deceleration from the previous annual gains in 2024.

YEAR-OVER-YEAR
The S&P CoreLogic Case-Shiller U.S. National Home Price NSA Index, covering all nine U.S. census divisions, reported a 3.9% annual return for September, down from a 4.3% annual gain in the previous month. The 10-City Composite saw an annual increase of 5.2%, down from a 6.0% annual increase in the previous month. The 20-City Composite posted a year-over-year increase of 4.6%, dropping from a 5.2% increase in the previous month. New York again reported the highest annual gain among the 20 cities with a 7.5% increase in September, followed by Cleveland and Chicago with annual increases of 7.1% and 6.9%, respectively. Denver posted the smallest year-over-year growth with 0.2%.
Table 2 below summarizes the results for September 2024. Cleveland and New York top 7% YoY.

To quote Freddie King, the US is going down.
Longer-term inflation jumped to their highest since June 2008, according to the latest UMich Sentiment survey, while short-term inflation expectations dropped to four year lows…

Housing sentiment (buying conditions for housing) remains depressed under Biden/Harris
“Reign of (economic) error.”

Here is a picture depicting the assassination of the US housing market.

Its a slow down in the housing market.
Existing Home Sales were expected to rebound modestly in October (+2.9% MoM) after dropping for 6 of the last 7 months to the lowest levels since 2010, and they did. Sales rose 3.4% MoM (a beat) but thanks to a downward revision for September from -1.0% to -1.3% MoM. What is most shocking about the shift is that it pushed the YoY change for existing home sales positive (+2.9% YoY) for the first time since July 2021…
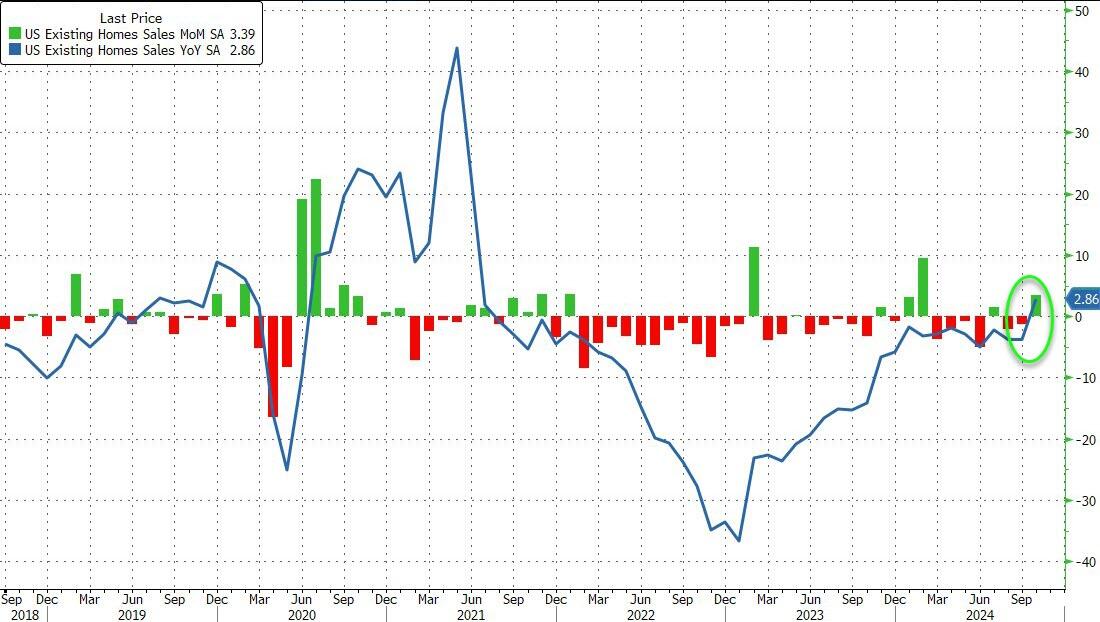
…but in context, that shift up to 3.96mm SAAR homes sold is nothing…
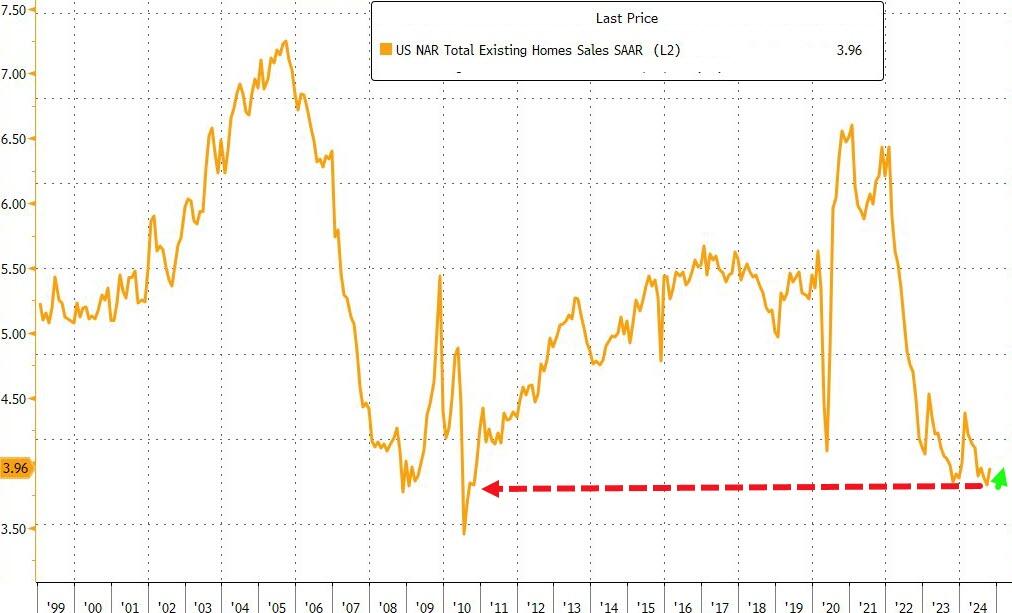
High borrowing costs have led to a shortage of previously owned homes on the market, discouraging many would-be home sellers from listing their properties for sale and having to part with their current low financing costs.
“Additional job gains and continued economic growth appear assured, resulting in growing housing demand,” NAR Chief Economist Lawrence Yun said in a prepared statement.
“While mortgage rates remain elevated, they are expected to stabilize.”
Last month, the inventory of available homes edged up 0.7% to 1.37 million, continuing to trend higher although well below pre-pandemic levels.
Despite the weakness in sales, tight inventory is keeping prices elevated, yielding one of the least affordable housing markets on record. The median sale price last month increased 4% from a year earlier to $407,200, the highest ever for any October, the NAR figures show.
Contract signings rose in all four US regions, led by a 6.7% jump in the Midwest.
Sales of single-family homes increased 3.5% in October; purchases of condominiums and co-ops were up 2.7%
Finally, while that’s all very exciting – a scintilla of growth off almost record lows – the fecal matter is about to strike the rotating object as rising mortgage rates lagged impact threatens…
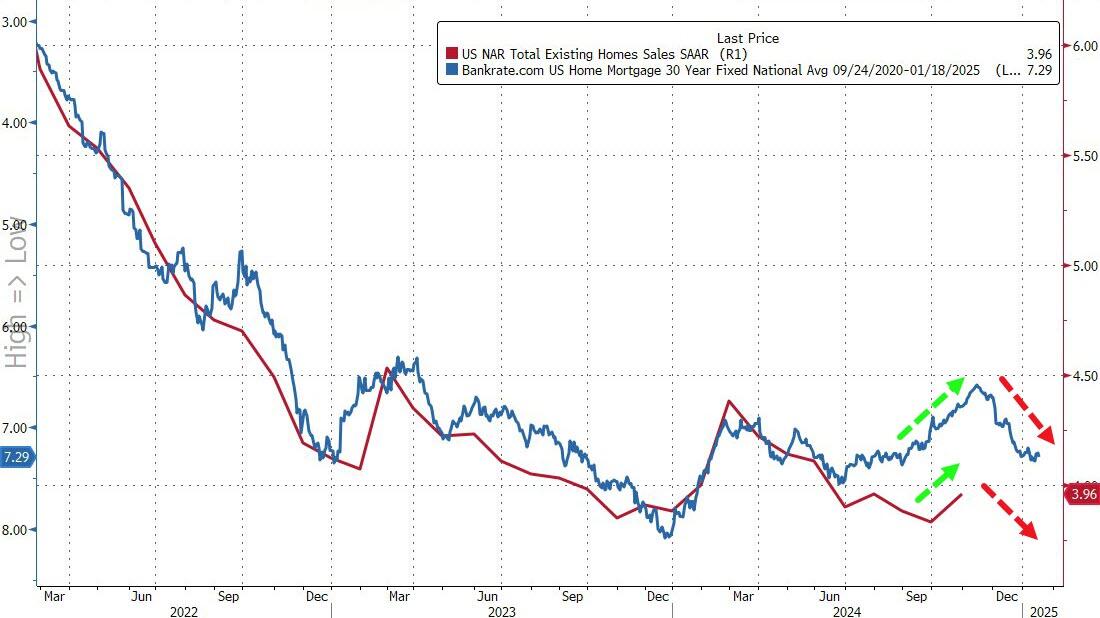
In October, 59% of homes sold were on the market for less than a month, compared with 57% in September, and 19% sold above the list price. Properties remained on the market for 29 days on average, compared with 28 days in the previous month. First-time buyers made up 27% of purchases, still historically low.
Fortunately, the Biden/Harris administration is winding down. On the mortgage side, the mortgage market is already gone under Biden/Harris where mortgage purchase applications are down a whopping 60%.
Mortgage applications increased 1.7 percent from one week earlier, according to data from the Mortgage Bankers Association’s (MBA) Weekly Mortgage Applications Survey for the week ending November 15, 2024.
The Market Composite Index, a measure of mortgage loan application volume, increased 1.7 percent on a seasonally adjusted basis from one week earlier. On an unadjusted basis, the Index decreased 1 percent compared with the previous week. The seasonally adjusted Purchase Index increased 2 percent from one week earlier. The unadjusted Purchase Index decreased 3 percent compared with the previous week and was 1 percent lower than the same week one year ago. And down -60% under Biden/Harris.

The Refinance Index increased 2 percent from the previous week and was 43 percent higher than the same week one year ago.

Slowing economy, rising rates, too expensive housing. Not a good sign for the mortgage market.

You must be logged in to post a comment.