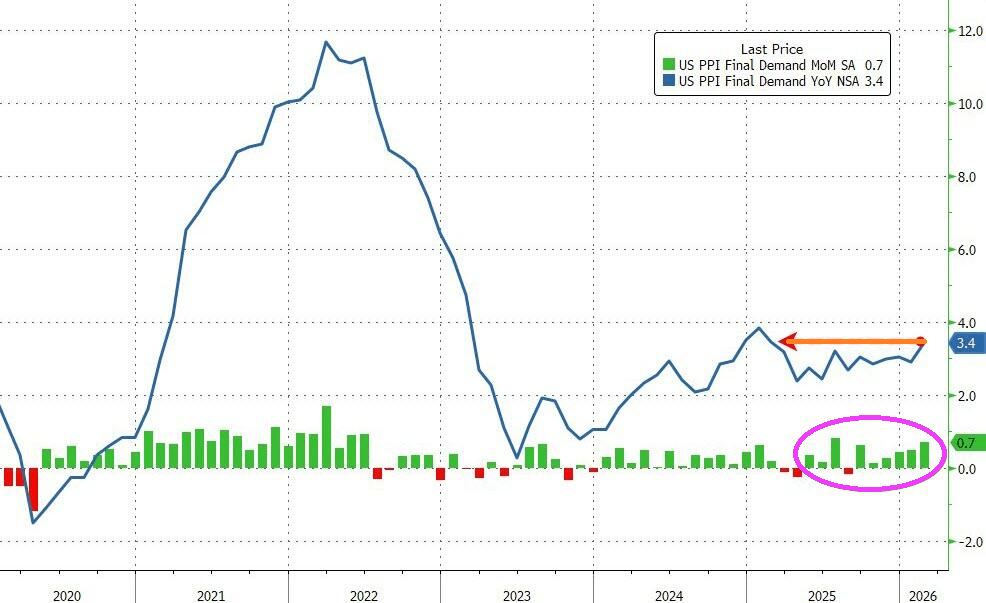
Producer prices were higher by 3.4% YoY (notably hitter than the 3.0% expected and up from the 2.9% prior). That is the hottest PPI since January 2025
Source: Bloomberg
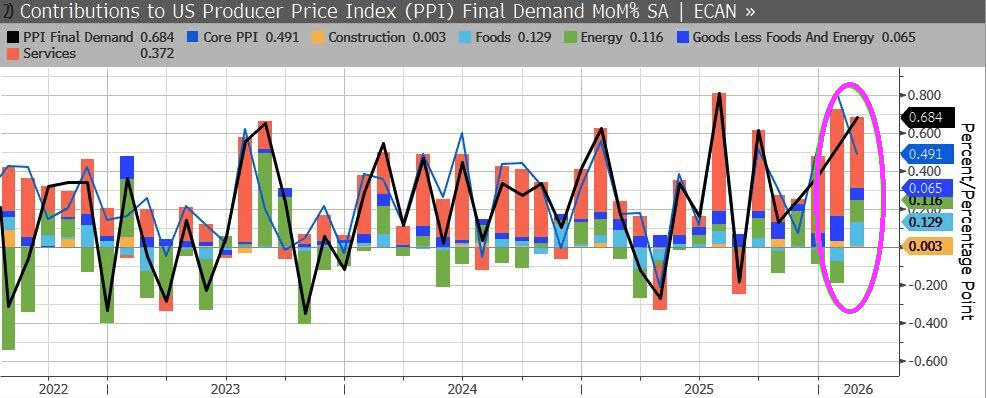
More than half of the February rise in prices for final demand can be attributed to a 0.5-percent advance in the index for final demand services. Prices for final demand goods increased 1.1 percent.
Core PPI (ex Food and Energy) also soared (+0.5% MoM) pushing core prices up by 3.9% YoY – the highest since Jan 2025.
Trump has been President for 1 year and fighting against Biden and the Democrats economic misery.
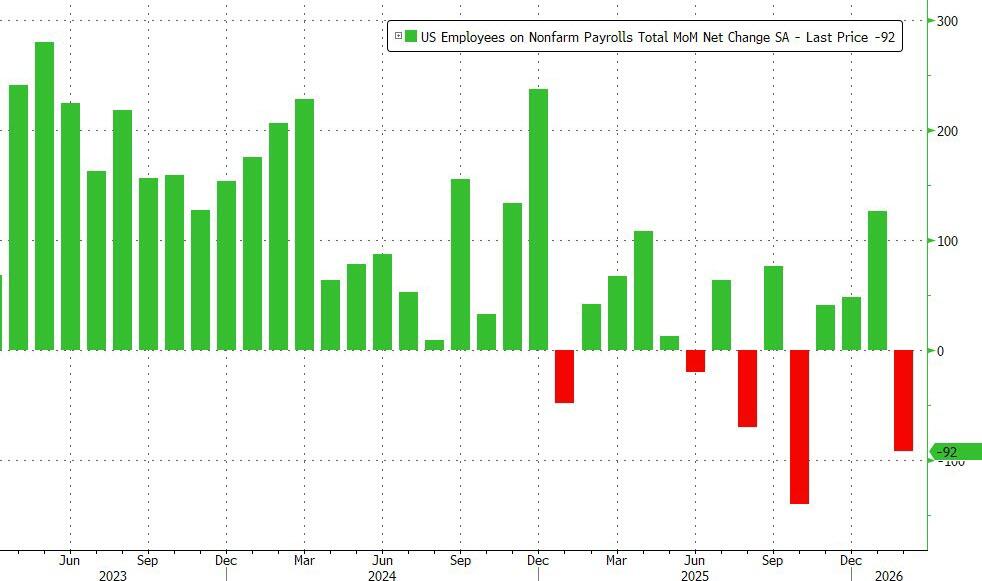
In February, the US lost 92,000 jobs, a huge drop from the downward revised 126K in January, and the second worst print since 2020 (only October’s shock -140K was worse), and this time, the massive drop can’t be dismissed as a one-time drop in government payrolls. The number of private payrolls dropped by 86K, also a huge miss to estimates of a 60K increase.
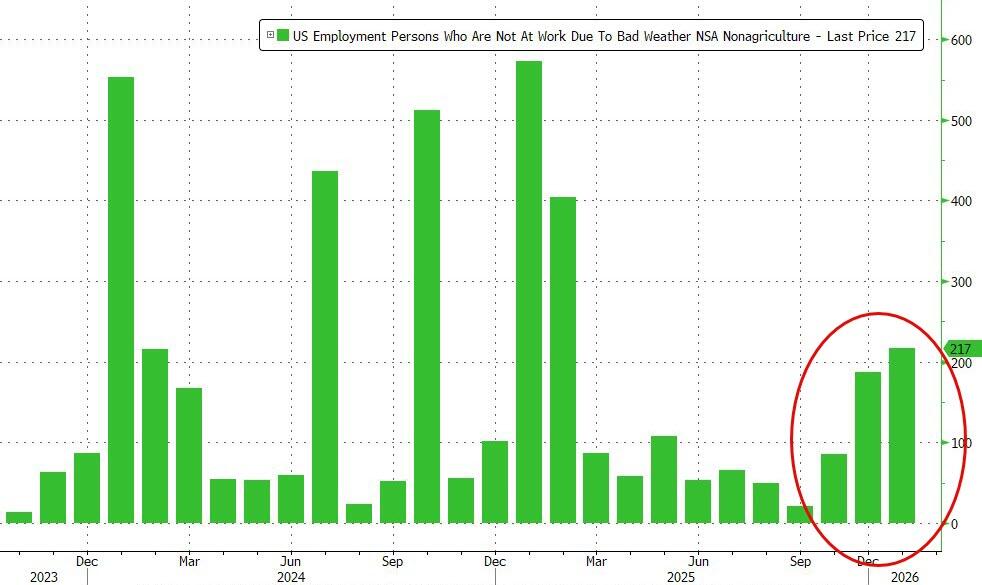
One potential mitigating factor: the number of people who were unable to work due to weather surged to 228K in February, well above last year’s level 167K, due to the powerful winter storms hitting the US.
The number of long-term unemployed (those jobless for 27 weeks or more) changed little at 1.9 million in February but is up from 1.5 million a year earlier. The long-term unemployed accounted for 25.3 percent of all unemployed people in February.
The number of people employed part time for economic reasons decreased by 477,000 to 4.4 million in February. These individuals would have preferred full-time employment but were working part time because their hours had been reduced or they were unable to find full-time jobs.
The number of people not in the labor force who currently want a job changed little in February at 6.0 million. These individuals were not counted as unemployed because they were not actively looking for work during the 4 weeks preceding the survey or were unavailable to take a job.
Among those not in the labor force who wanted a job, the number of people marginally attached to the labor force changed little at 1.6 million in February. These individuals wanted and were available for work and had looked for a job sometime in the prior 12 months but had not looked for work in the 4 weeks preceding the survey. The number of discouraged workers, a subset of the marginally attached who believed that no jobs were available for them, decreased by 109,000 in February to 366,000.
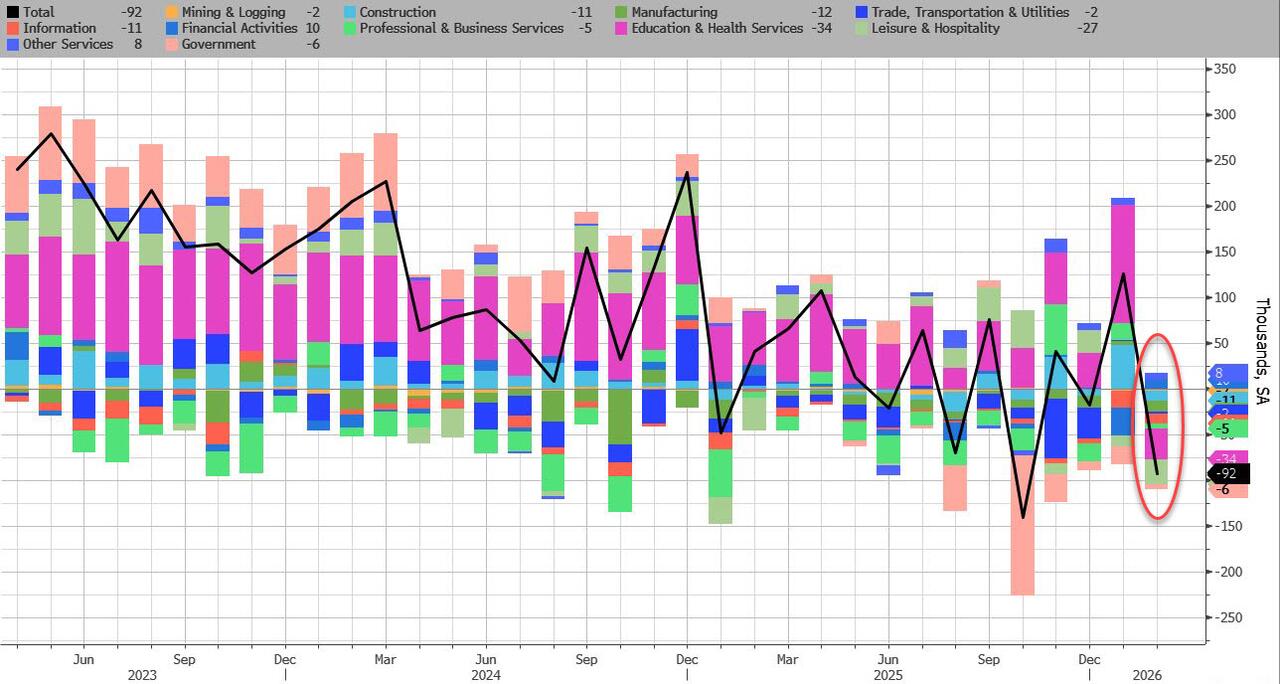
Turning to the establishment survey, which unveiled the shocking February drop, the BLS reported a broad-based decline, driven by striking employment workers:
Employment in health care decreased in February, reflecting strike activity. Employment in information and federal government continued to trend down. Payroll employment changed little on net in 2025.
Health care employment declined by 28,000 in February, following a large increase in January (+77,000). Offices of physicians lost 37,000 jobs in February, primarily due to strike activity. Hospitals added 12,000 jobs. Over the prior 12 months, health care had added an average of 36,000 jobs per month.
Employment in information continued to trend down in February (-11,000). The industry had lost an average of 5,000 jobs per month over the prior 12 months.
In February, federal government employment continued to decline (-10,000). Since reaching a peak in October 2024, federal government employment is down by 330,000, or 11.0 percent.
Employment in social assistance continued its upward trend in February (+9,000), driven by individual and family services (+12,000).
Transportation and warehousing employment changed little in February (-11,000). A job loss in couriers and messengers (-17,000) was partially offset by a gain in air transportation (+5,000). Employment in transportation and warehousing has declined by 157,000, or 2.4 percent, since reaching a peak in February 2025.
Employment showed little change over the month in other major industries, including mining, quarrying, and oil and gas extraction; construction; manufacturing; wholesale trade; retail trade; financial activities; professional and business services; leisure and hospitality; and other services.
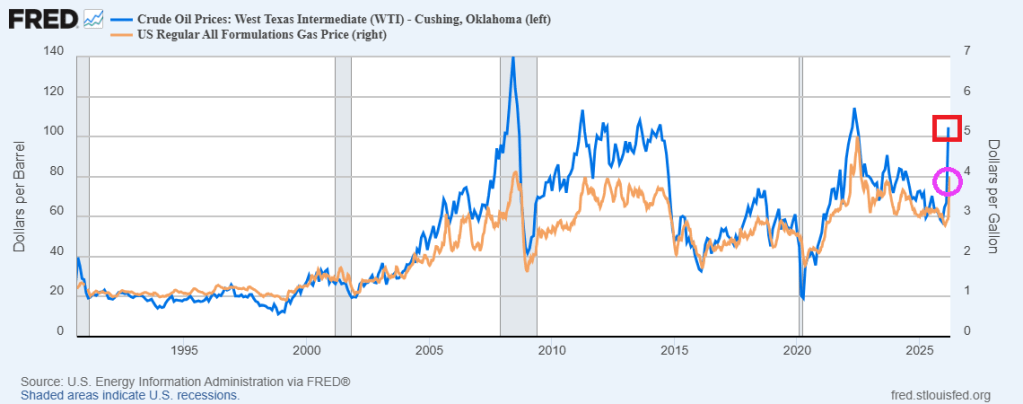
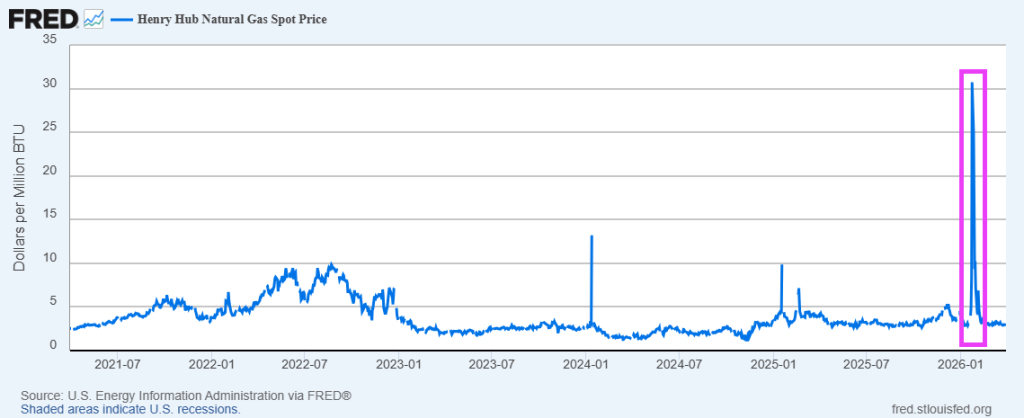
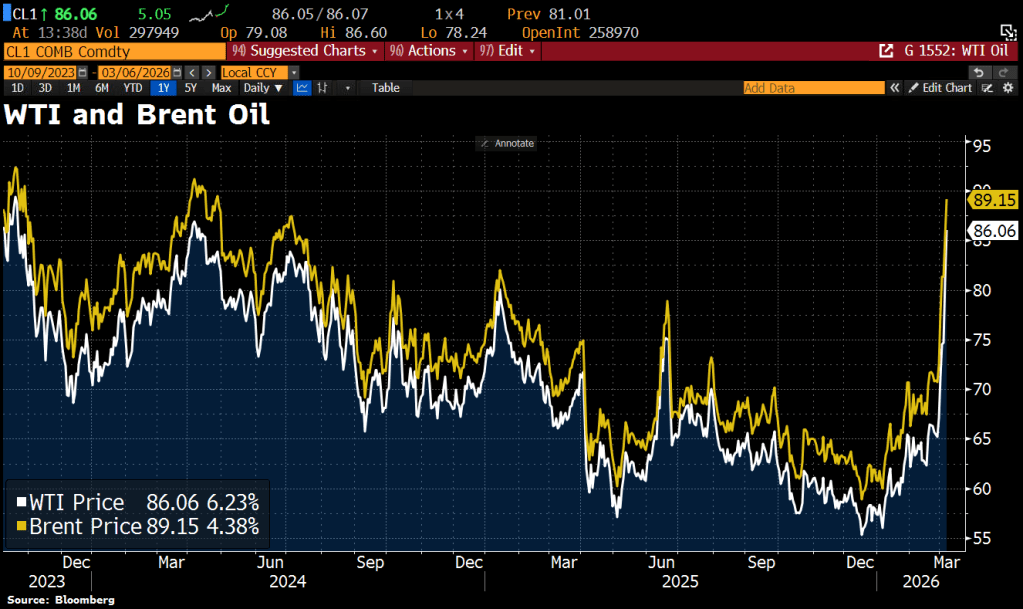
Switching to oil, we see the West Texas Intermediate and Brent Oil prices soaring on the attacks on Iran.
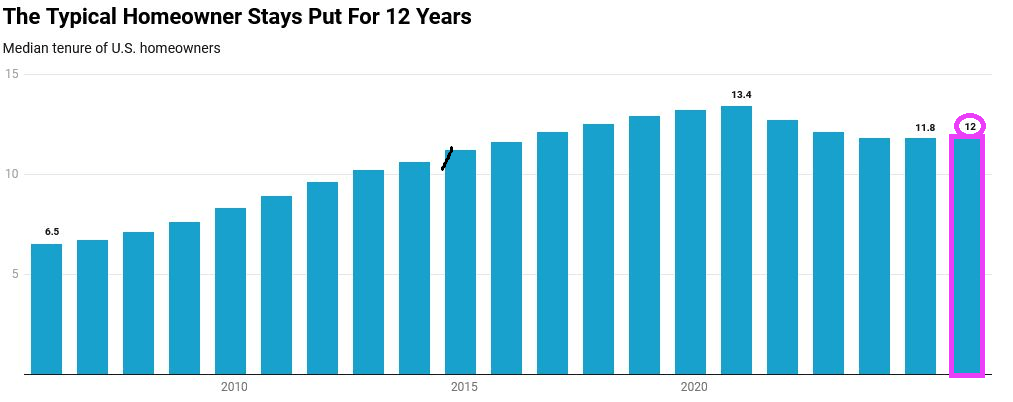
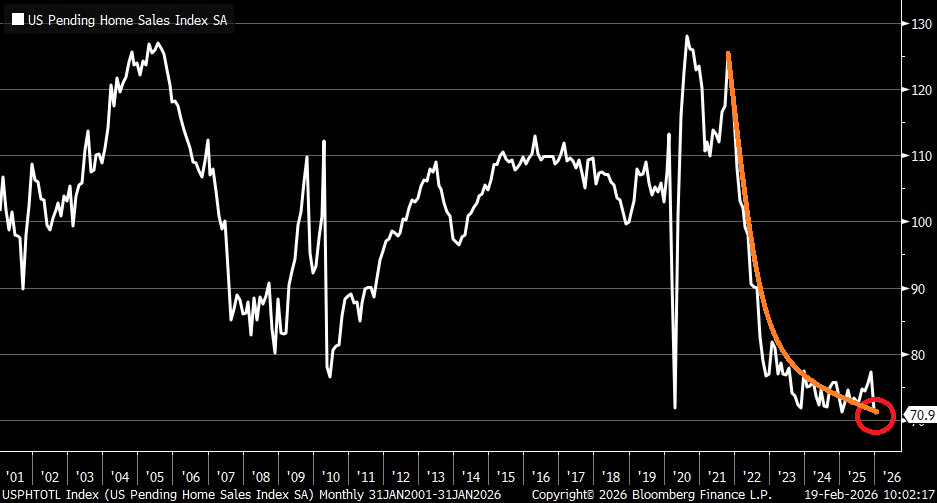
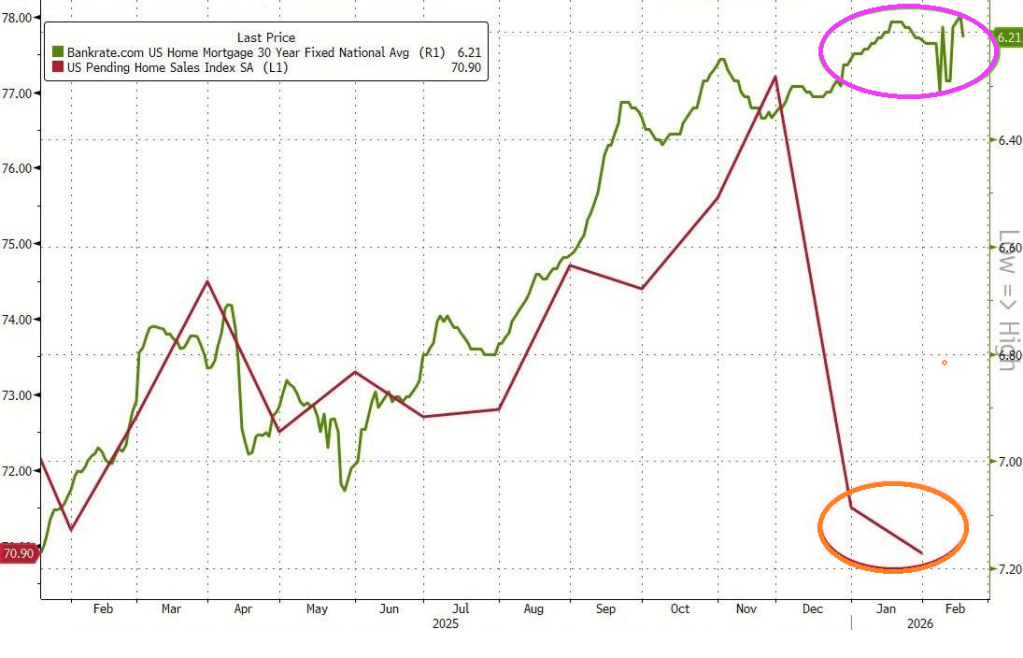
Unfortunately, US pending home sales have collapsed to the lowest level since at least 2001. Nothing has been the same since Biden/Harris administration.
Mortgage rates are still too high by historic standards.
Speaking of Democrats running the economy, New York’s mayor Zoran Mandami (the Ugandan Communist) is seeking to raise property taxes to 9.5% which will hit EVERY New Yorker, not just the billionaires he allegedly wants to tax.
Rate-cut expectations have surged (dovishly) higher this week (along with tumbling Treasury yields) amid a mixed macro picture (Labor market ‘good’, Retail sales bad, Housing ugly).
Today could change all that as CPI for January prints with risk skewed to the upside. January brings annual resets and they tend to surprise on the high side.
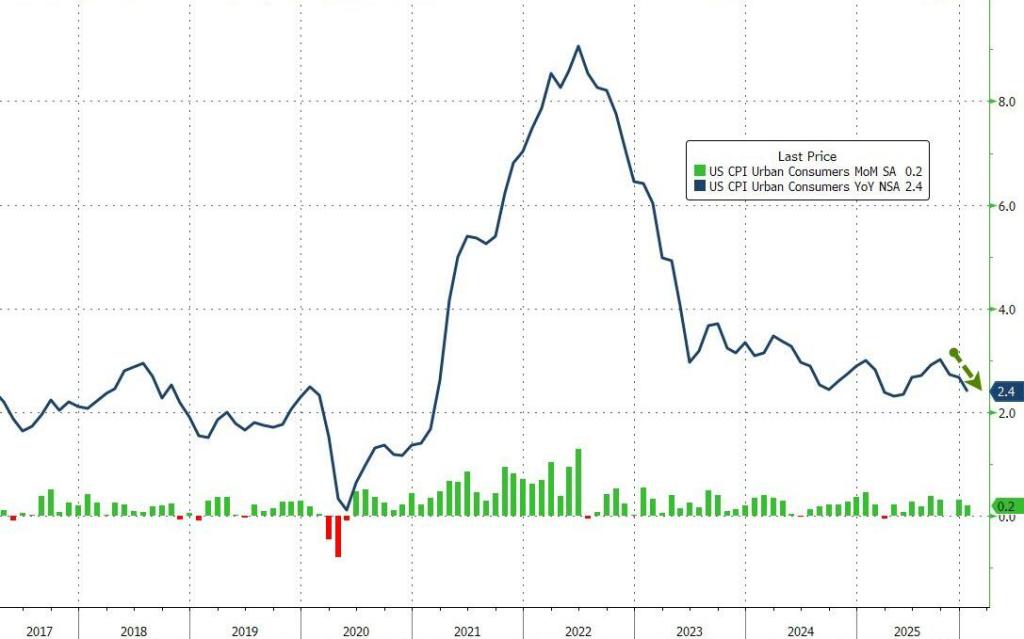
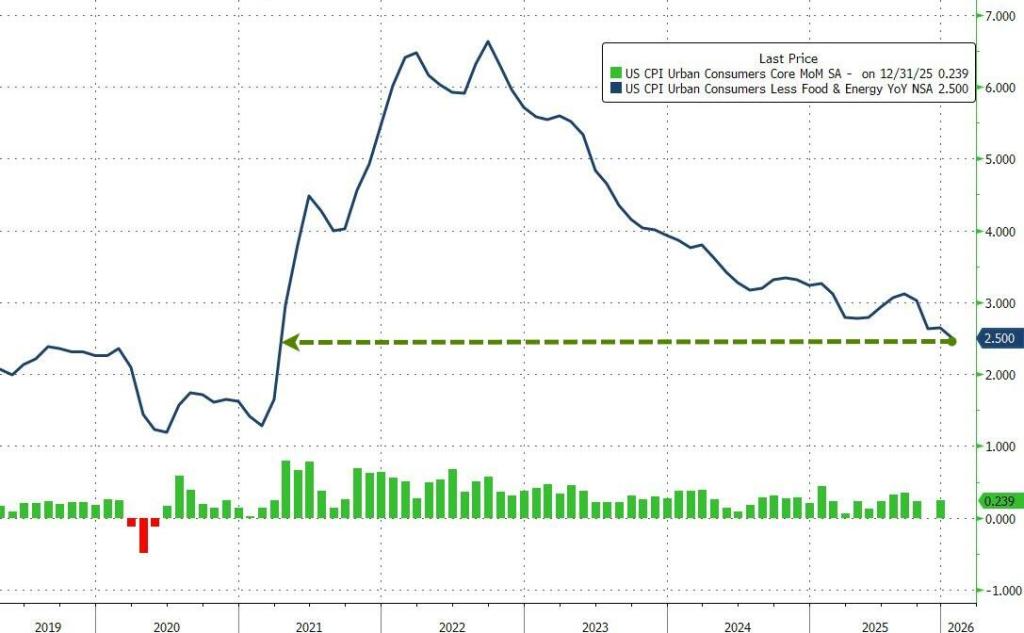
Despite the ‘hot’ whisper numbers (and 4 previous Januarys in a row of upside surprises), headline consumer price inflation came in cooler than expected in January (+0.2% MoM vs +0.3% expected). That pulled the headline CPI down dramatically from +2.7% to +2.4% – near the lowest in 4 years.
Core CPI printed +0.3% MoM (in line with expectations), lowering the YoY change in core prices to +2.5% – the lowest since March 2021.
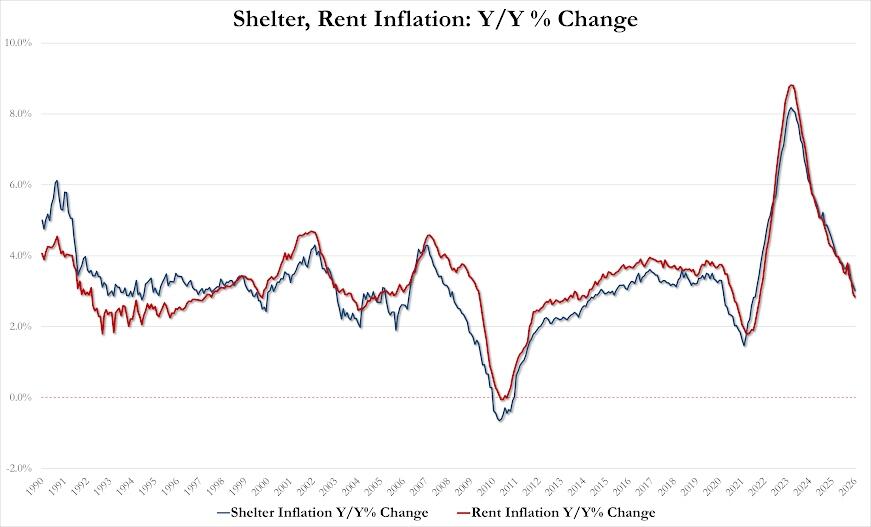
The Shelter index rose 0.2% in January and was the largest factor in the all items monthly increase. The food index increased 0.2% over the month as did the food at home index, while the food away from home index rose 0.1 percent. These increases were partially offset by the index for energy, which fell 1.5% in January.
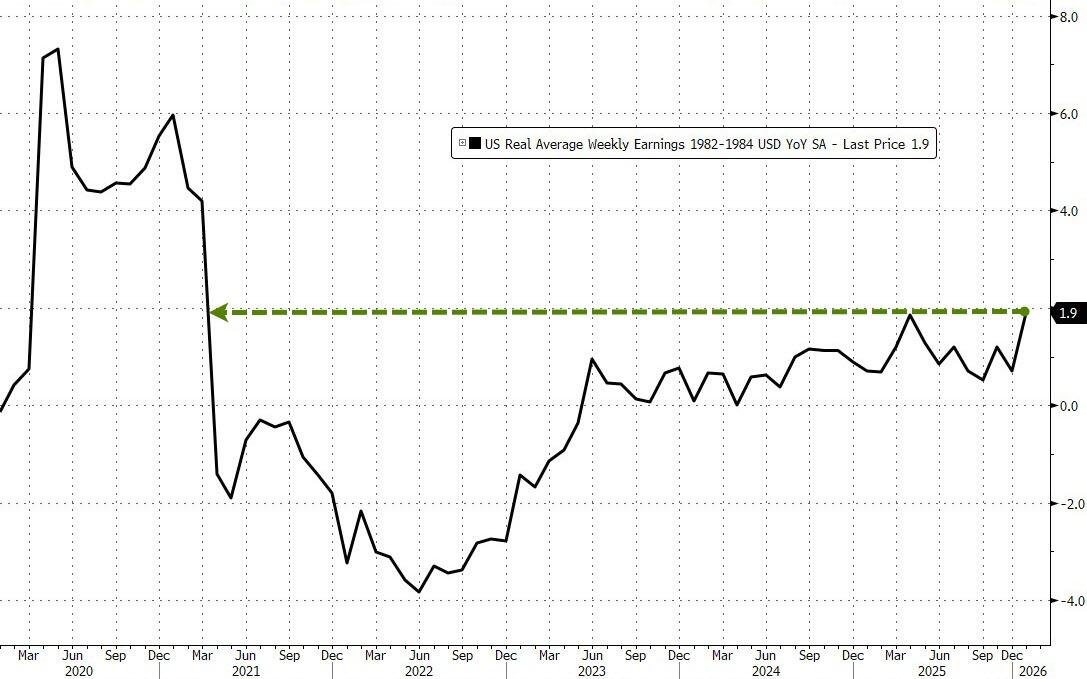
January saw real average weekly earnings rise 1.9% YoY – its highest since March 2021…
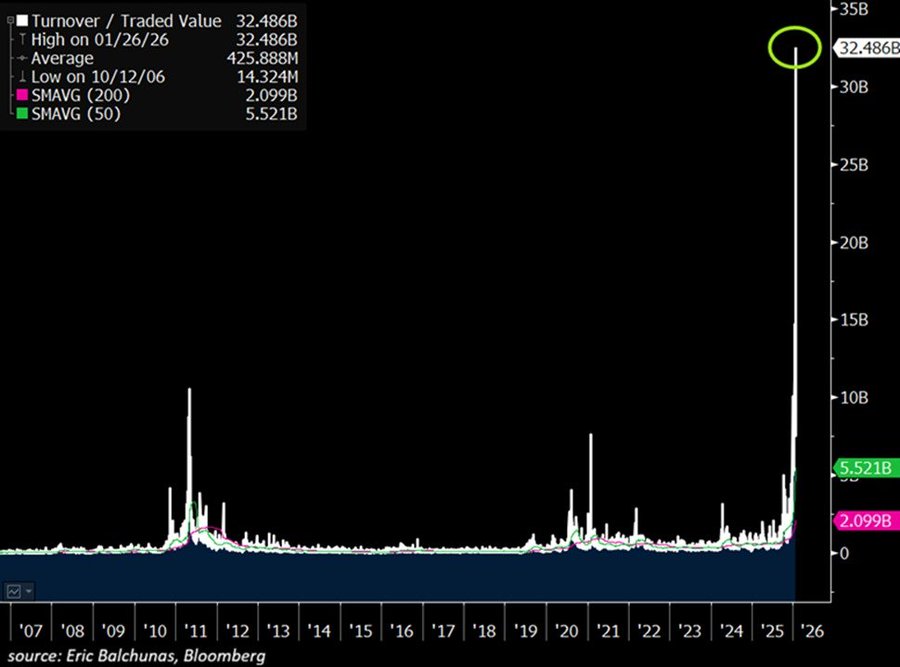
Silver ETF trading volume is exploding: Trading volume in the largest silver-backed ETF, $SLV, hit a record $40 billion on Monday.
This marks the highest turnover among any other asset and is 15 TIMES its average daily volume.
This also TRIPLES the previous peak seen in 2011.
By comparison, the S&P 500 ETF, $SPY, traded $25 billion, the Nasdaq 100 ETF, $QQQ, $17 billion, while Nvidia, $NVDA, and Tesla, $TSLA, each traded $16 billion.
Furthermore, the 2x leverage long-silver futures ETF, $AGQ, posted $8 billion in volume yesterday. The largest Gold ETF, $GLD, also saw massive turnover of $13 billion, but $27 BILLION lower than $SLV. Silver’s recent moves are truly unprecedented.
Hallelujah, I love this economy so! Of course, former First Lady Jill Biden is on the national tour trashing the economy saying it was “perfect” under Joe Biden.
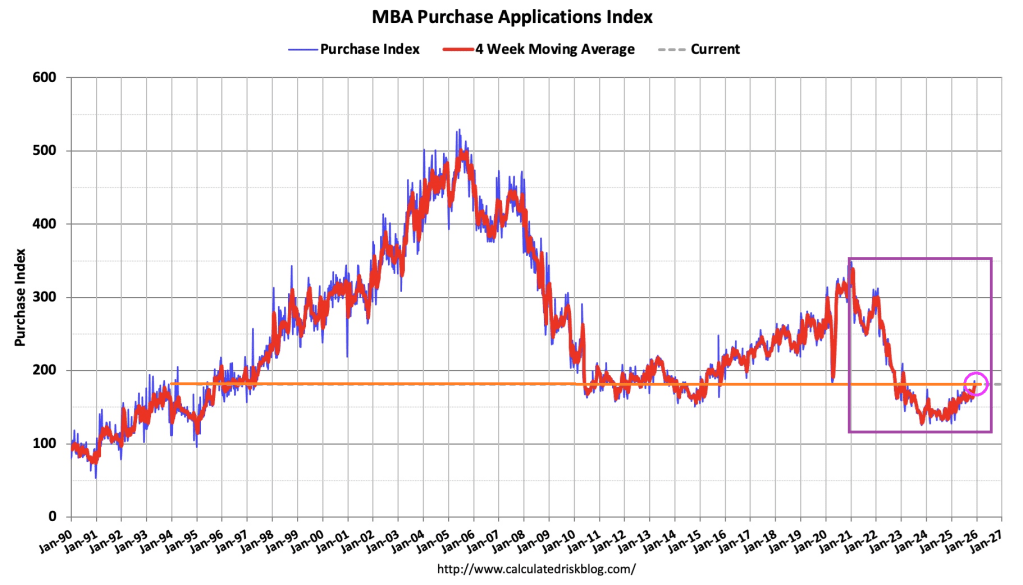
The Market Composite Index, a measure of mortgage loan application volume, increased 4.8 percent on a seasonally adjusted basis from one week earlier. On an unadjusted basis, the Index increased 49 percent compared with the previous week. The seasonally adjusted Purchase Index decreased 2 percent from one week earlier. The unadjusted Purchase Index increased 32 percent compared with the previous week and was 19 percent higher than the same week one year ago.
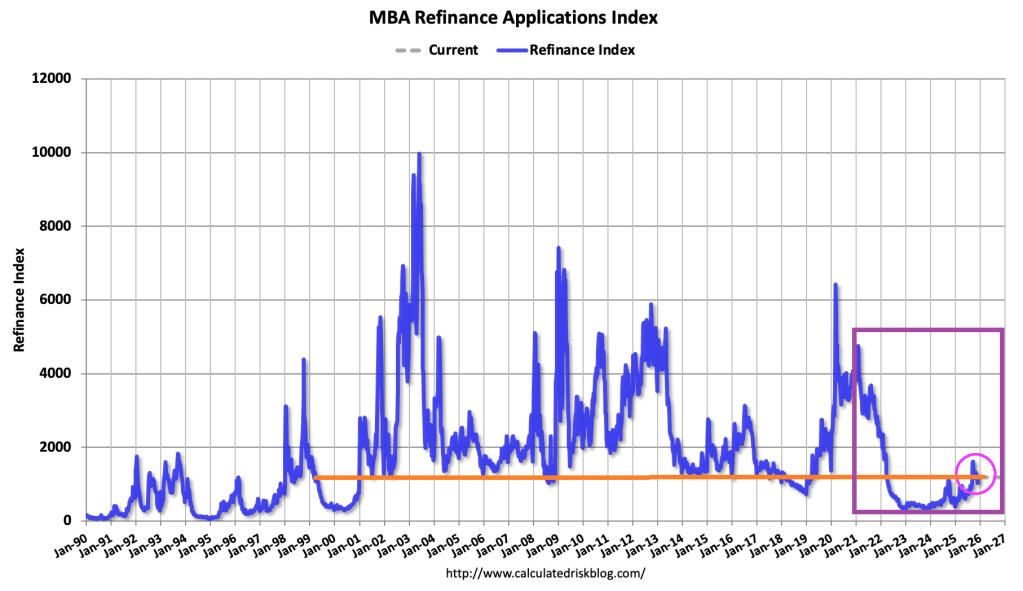
The Refinance Index increased 14 percent from the previous week and was 88 percent higher than the same week one year ago.
Compared to the prior week’s data, which included an adjustment for the Thanksgiving holiday, mortgage application activity increased last week, driven by an uptick in refinance applications,” said Joel Kan, MBA’s Vice President and Deputy Chief Economist. “Conventional refinance applications were up almost 8 percent and government refinances were up 24 percent as the FHA rate dipped to its lowest level since September 2024. Conventional purchase applications were down for the week, but there was a 5 percent increase in FHA purchase applications as prospective homebuyers continue to seek lower downpayment loans. Overall purchase applications continued to run ahead of 2024’s pace as broader housing inventory and affordability conditions improve gradually.
The average contract interest rate for 30-year fixed-rate mortgages with conforming loan balances ($806,500 or less) increased to 6.33 percent from 6.32 percent, with points increasing to 0.60 from 0.58 (including the origination fee) for 80 percent loan-to-value ratio (LTV) loans.
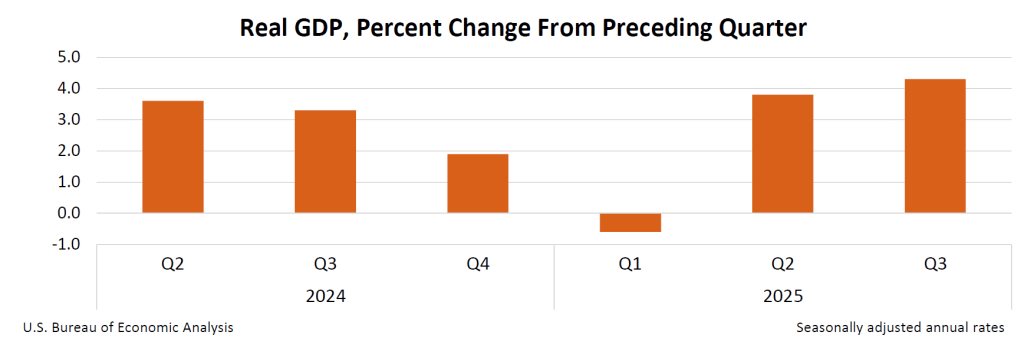
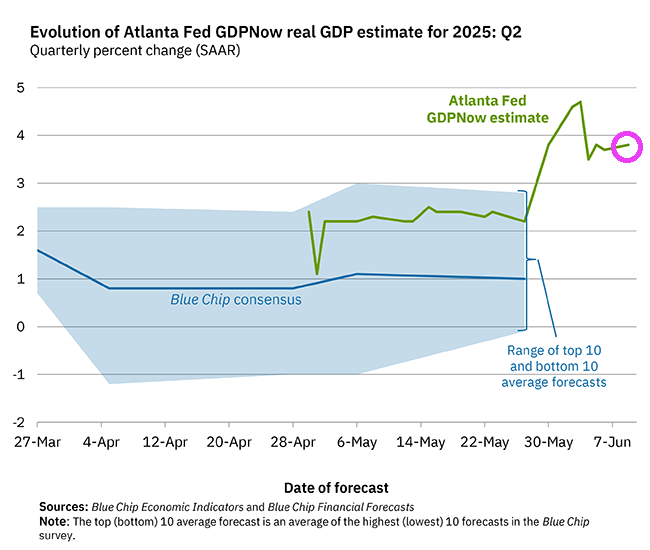
The GDPNow model estimate for real GDP growth (seasonally adjusted annual rate) in the second quarter of 2025 is 3.8 percent on June 9, unchanged from June 5 after rounding. After recent releases from the US Census Bureau and the US Bureau of Labor Statistics, a decrease in the nowcast of second-quarter real personal consumption expenditures growth from 2.6 percent to 2.5 percent was partly offset by an increase in the nowcast of real gross private domestic investment growth from -2.2 percent to -1.9 percent.
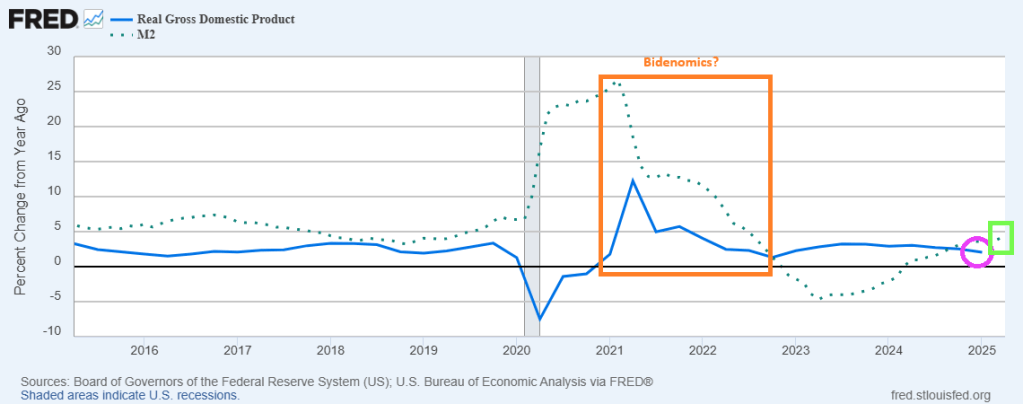
Biden relied on government hiring and Fed’s money printing to drive the US economy. And then the gas ran out.


You must be logged in to post a comment.