Gas Prices Set To Soar As Crack Spread Jumps On Tightening Fuel Supplies (Gasoline Prices UP 45% Under Biden, Diesel Prices UP 77%, Strategic Petroleum Reserve DOWN -47%)

U.S. oil refining margins, also known as the 3-2-1 crack spread, jumped to a three-month high on Tuesday — and that’s an indication the country faces an ongoing product shortage that might lead to higher gasoline and diesel prices at the pump

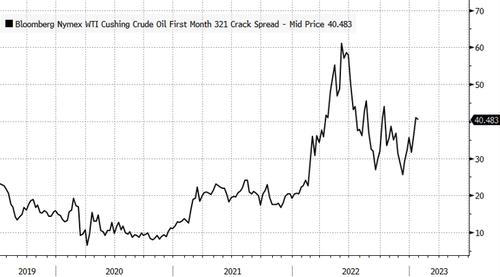
The 3-2-1 crack spread is a great indicator to gauge fuel product tightness. High spreads indicate gasoline, diesel, jet fuel, and other petroleum products are in short supply, while low spreads mean an abundance of supply. Spread direction is also important — if rising, it would mean fuel inventories are declining. 

The simple calculation of refining margins is for every three barrels of crude oil the refinery processes — it makes two barrels of gasoline and one barrel of distillates like diesel and jet fuel.

On Tuesday, the crack spread hit a three-month high of $42 a barrel. For some context, the five-year January average is $15.56.  

Reuters pointed out that refinery outages exacerbate fuel supply tightness. 

A diesel producing unit at PBF Energy’s (PBF.N) Chalmette, Louisiana, refinery was shut following a fire on Saturday. It could be out for at least a month. Exxon Mobil (XOM.N) said Monday it will perform planned maintenance on several units at its Baytown, Texas, petrochemical complex.

The ongoing refinery maintenance season could be much lengthier than usual, with many U.S. Gulf Coast refineries still running below capacity after Winter Storm Elliott knocked out some 1.5 million barrels per day of refining capacity in December. A Suncor refinery in Commerce City, Colorado, has remained offline since the storm.

Also, the number of refinery overhauls is double the amount this spring. Many of these overhauls were postponed due to the pandemic. Some are due to record-high margins driving increased profitability for oil companies. 

There are at least 15 oil refineries plan maintenance ranging from two to 11 weeks through May, tallies by Reuters and refining intelligence firm IIR Energy show. By mid-February, U.S. refiners will drop some 1.4 million barrels per day of processing capacity, double the five-year average. 

“A lot of plants didn’t want to shut down last year when margins were strong, but they have to get this work done,” said John Auers, refining analyst with Refined Fuels Analytics.

Nine U.S. refineries operated by Marathon Petroleum, Valero Energy, Exxon Mobil, Phillips 66, and BP will shutter some of their fuel-producing units this spring, according to IIR and Reuters sources.

All of the outages and planned overhauls are going to make it difficult for refiners to catch up with demand as inventories are relative to historical levels. 

“If we aren’t hearing the alarm bells, it’s because we’re deaf after refining margins reached eye-watering levels in 2022, when the 3-2-1 crack spread briefly surged above $60. But from a historical perspective, current margins are sky-high, as well,” Bloomberg Opinion’s Javier Blas said. 

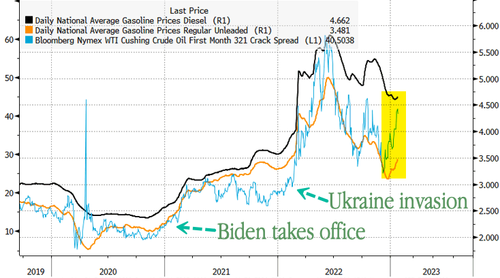
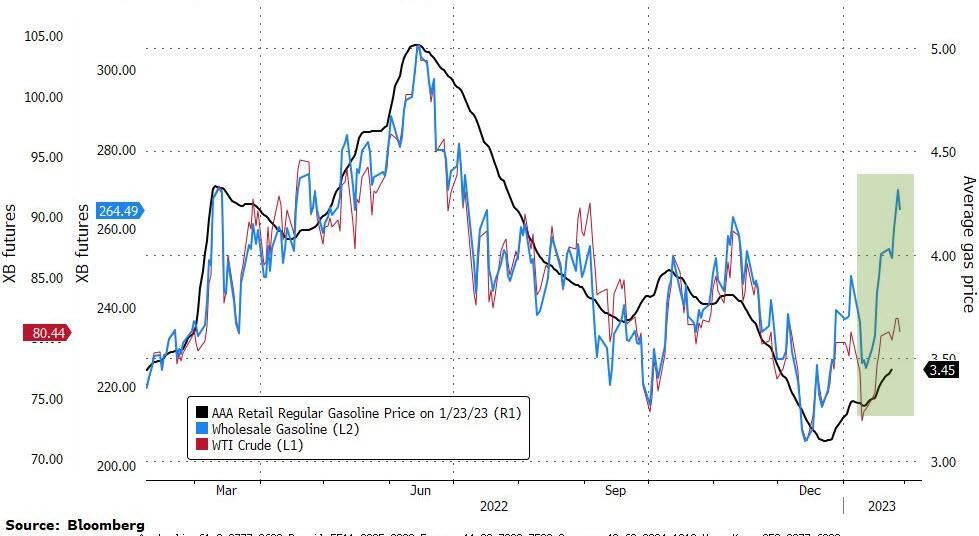
According to AAA data, gasoline and diesel prices at the pump are starting to move higher after months of declines following the rise in the 3:2:1 crack spread. 

And the ‘raw materials’ for the refining process are rising rapidly…

Perhaps the victory lap was a little premature? 

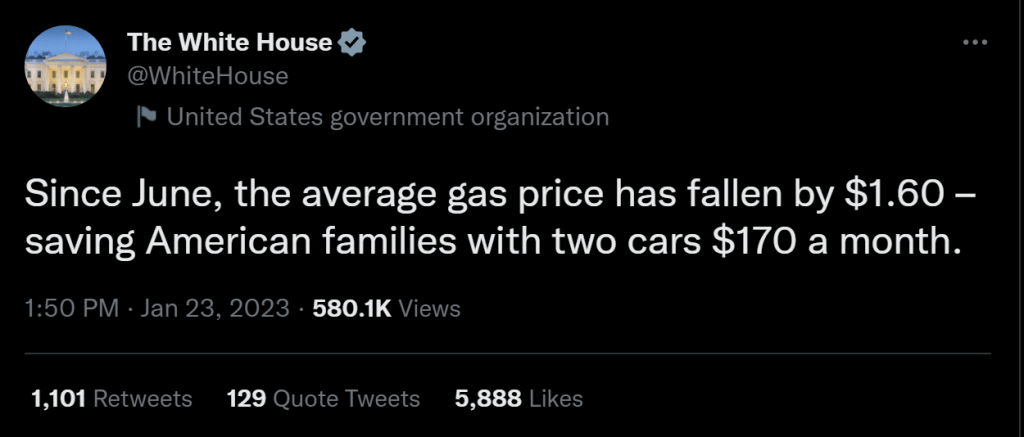
Mission Accomplished 2.0?

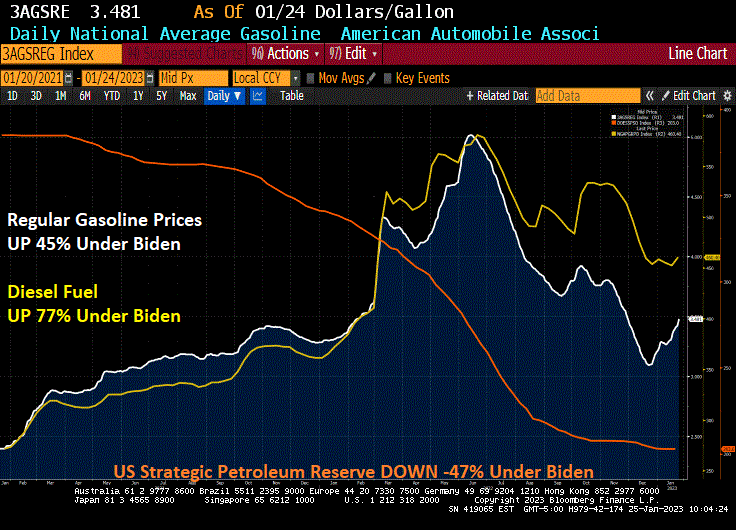
Not really. US gasoline prices are UP 45% under Biden, diesel prices (the lifeblood of the shipping industry) are UP 77 under Clueless Joe and the Strategic Petroleum Reserve is DOWN -47% under China Joe.

Winter Is Coming! Richmond Fed Outlook Declines To -11 As Philly Fed Outlook Down To -8.9 And NY Empire State Outlook Down To -32.9 (US 10Y-3M Yield Curve Inverts To -126.5 Basis Points)

Three regional Fed reports I like to watch are New York’s Empire State Outlook, Philly Fed’s Outlook and Richmond Fed’s outlook. Today, The Richmond Fed released their manufacturing outlook and … it declined to -11.

So the big three are all down (Philly down to -8.9 while NY’s Empire State outlook is down to -32.9.

On the Treasury front, the US 10Y-3M yield curve inverted further (a signal of impending recession) just tanked to -126.462 basis points.

Winter is coming!

The Secret Panel? US Yield Curve Inversion, CDS Default Price, SOFR Signals More Rate Increases Then Rate Cuts

Ah, the start of a new week with Treasury Secretary Janet Yellen arguing (with a straight face) that there is no room in the Federal budget for cuts. Apparenly, Yellen never read any of the massive, pork-laden spending bills signed by Biden (no one else did in Congress either, nor did Biden).

Let’s start with the US credit default swap (1 year). It remains high at 68.72 (the price of insuring against a US default). And the US Treasury yield curve (10Y-3M)? It remains deeply inverted at -114 basis points this morning signaling an impending US recession.

Then we have SOFR (Secured Overnight Financing Rate). SOFR futures are pricing for the Federal Reserve to hike rates a few more times and to start cutting before the end of this year. The pricing for the 2023 rate path is little changed from a month ago, but this year the market has priced in deeper cuts in 2024, with SOFR now seen below 3% by early 2025 before stabilizing. The implication is that hedging recession and significant rate cuts in 2024 now seems to be fully priced in, yet there’s a risk that the Fed cuts even deeper than the market is factoring in.

We think the market is partially preparing for the risk of even deeper rate cuts than linear instruments are pricing. To see how dramatic those are, we can look at options on SOFR futures and model what’s being priced by the volatility surface.

We are seeing the same story if we look at Fed Funds Futures data. Fed rate hikes until June, then rate cuts to follow.

How did Biden’s lawyers and now the DOJ figure out that Biden has classified documents all over the place? Probably from reading “The Hardy Boys.” Except that Biden didn’t cleverly hide classifed documents. Rather, he carelessly left them lying around at The Penn Biden Center and his home in Wilmington Delaware that he shared with his son, Hunter. And probably on the Amtrak train he would take from Wilmington to Union Station in DC. And probably at Chinatown Garden, a short walk from The White House.

United States Yield Curve 3M10Y Most Inverted In 30+ Years! (But Other Assets Signaling Cooling Odds Of Recession)

The first headline I saw when I turned on Bloomberg.com was “DOJ Officials Find More Classified Documents at President Biden’s Home.” This is an improvement! So far, the task has been handled by Biden’s private attorneys who don’t have proper security clearance; at least the Justice Department is finally getting involved!

But back to the US yield curve. It is now the most inverted in 30+ years as M2 Money growth stalls. Inverted yield curves have preceded recessions in the past.

But as China reopens and Europe is experiencing a warmer winter than expected (meaning that Europe has sufficient natural gas reserves) and US inflation cooling,

we are seeing market-implied odds of a recession falling in January.

I am still betting on a recession in the second half of 2023.

Sign Of The Times? Citi Economic Surprise Index Falls To -17.70 As US CDS (Default Insurance) And Fed Reverse Repos Remain Elevated

Its a sign of the times!

First, US default risk as measured by credit default swaps remains elevated (primarily because Biden and Democrats refused to cut wasteful spending or reign in non-retirees on Social Security). And NY Fed’s Reverse Repos remain elevated.

And then we have Citi’s economic surprise index for the US at -17 as The Fed slows money growth to 0%.

I wish I knew a place where inflation and insane Federal government spending and policies doesn’t exist.

The Thrill Is Gone! US Existing Home Sales Decline -34% Year-over-year For 17 Straight Months (Median Price Of EHS Falls -1.53% MoM)

The Thrill Is Gone from the US housing market as M2 Money growth fells to 0%.

US Existing Home Sales fell -1.5% from November to December (MoM) to 4.02 SAAR units sold. That translates to a depressing -34% decline since December 2021 (YoY).

On the positive side, these numbers are better than expected (-3.4% MoM expected). Still, these numbers are pretty dismal.

Existing home sales MEDIAN PRICE fell to $366.9k as M2 Money growth vanishes. And inventory of existing homes for sale remains lower than pre-Covid levels.

Let’s see what Powell and the Gang (aka, The Federal Reserve Board of Governors) does with interest rates going forward.

Today, the 10-year Treasury yield is up 7.1 basis points, but the real action is in Europe where sovereign yields are up 11.5 bps in France, 9.8 bps in Germany and 18.6 bps in Italy.

Janet Yellen And Treasury Tap Retirement Funds (Social Security) to Avoid Breaching US Debt Limit (US CDS Elevated To 2013 Debt Crisis Level)

US Treasury Secretary Janet Yellen has signalled that she will “tap” into Social Security to avoid breaching the US debt limit. Of course, if she does, it is unlikely that she will return the dollars.

The Credit Default Swaps 1-year for the US (insurance against default) sits at 68.55, near the highest since 2013 debt ceiling crisis.

Notice that the debt ceiling keeps on climbing once the Kabuki Theater of Democrats and Republicans is over.

The Volatility Cube for the US CDS 1 year signals that it will all be over soon.

So, Yellen and Treasury are threatening us with taking away Social Security and Medicare if we don’t agree with their lavish Pelosi-like spending sprees and debt.

And why exactly is Janet Yellen flying to China? I admit Washington DC has lousy Chinese food, but at least I hope Yellen takes Hunter Biden with her to negotiate the impending US default and debt workout.

US Housing Starts Plunge -21.8% Since Last December (But 1 Unit Starts UP 11.26% Since November)

December’s housing construction numbers are a mixed bag. On the one hand, US housing starts are down -1.36% from November to December, but down -21,8% since December 2021 (YoY).

The good news? 1-unit (single family detatched) rose 11.26% from November to December (MoM). But 5+ (multifamily) starts are down -18.91% MoM.

But 5+ unit PERMITS are up 7.14%. Perhaps Hunter Biden can now rent an apartment rather than pay his father $50,000 a month in rent for Joe’s Wilmington Delaware house.

KB Homes experienced a 68% cancellation rate in Q4 2022.

This version of The Scream is one of four made by Edvard Munch, and the only one outside Norway. It is coming up for auction at Sotheby’s in New York.

Markets Are Strange! Mortgage Applications Rise 27.9% Since Previous Week, But Purchase Applications Remain 35% Lower Than Last Year (Refi Apps 81% Lower Than Last Year)

Markets are strange.

Mortgage applications increased 27.9 percent from one week earlier, according to data from the Mortgage Bankers Association’s (MBA) Weekly Mortgage Applications Survey for the week ending January 13, 2023. But mortgage applications are 60% lower than the same week last year.

The Refinance Index increased 34 percent from the previous week and was 81 percent lower than the same week one year ago. The seasonally adjusted Purchase Index increased 25 percent from one week earlier. The unadjusted Purchase Index increased 32 percent compared with the previous week and was 35 percent lower than the same week one year ago.

Here are the stats.

One lender in particular, Wells Fargo, smells blood in the economic waters, and has cut back mortgage originations.

Just remember, mortgage applications generally rise in the first part of the year until May, then start slowing until the last week of the year. This is called seasonality. But despite the fast growth this year, purchase applications are still down -35% compared to last year at this time.

Trouble In Potomac City! US Treasury 10Y-2Y Yield Curve Now Inverted For 135 Straight Days, Real Wage Growth Now Negative For 21 Straight Months

We got trouble in Potomac City! No, I’m not talking about the numerous Top Secret documents that Biden carelessly left in his garage in Delaware and the UPenn Biden Center. And they found more over the weekend. I’m talking about the US Treasury 10Y-2Y yield curve being inverted for 135 straight days. And thanks to inflation, REAL wage growth has been negative for 21 straight months.

All this is happening while M2 Money growth (green line) stalls to 0% YoY.

Swaps 5Y are rising as The Fed withdraws monetary stimulus.