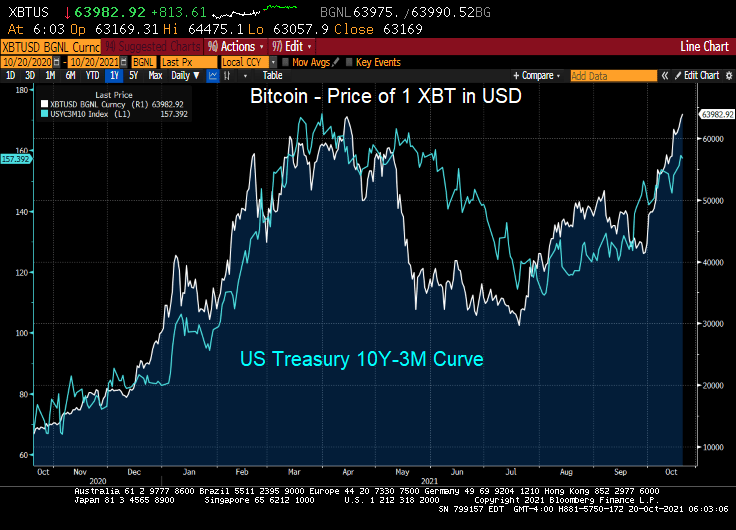
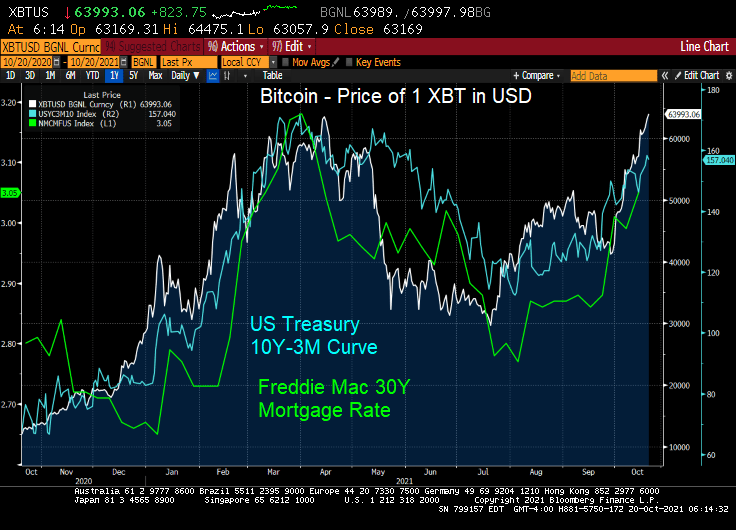
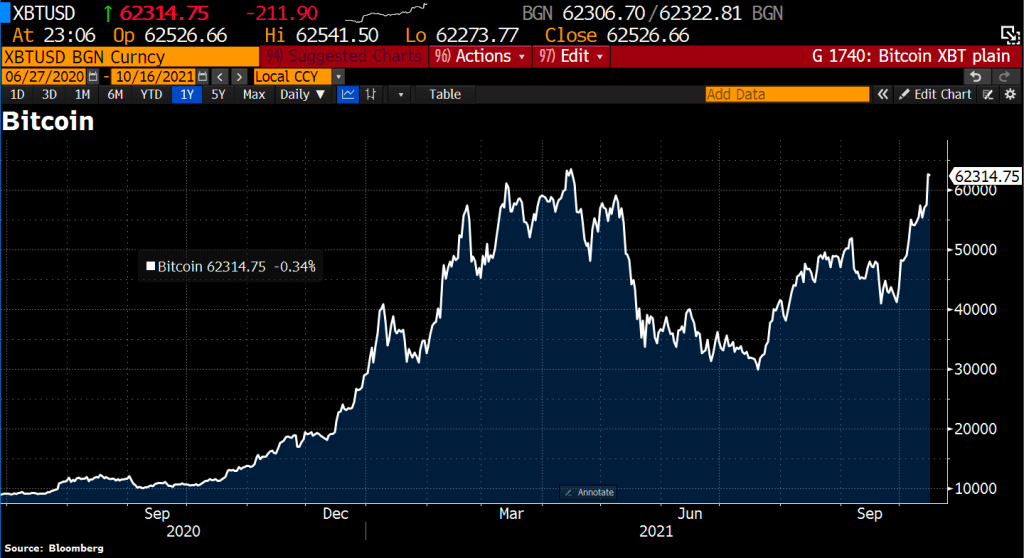
I have no idea why Jack Dorsey tweeted “705742.” But I do know that Bitcoin hit 63,982.92 this morning as the US 10Y-3M curve has been steepening.
Since the 3-month Treasury yield has been repressed to near zero, the 10Y-3M curve is pointing to rising 10-year yields. Which likely means that 30-year mortgage rates will be rising too.
UPDATE! Bitcoin hits 66,615 as Proshares Bitcoin Strategy E rises as well.
At least the Atlanta Fed’s President Raphael Bostic finally admitted that inflation isn’t as transitory as he previously believed. The Fed dumped trillions in liquidity into an economic system that was unprepared for it, and he is surprised that prices are going nuts?
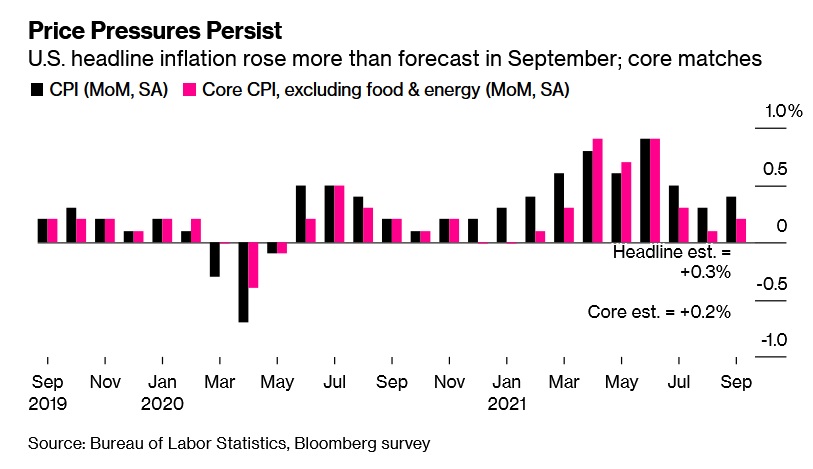
The consumer price index increased 0.4% from August, according to Labor Department data released Wednesday. Compared with a year ago, the CPI rose 5.4%, matching the largest annual gain since 2008. Excluding the volatile food and energy components, so-called core inflation rose 0.2% from the prior month.
Price Pressures Persist
U.S. headline inflation rose more than forecast in September.
Source: Bureau of Labor Statistics, Bloomberg survey
The median estimate in a Bloomberg survey of economists called for a 0.3% monthly gain in the overall measure and a 0.2% advance in the core rate.
A combination of unprecedented shipping challenges, materials shortages, high commodities prices and rising wages have sharply driven up costs for producers. Many have passed some portion of those costs along to consumers, leading to more persistent inflation than many economists — including those at the Federal Reserve — had originally anticipated.
The pickup in price growth seen last month reflected higher food and shelter costs. Meantime, measures of used cars and trucks, apparel and airfares cooled.
U.S. equity futures fluctuated and Treasury yields were little changed following the report.
Hotels, Rents
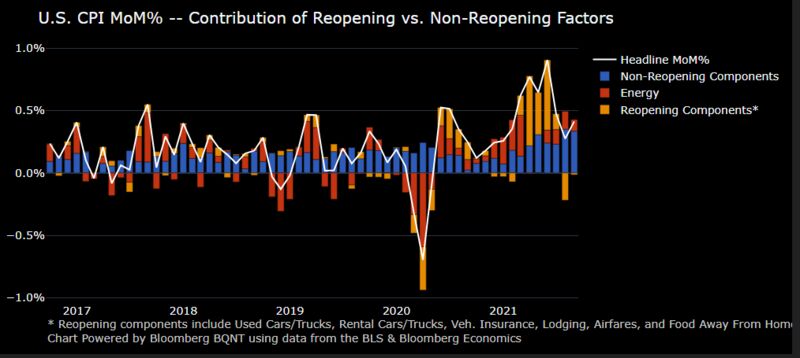
The CPI data reflects crosscurrents in the economy. Hotel fares fell, reflecting the impact of the delta variant on travel, but inflation is broadening out beyond categories associated with reopening.
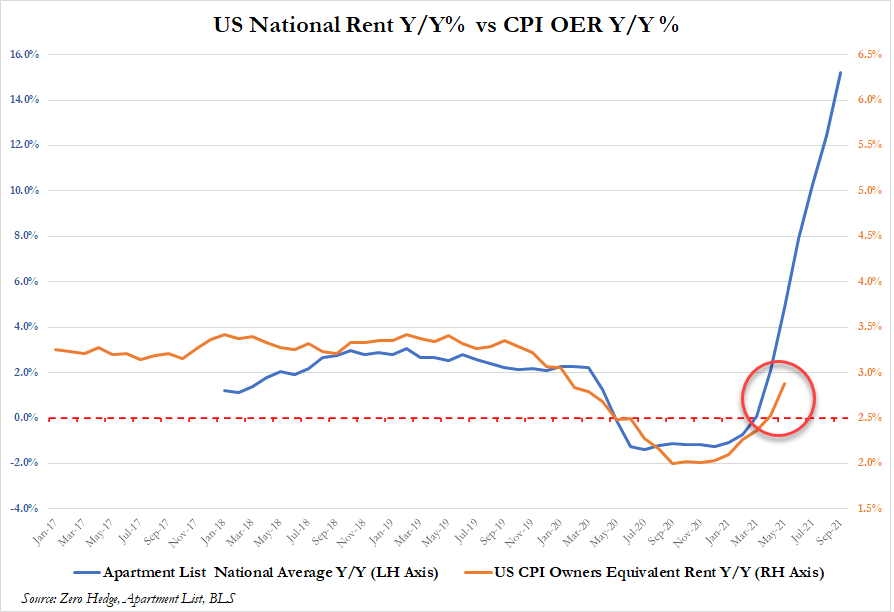
Higher home prices are now starting to filter through in the data. Rent of primary residence jumped 0.5%, the most since 2001, while a measure of homeowners’ equivalent rent posted the biggest gain in five years. Shelter costs, which are seen as a more structural component of the CPI and make up about a third of the overall index, could prove a more durable tailwind to inflation.
Non-reopening components in CPI have larger contribution to September increase
The report will likely reinforce the Fed’s inclination to soon start tapering its asset purchases, especially as the supply-chain challenges plaguing businesses show little signs of abating. Minutes from last month’s Federal Open Market Committee meeting — out Wednesday afternoon — will provide further insight on policy makers’ views toward progress on employment and inflation goals for tapering.
A New York Fed survey out Tuesday showed U.S. consumers’ expectations for inflation continued to rise in September, with 1-year and 3-year expectations accelerating to record highs.
American consumers are also experiencing higher prices for new vehicles and household furnishings and supplies, which increased by a record 1.3%, the report showed. And looking ahead, elevated energy prices are set to take an additional bite out of workers’ paychecks.
While we know that apartment rents are growing at 15.5% YoY, the CPI for Owner’s Equivalent Rent only rose by 3.2% YoY.
Appropriately, the song “The Morning After” is from the liquidity disaster film “The Poseidon Adventure.”
Here is chart of Bitcoin, Ethereum and the US Dollar Index after The Fed’s announcement yesterday at 2pm EST. The US Dollar fell and Bitcoin/Ethereum rose.
And then we have Evergrande bonds, hovering around $30 (down from par of $100). Waiting for the next shoe to drop.
The next Federal Reserve Open Market Committee (FOMC) meeting is next week with an announcement on Wednesday, September 22nd.
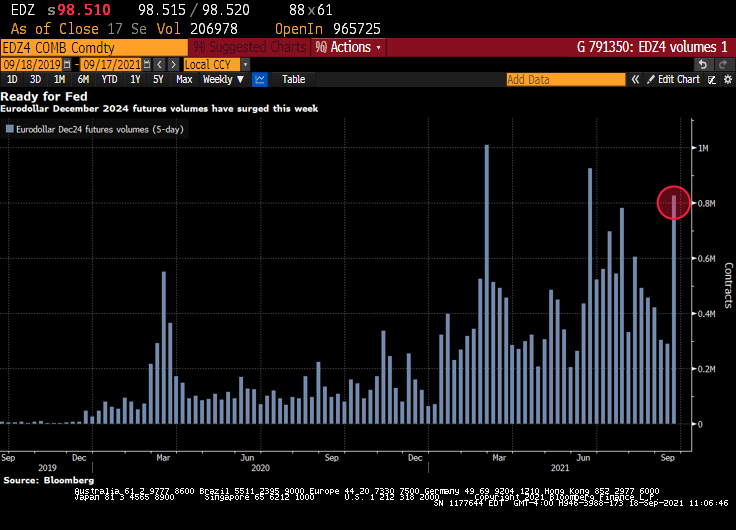
(Bloomberg) — Volume in the December 2024 eurodollar futures contract has surged Friday, approaching 200k, highest in the strip. Weekly volume exceeds 800k ahead of next week’s FOMC meeting. The December 2024 contract is a proxy for the Fed’s taper timeline, similar to the belly of the Treasuries curve (aka, the belly of the beast).
As of 2:30pm ET, nearly 197k Dec24 eurodollar contracts had traded, bringing weekly total to 816k, third most in its lifetime; notable flows on the day have included three block trades for 5k each:
The contract also appeared in curve trades including 9.3k Sep24/Dec24 3-month, 18.9k Dec23/Dec24 12-month and 24.8k Dec22/Dec24 24-month
The Dec22/Dec24 eurodollar spread has been in the spotlight since Morgan Stanley recommended the steepener in June as a way to exploit the disconnect between expectations for the pace and timing of Fed rate increases
As of today, we see a kink in the US Dollar Swaps curve at 21m.
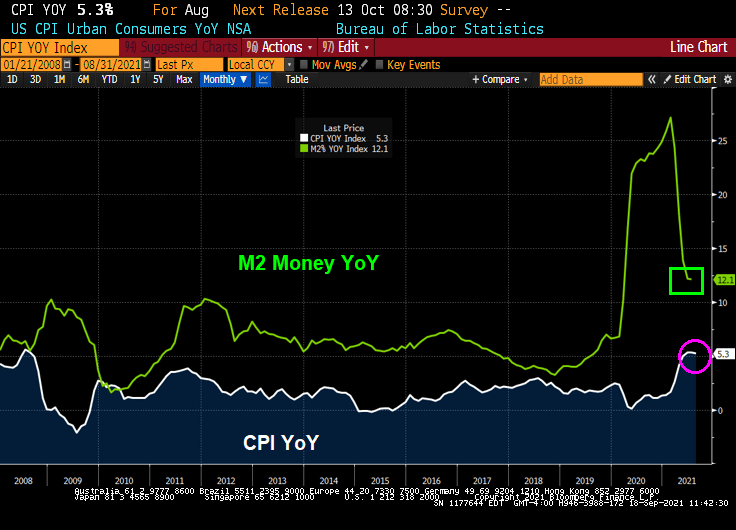
With inflation the highest since 2008, and M2 Money still growing at 12.1% YoY, it is time for The Fed to take it foot off the accelerator pedal.
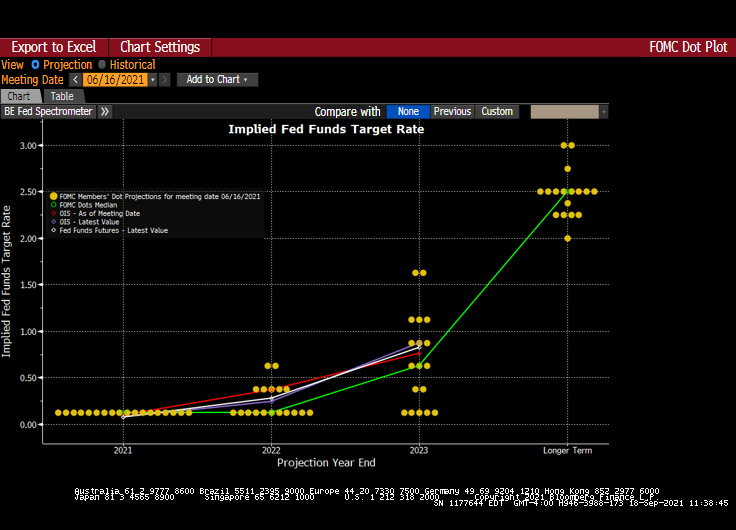
The Fed’s Dots Plot as of the last FOMC meeting indicates a willingness to let the Fed Funds Target rate start rising again after over a decade of rate suppression.
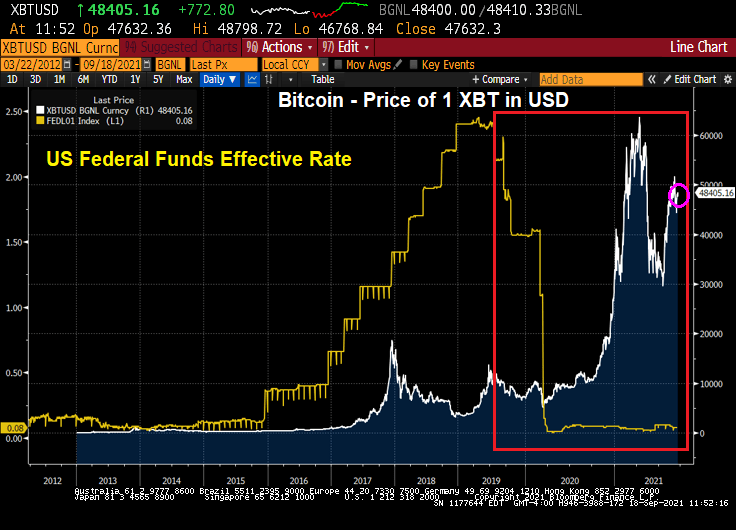
Given the fear of The Fed tapering (eventually), is it any wonders alternative investments such as Bitcoin have risen as The Fed cut rates?
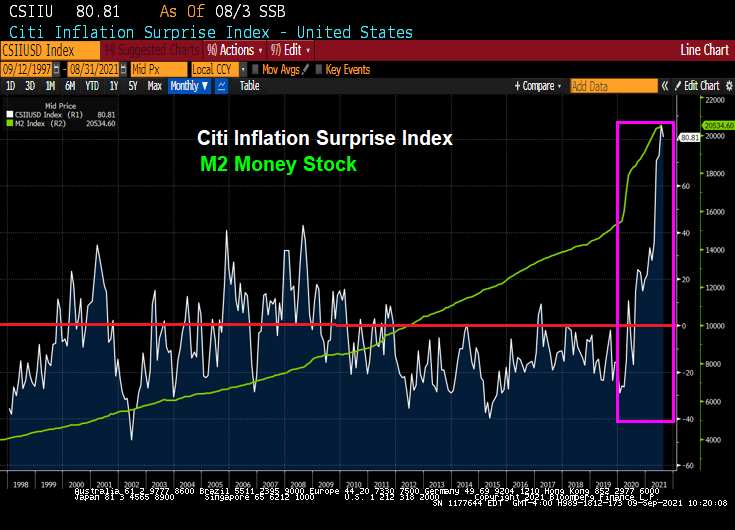
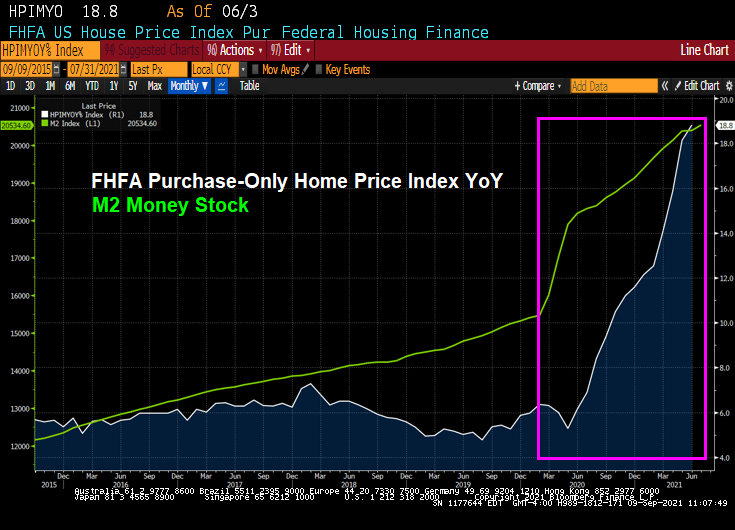
Covid struck in early 2020 and The Fed spiked the punchbowl with a massive surge in M2 Money. Like a storm surge.
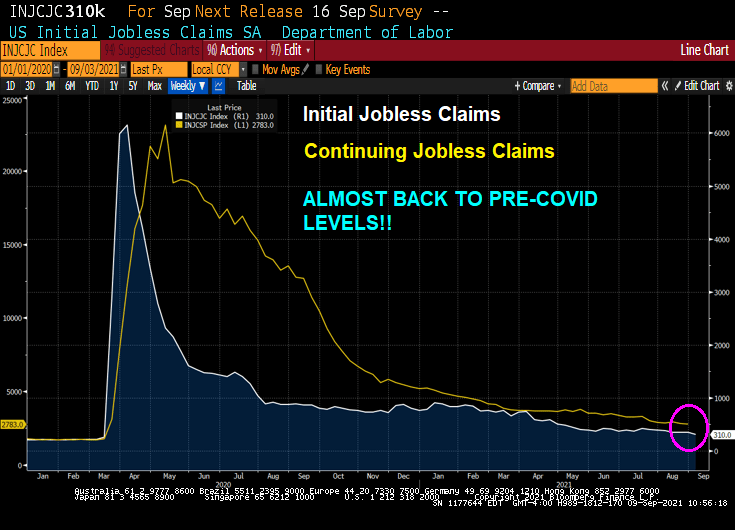
Today’s unemployment report showed initial jobless claims and continuing jobless claims ALMOST at pre-Covid levels.
So it appears that The Fed’s job is done (under the assumption that The Fed had anything to do with the recovery).
So did The Fed almost violently overreact to the Covid crisis? The Atlanta Fed’s Raphael Bostic says it is too early to withdraw while St Louis Fed’s James “Bully” Bullard says it is time to taper.
Really Raph? 18.8% price growth is not enough for you?
What if inflation is actually transitory like The Federal Reserve has been saying? Or is The Fed really telling us about an impending economic slowdown after the Fed’s and Federal government stimulypto wears off?
Iron ore prices have slowed noticeably after peaking earlier this year. Lumber futures (random length) have crashed to pre-Covid levels.
On the other hand, food stuffs and raw industrials remain elevated, but the growth in price has stalled (see pink box).
President Biden, aka The Kabul Klutz, is now recommending tax increases as a result of the terrible jobs report from Friday. Rather than focus on The Fed’s monetary stimulus not working for the labor market.
The problem with fiscal stimulus is that the debt lasts forever but the GDP effects are short-lived. And The Fed is a crazy train.
Well, after the dismal ADP print we knew that the August jobs numbers would be worse than imaginable. And they were!
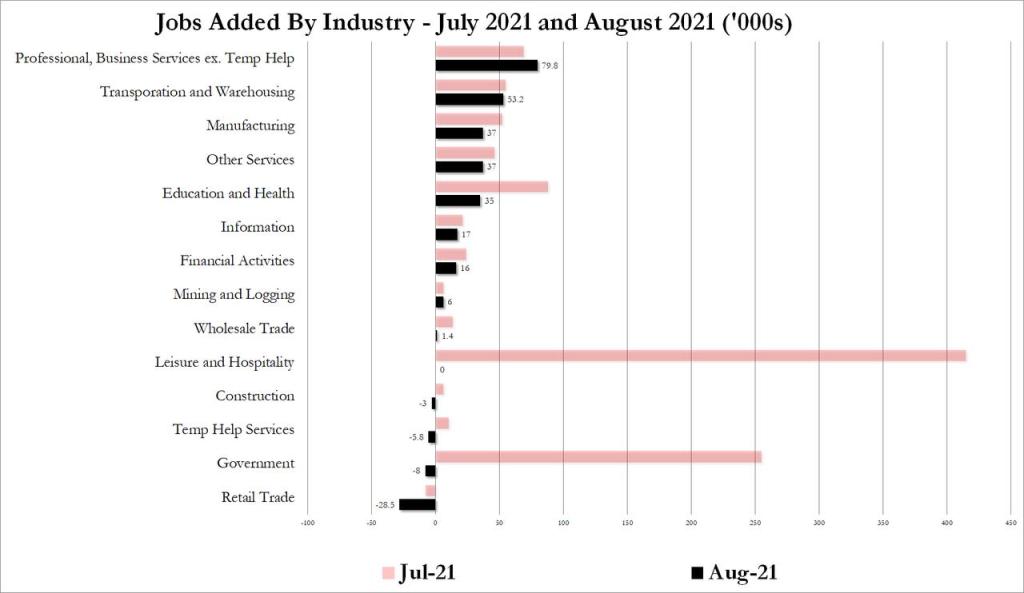
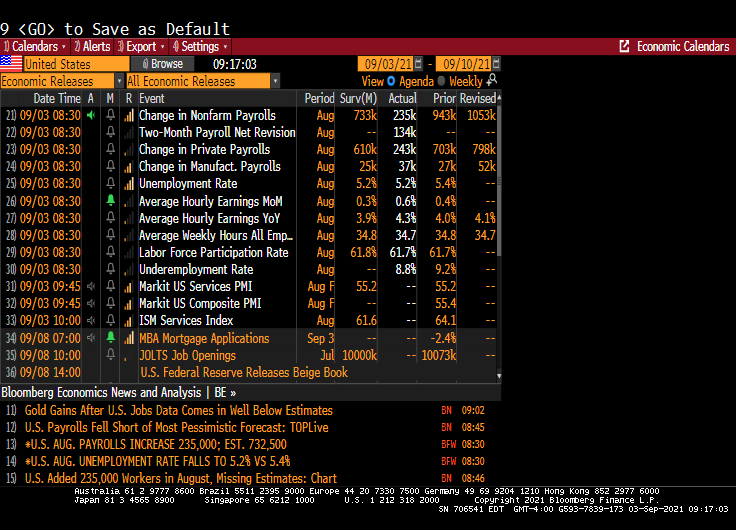
A big miss on the topline job creation number — the establishment survey suggested only 235,000 jobs were created in August, versus expectations for 733,000 — has undercut what little chance there was left of a Fed announcement on tapering later this month. It should make for a very interesting debate among policy makers about forward momentum in the labor market.
The shocker was in the leisure and hospitality sector, which created zero new jobs on net in August after figures of around 400,000 in each of the previous two months. There was a dip in hiring in other service sectors too, but nowhere near as significant. That could perhaps be due to some early impact from the spread of the delta variant in recent weeks.
On the household survey, the numbers looked better. According to those figures, the unemployment rate fell to 5.2%, in line with estimates, thanks to a 509,000 increase in reported employment. That also propelled the prime working-age employment to population ratio to 78%, from 77.8% in July.
Disparities narrowed in August as well, according to prime working-age EPOP ratios by race and ethnicity. Prime working-age Black EPOP, in particular, jumped to 73% from 72.2% the month before — outpacing the rest.
Equity futures pared a modest gain after the release, with contracts on the S&P 500 Index flat as of 9:09 a.m. in New York. With wages climbing, Treasury yields rose, with those on 10-year notes rising 4 basis points to 1.33%. The Bloomberg Dollar Index was down 0.3%.
The unemployment rate dropped which a misleading headline. That simply means that more people dropped out of the labor force than were unemployed. Not a good way to lower the unemployment rate.
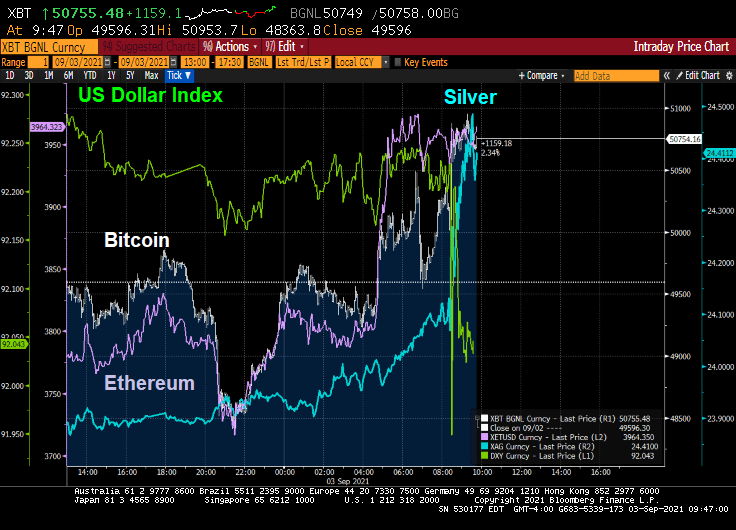
Alternative investments silver, Bitcoin and Ethereum rose on the lousy jobs report as the US Dollar dropped.
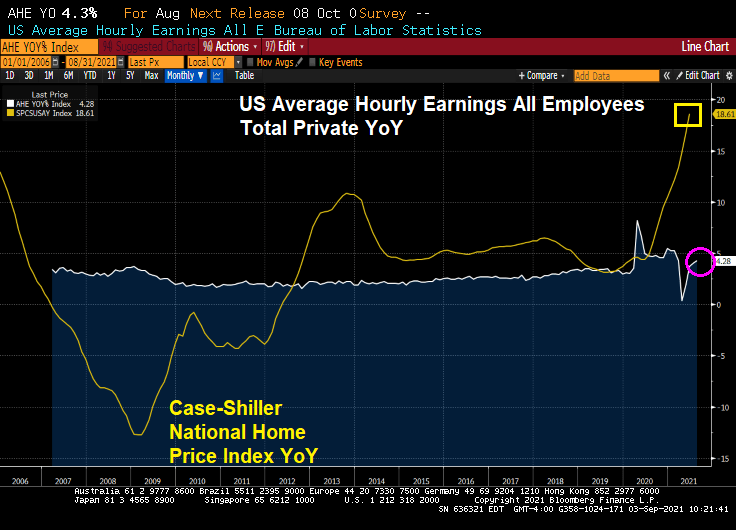
The good news? US Average Hourly Earnings All Employees Total Private YoY rose to 4.28%! The bad news? US home prices are rising at a 18.61% pace.
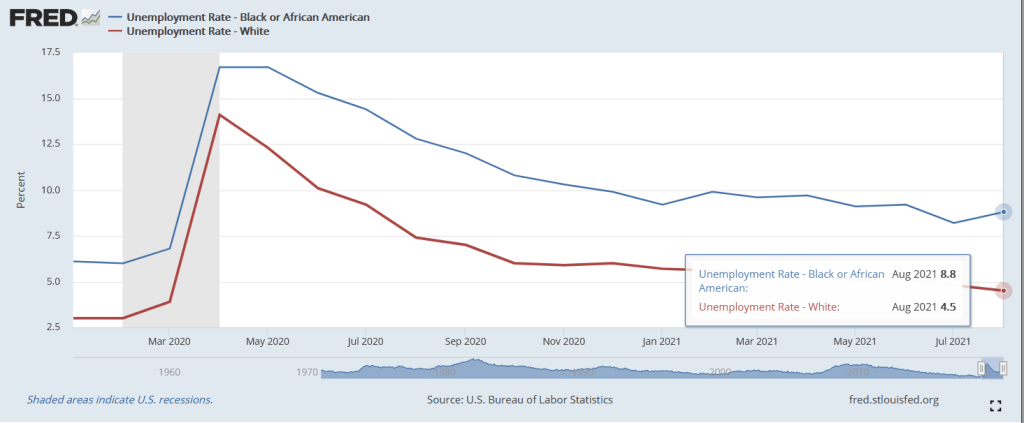
The bad news? Black unemployment rose to 8.8% in August while white unemployment fell to 4.5%. This represents a widening of the employment gap that is higher in August than pre-Covid.
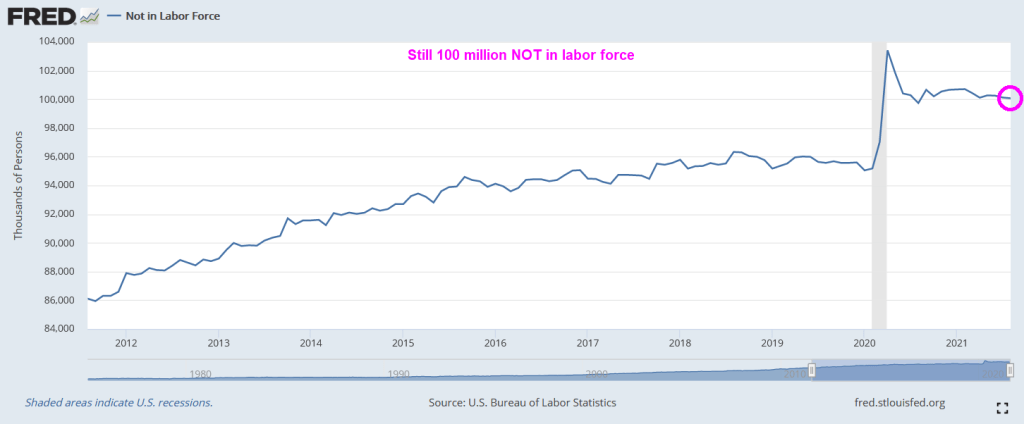
There are still over 100 million NOT in the labor force, higher than pre-Covid.
So, The Fed’s plans to begin tapering have gone up in smoke.
At the annual Jackson Hole (aka, J-Hole) Economic Symposium, Federal Reserve Chairman Jerome Powell reiterated that the Fed is in no hurry to either taper asset purchases immediately or aggressively. Additionally he made crystal clear that even when the Fed does eventually start tapering asset purchases (likely November or December), it should not be taken as signaling interest rate hikes will follow on some preset course. Indeed, Fed Chairman Powell continues to claim that inflation is transitory. Finally, he said that part of the mandate (employment) is still far from being achieved. So, expect more SNAKE JUICE.
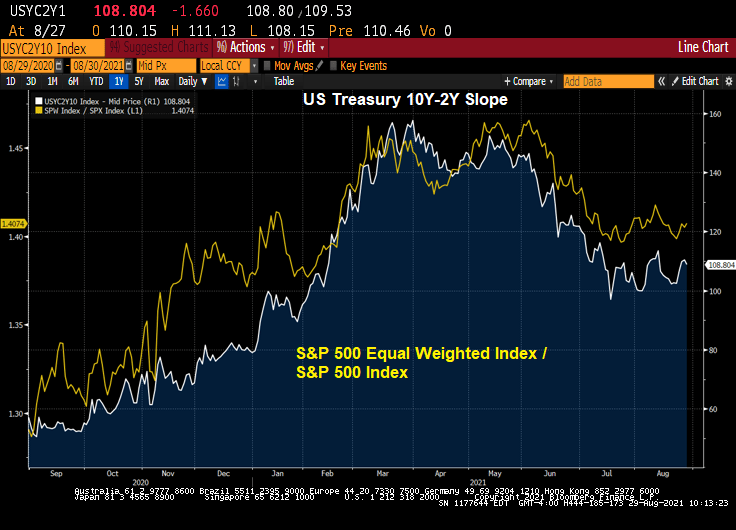
The shape of the yield curve has been highly influential recently in relative performance trends between various areas of the market. From last summer through May of this year, the steepening of the yield curve coincided with healthy outperformance of cyclical stocks. Since May, the flattening of the curve has coincided with more defensive (or at least high quality) leadership out of the tech and health care sectors. The logic goes, therefore, that a re-steepening of the curve should coincide with a shift back to cyclicals. Indeed, that shift may be in the early innings.
Let’s take a look at the US Treasury 10Y-2Y curve slope over the past twelve months against the Citi Economic Surprise Index for the US. You can see curve fatigue starting in April 2021 as the Citi Economic Surprise Index turns negative.
The the more cyclical and smaller skewed S&P 500 equal weight index has started to outperform the S&P 500 again, right on queue with the yield curve re-steepening.
Industrial stocks are under-performing the broader S&P 500 index as the curve flattens.
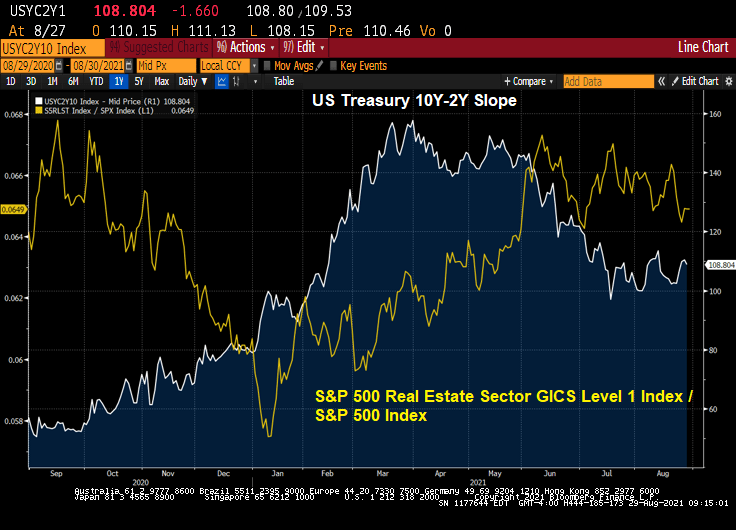
Real estate stocks? They are outperforming the broader S&P 500 index.
Mining stocks like gold mines? They are underperforming the broader S&P 500 index.
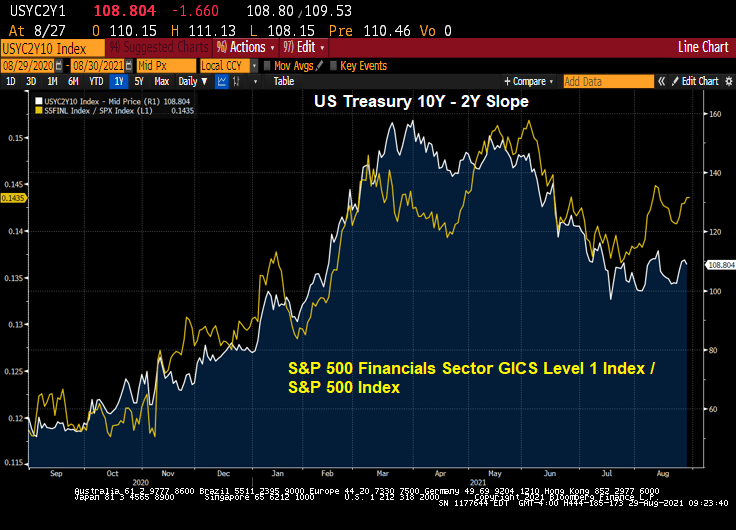
Financial stocks? Not surprisingly, The Fed’s dovish behavior is causing financial stocks to outperform the broader S&P index.
Likewise, information technology stocks are outperforming the broader S&P 500 index.
So, by Powell delaying any balance sheet slowdown and rate increases, we have clear winners (real estate, financials, information tech) and clear losers on a relative basis (industrials, retail, metals and mining).
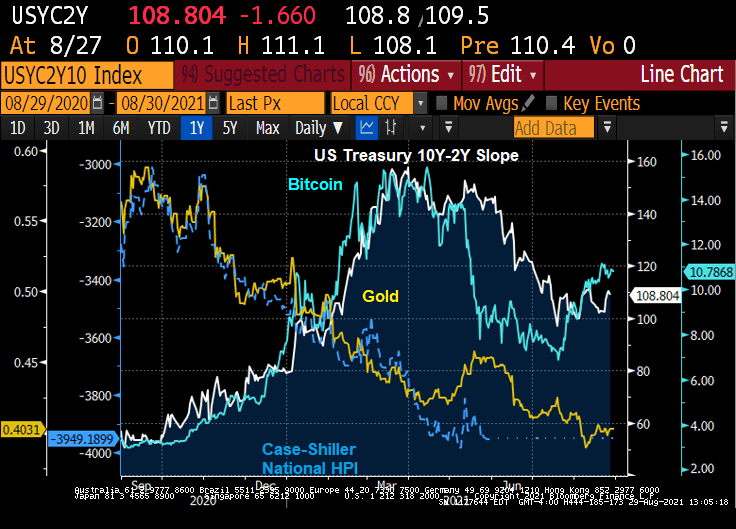
The Others! Due to volatility differences, I wouldn’t over-interpret this chart. But Bitcoin as a ratio of the S&P 500 index is “kicking ass!” Gold and housing as a ratio of the S&P 500 index seemingly can’t keep up with the S&P 500 index.





















You must be logged in to post a comment.