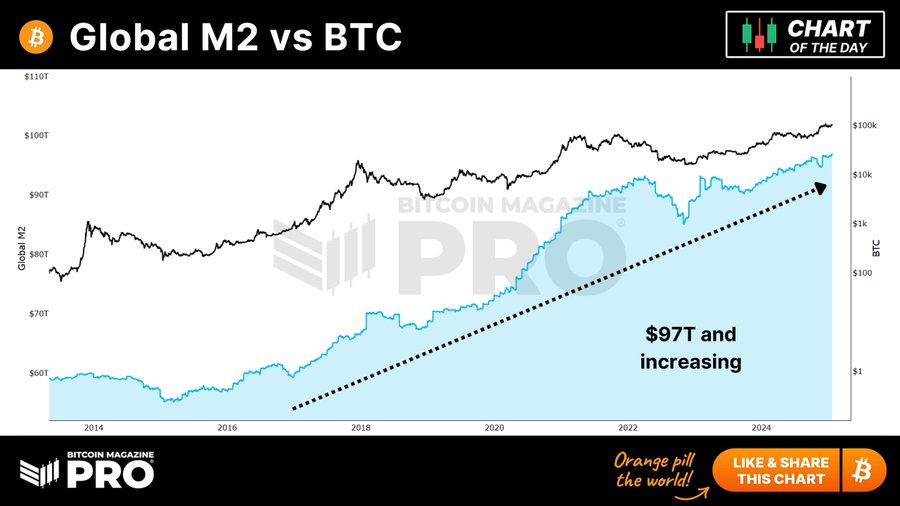
Nobel prize winner in economics, Gene Fama, said recently that cryptocurrencies will eventually be worthless. Well Gene, not if The Federal Reserve and other central banks keep printing money.
Global M2 money supply is at $97T and increasing. And with the increase in global M2, bitcoin and other cryptos are likely to keep rising.
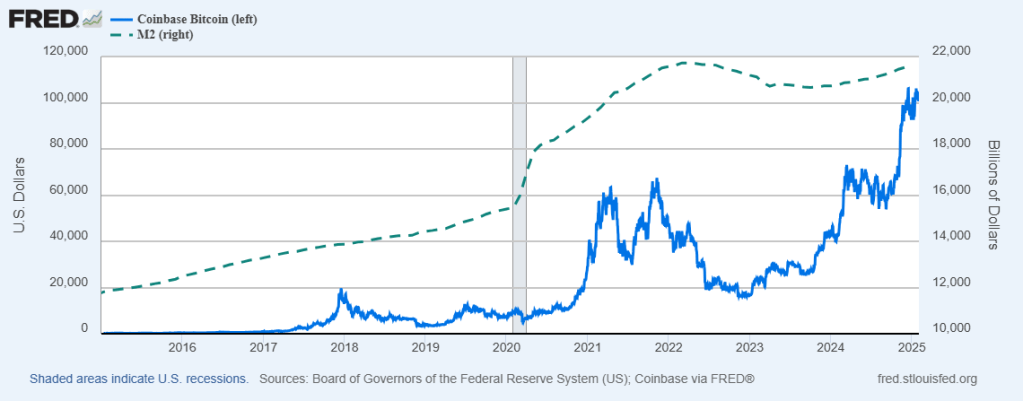
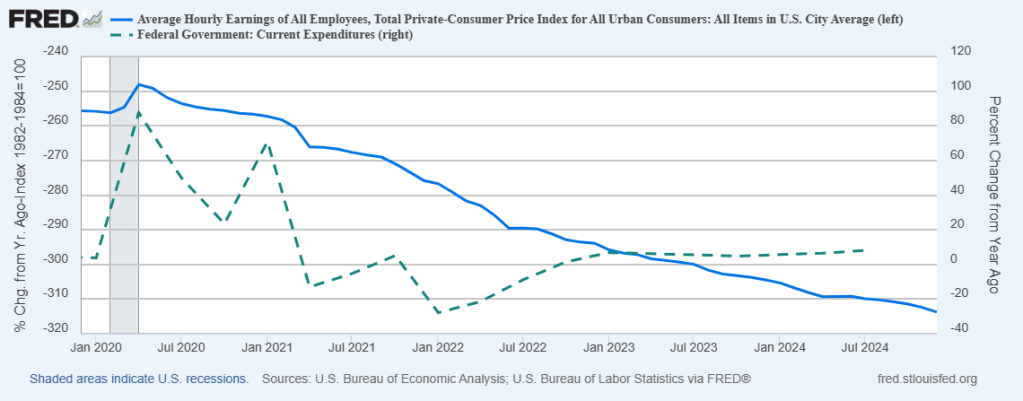
On the US side, M2 Money has increased 12.7% under reckless spending Joe Biden while Bitcoin has increased 249%.
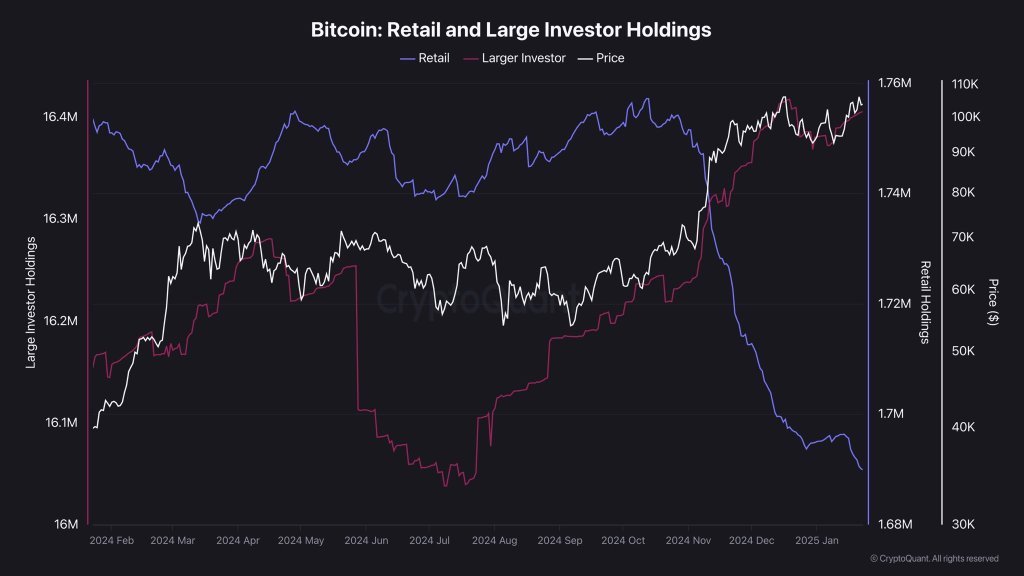
Retail investor holdings have declined while large investor holdings as Bitcoin increases in price.
On a different note, the Philadelphia Eagles will be playing the Kansas City Swifties next Sunday.


You must be logged in to post a comment.