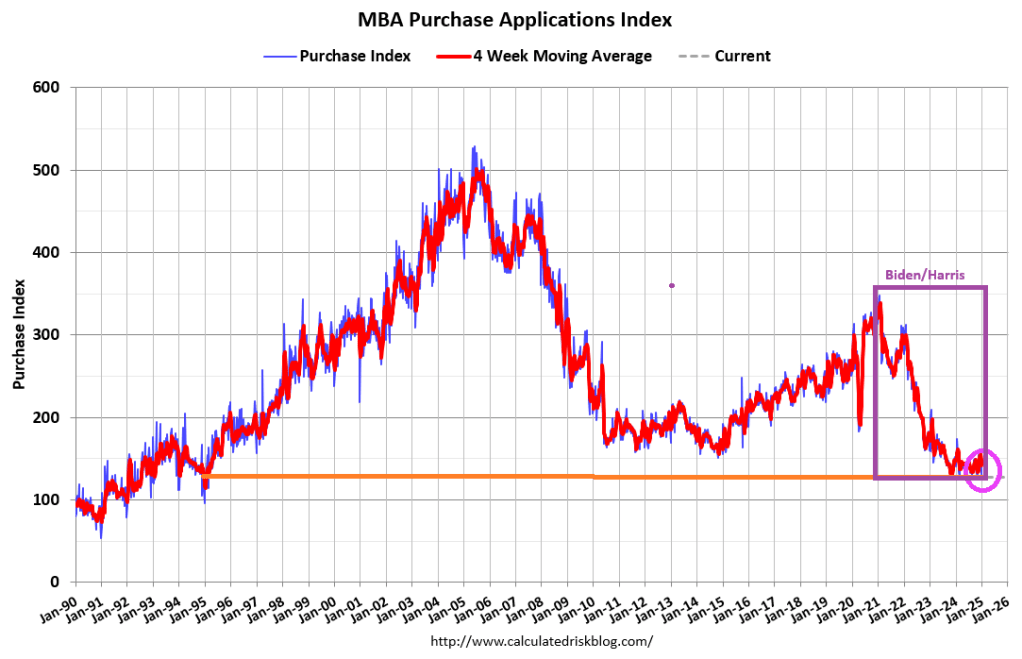
Mortgage applications decreased 3.7 percent from one week earlier, according to data from the Mortgage Bankers Association’s (MBA) Weekly Mortgage Applications Survey for the week ending January 3, 2025. This week’s results include an adjustment for the New Year’s holiday.
The Market Composite Index, a measure of mortgage loan application volume, decreased 3.7 percent on a seasonally adjusted basis from one week earlier. On an unadjusted basis, the Index increased 47 percent compared with the previous week. The seasonally adjusted Purchase Index decreased 7 percent from one week earlier. The unadjusted Purchase Index increased 43 percent compared with the previous week and was 15 percent lower than the same week one year ago.
Purchase application activity is up about 2% from the lows in late October 2023 and is now 15% below the lowest levels during the housing bust.
The Refinance Index increased 2 percent from the previous week and was 6 percent lower than the same week one year ago.
Was Freddie King correct? Is the US economy going down??
The US Treasury yield curve (10Y-2Y) has inverted to the positive side after a prolonged NEGATIVE inversion (from July 6, 2022 to Sept 5, 2024) marking the longest period of negative inversion since August 18, 1978 – May 1, 1980. Each negative inversion was followed by a recession.
The UST 10Y-3M yield curve tells a similar tale. The 10Y-3M curve inverts prior to recessions but goes positive just prior to recessions.
Yes, if the yield curve is a good predictor of recession, the US economy is going down.
Freddie King is playing a Gibson ES-355TDC guitar.
US home prices in the 20 largest cities rose 0.32% MoM in October (the latest data from S&P CoreLogic Case-Shiller), considerably hotter than the 0.22% rise expected. However, despite the MoM beat, the pace of annual acceleration has declined to its slowest since Sept 2023. At 3.62% YoY.
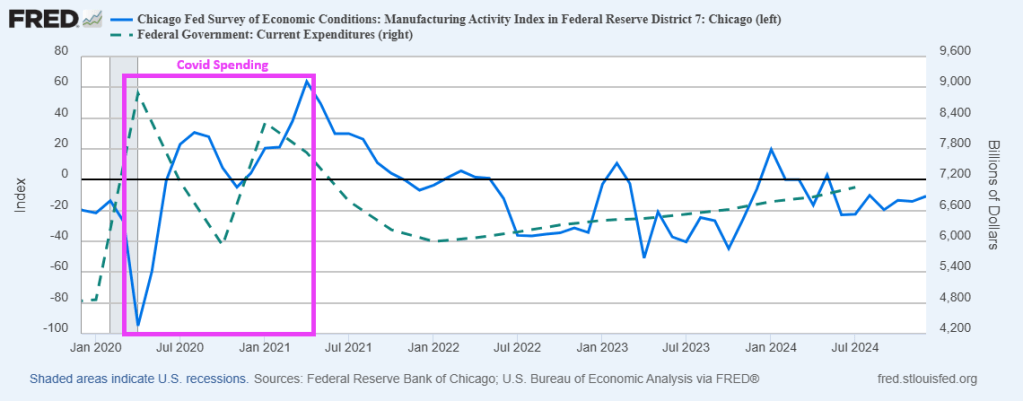
The Biden/Harris economic “miracle” was simply massive Federal spending (and borrowing) combined with hiring Federal workers. This can be seen in the following chart of Chicago Fed manufacturing index compared with Federal spending. Great times in the first months of 2021, but as Federal spending slowed, so did the manufacturing index. Last seen at -10.71 in December 2024.
Joe Biden, sold his soul for family wealth at the crossroads in Delaware.
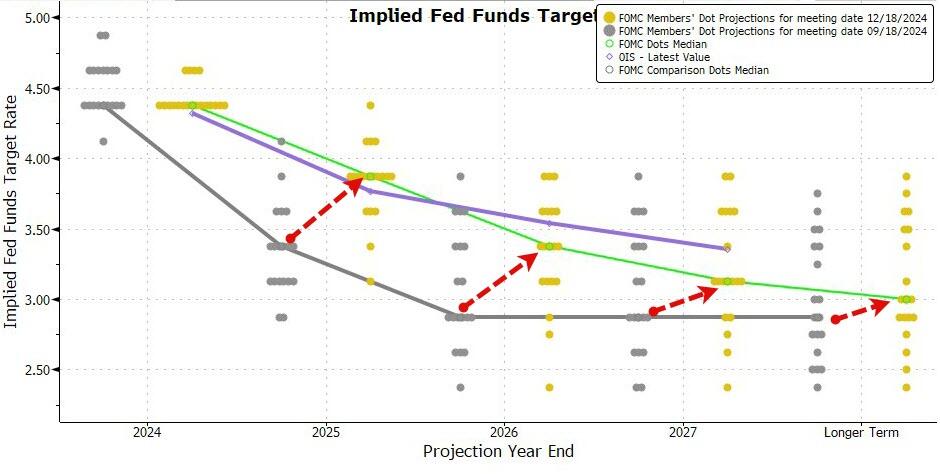
As expected, Powell and The Fed dropped their target rate by 50 basis points yesterday, deflating some of the air in the asset markets, More rate cuts will come, but at a slower rate.
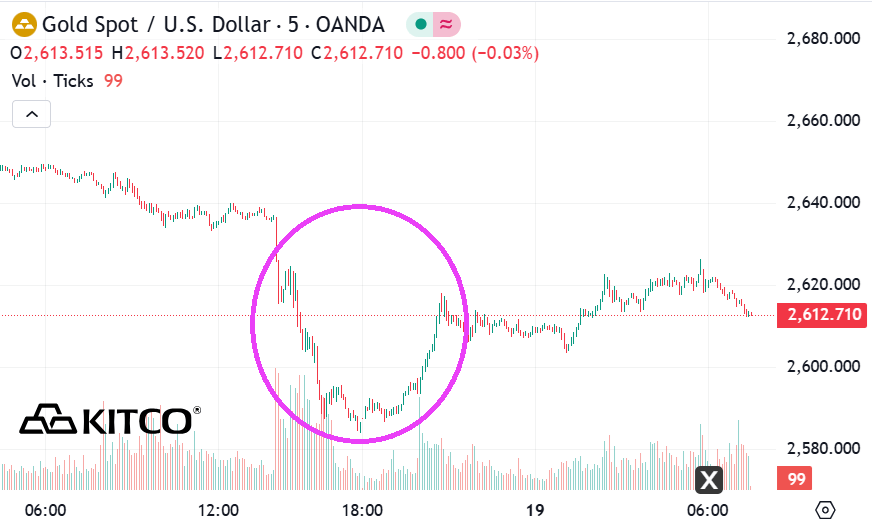
Gold got clobbered but has somewhat rebounded.
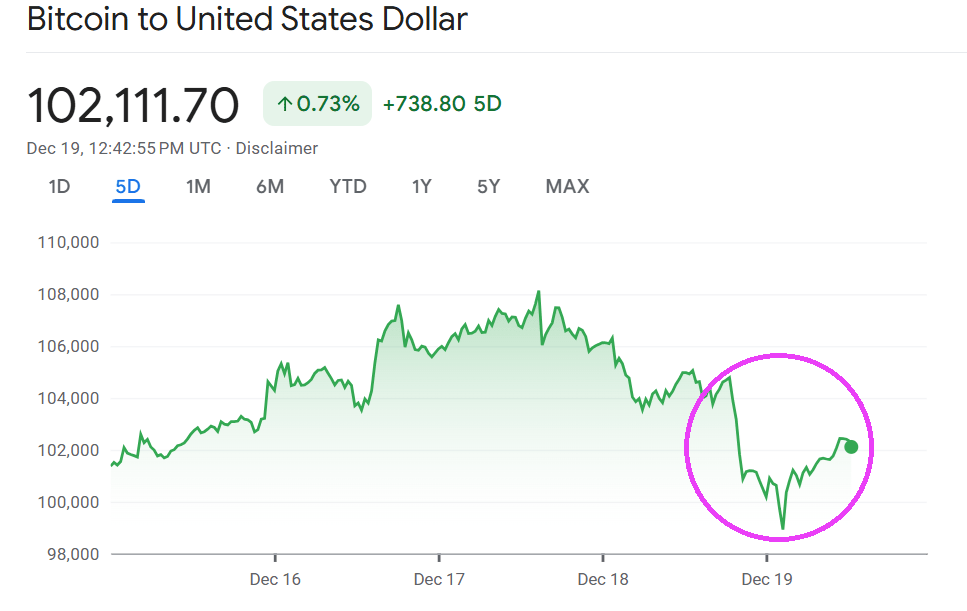
Bitcoin did likewise: dropping like a rock then bouncing back somwhat.
But gold and bitcoin/ethereum are down again.
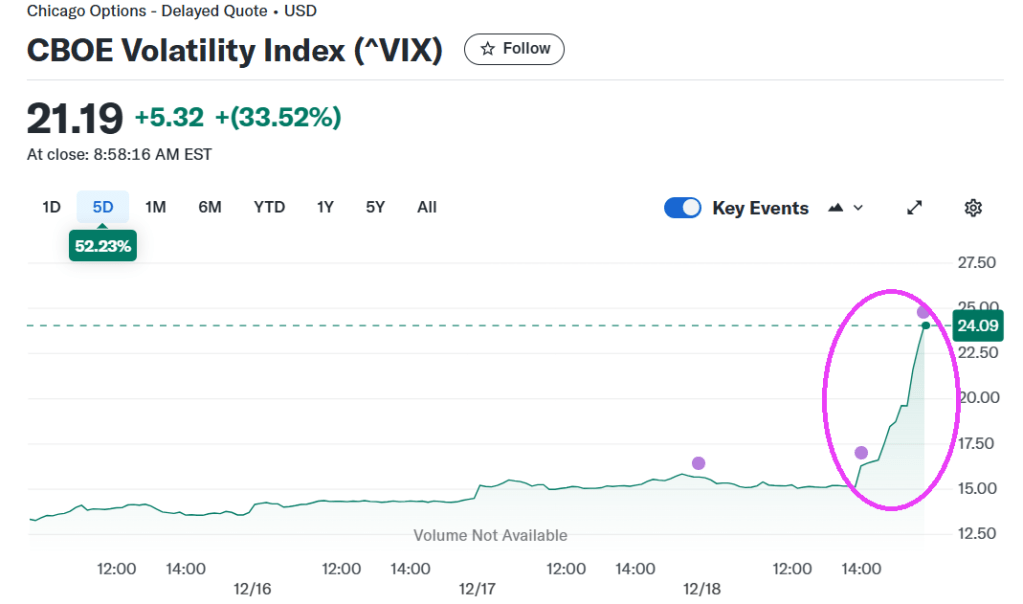
The CBOE VIX volatility index exploded upwards.
Powell is looking old, like most of Congress and Biden.
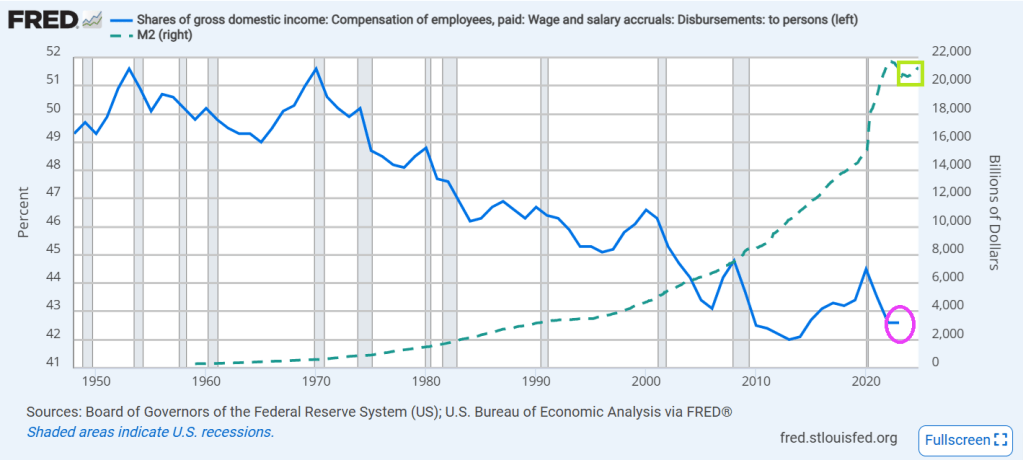
Wage and salary income as a percentage of GDP has fallen from over 50% back in 1970 to 43.1% in 2022. And look at the post Covid decline! And the increase in M2 Money.
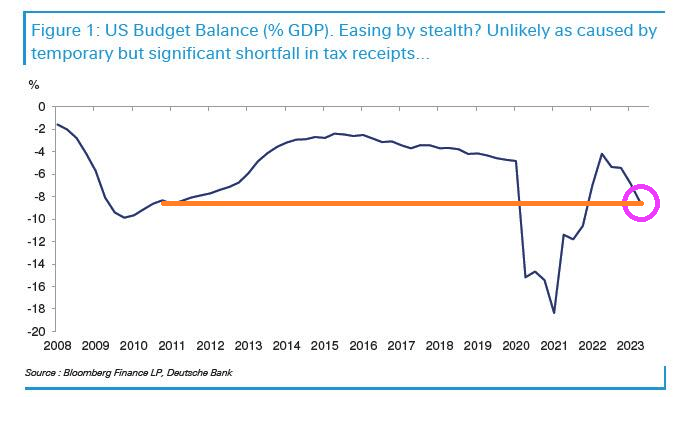
Meanwhile the US budget balance as a % of GDP has been plunging downwards in recent years.
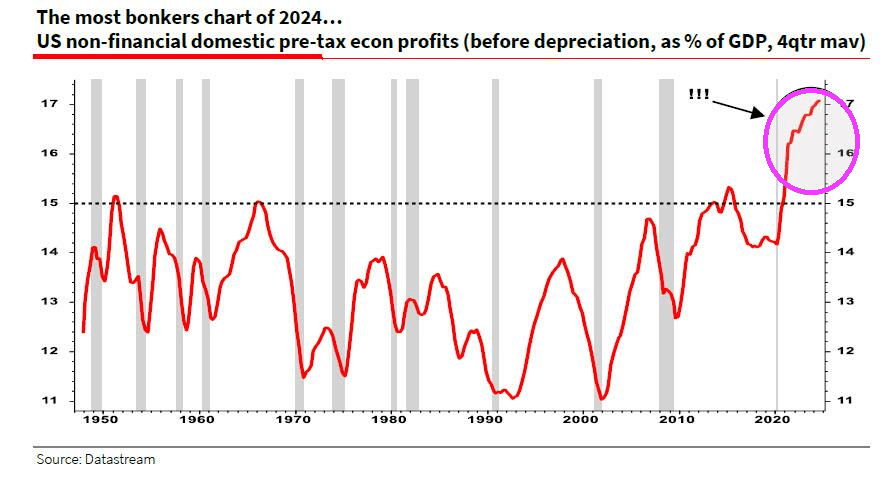
Despite the slowing economy, pre-tax profits post Covid have SOARED!
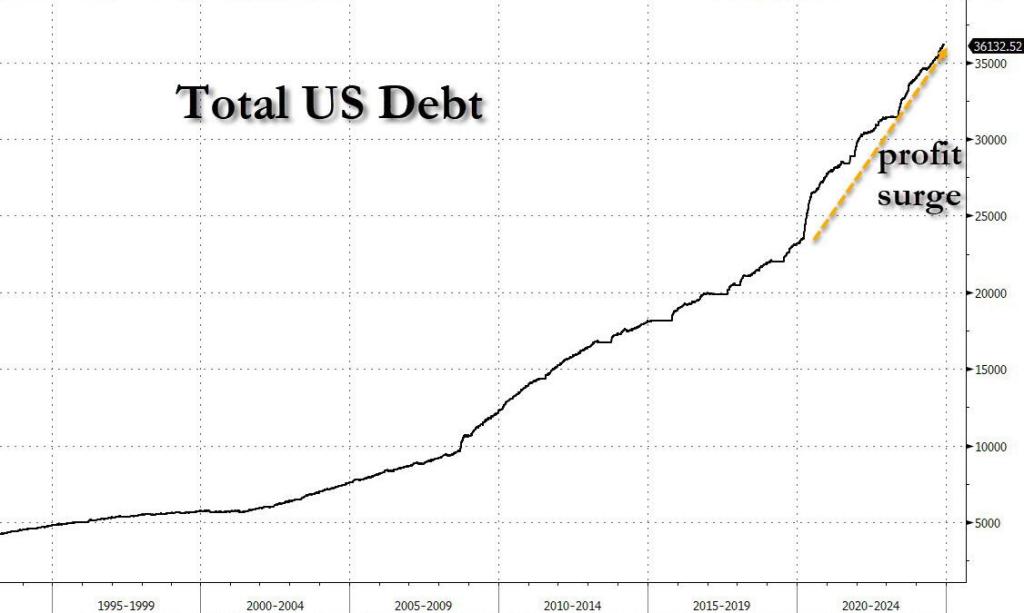
Primarily due to reckless/wasteful Federal spending and FEDERAL DEBT that soared.
There you have it! The Biden/Harris economic “miracle” was simply Federal government malspending that benefitted large corporations and few people.
Joe Biden and his woefully corrupt son Hunter of laptop fame.
Like a Great White Shark, Bitcoin has breached $100k!
Gold, a competitor to the US Dollar, is down a bit today, but has been rising with the prospect of Trump deregulating the hamstrung US economy. Gold rose under Biden/Harris (and McConnel/Schumer’s) gross fiscal mismanagemment.
Here is a picture of Bitcoin breaching the surface. And why it pays not to surf near seals or sea lions.
The last gasp of the Biden/Harris reign of (economic) error!
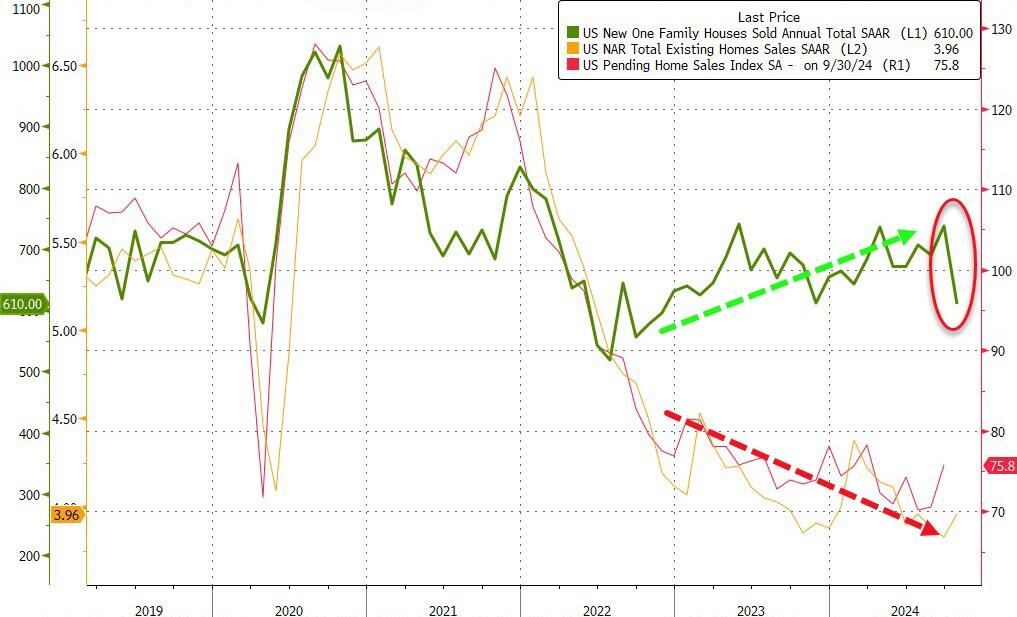
After existing home sales unexpectedly ticked up in October, analysts expected new home sales to slow after their recent resurgence (-1.8% MoM). They were right… BUT… the magnitude is mind-boggling!
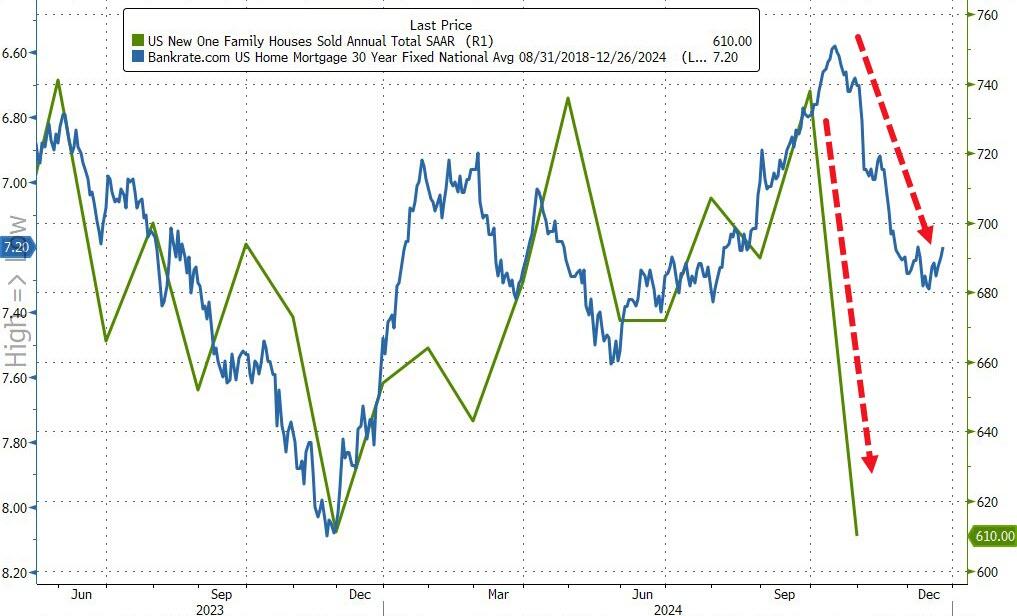
New Home Sales collapsed 17.3% MoM in October. That is the largest MoM drop since July 2013.
Source: Bloomberg
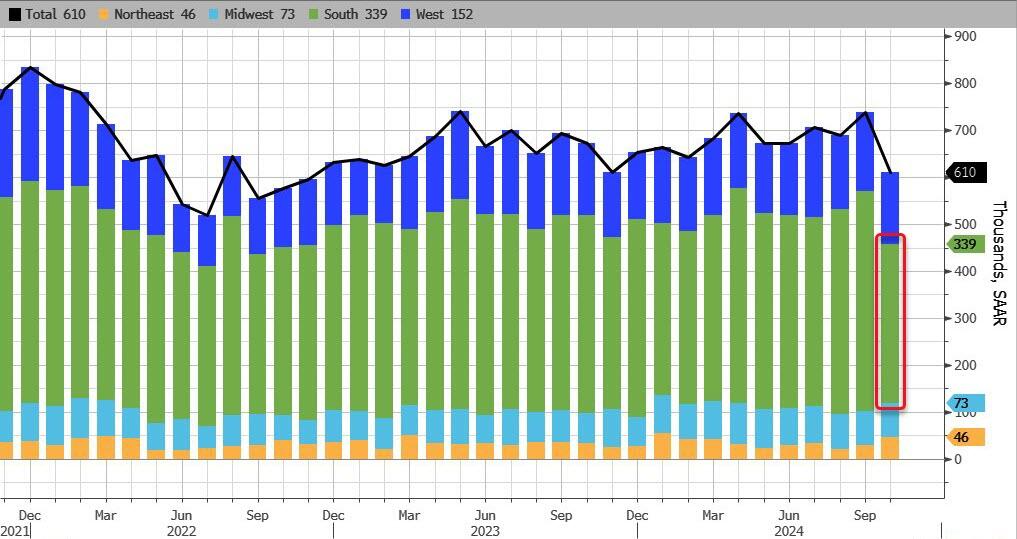
That MoM plunge dragged sales down 9.4% YoY to 610k SAAR – the lowest since Nov 2022
Source: Bloomberg
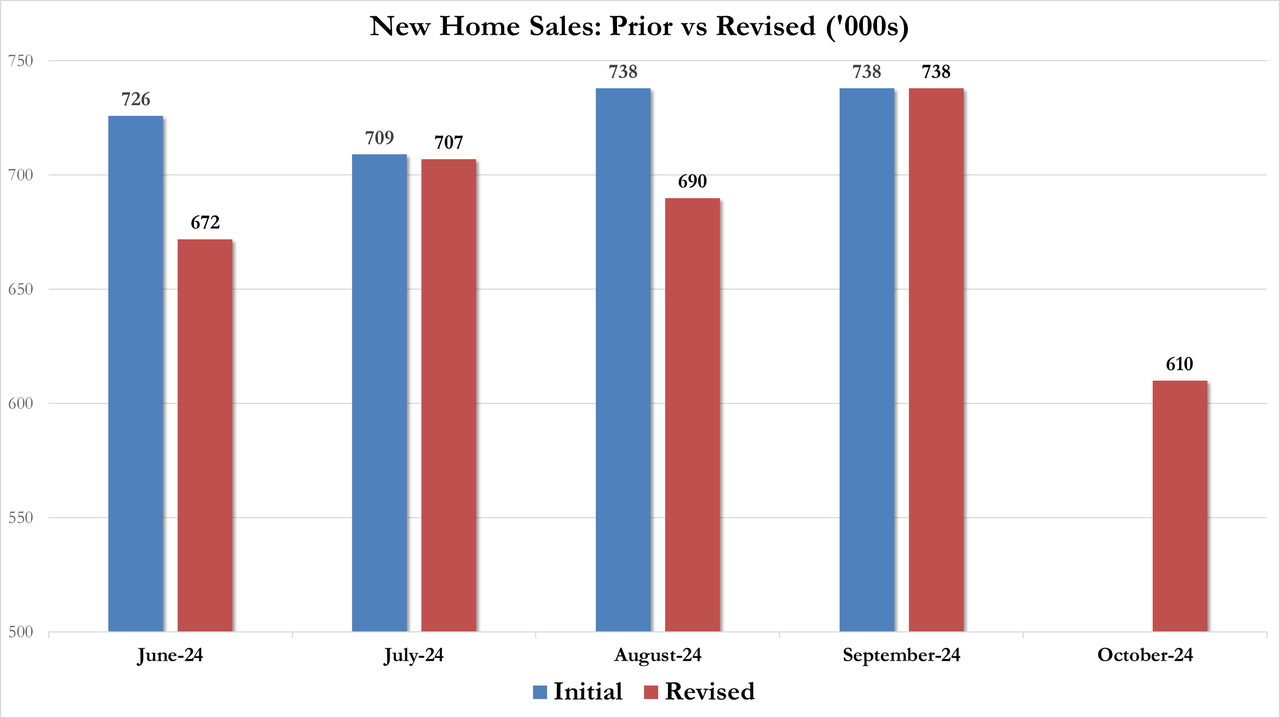
Of course, all the revisions are lower…
Hurricanes Helene and Milton, which tore through parts of the Southeast, delayed sales in the nation’s biggest housing region and dragged down sales overall.
Sales in the South decreased 28% to 339,000, the slowest pace since April 2020. Sales also fell in the West, but rose in the Northeast and the Midwest.
Source: Bloomberg
Finally, we note that the median sale price of a new home increased to $437,300 in October, the highest in 14 months.
Does this mean November’s data will see a massive surge in new home sales? …even as rates have increased significantly?


You must be logged in to post a comment.