Relaxing music for the office sector!
The office sector of commercial real estate has been in a depression for about two years, with prices of older office towers plunging by 50%, 60%, or 70% from their last transaction, and sometimes even more, with some office towers selling for land value, with the building by itself being worth next to nothing even in Manhattan.
Landlords of office buildings are having trouble collecting enough in rent to even pay the interest on their loans, and they’re having trouble or are finding it impossible to refinance a maturing loan, and so many of them have stopped making interest payments on their mortgages, and delinquencies continue to spike.
The delinquency rate of office mortgages backing commercial mortgage-backed securities (CMBS) spiked to 9.4% in October, up a full percentage point from September, and the highest since the worst months of the meltdown that followed the Financial Crisis. The delinquency rate has doubled since June 2023 (4.5%), according to data by Trepp, which tracks and analyzes CMBS.
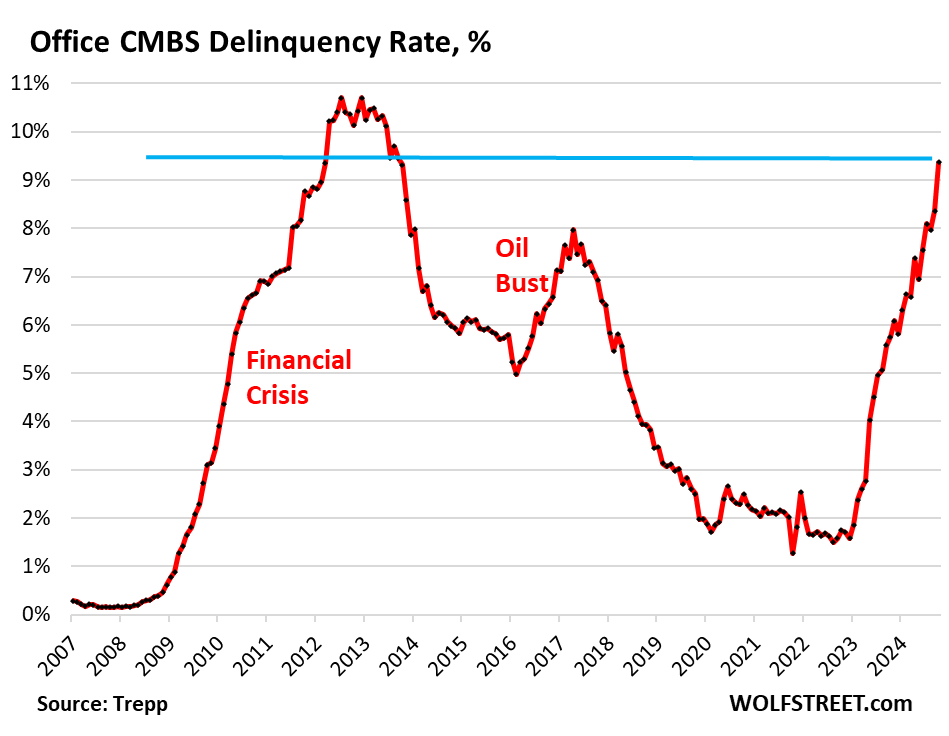
Office CRE fund managers have spread the rumor that office CRE has bottomed out, but the CMBS delinquency rate doesn’t agree with this bottomed-out scenario; it’s aggressively spiking.
Three months ago, the delinquency rate surpassed the surge in delinquencies that followed the American Oil Bust from 2014 through 2016, when hundreds of companies in the US oil-and-gas sector filed for bankruptcy as the price of oil had collapsed due to overproduction, which devastated the Houston office market in 2016.
But now there’s a structural problem that won’t easily go away with the price of oil: A huge office glut has emerged after years of overbuilding and industry hype about the “office shortage” that led big companies to hog office space as soon as it came on the market with the hope they’d grow into it. However, during the pandemic, companies realized that they don’t need all this office space, and vast portions of it sits there vacant and for lease, with vacancy rates in the 25% to 36% range in the biggest markets.
Mortgages are considered delinquent by Trepp when the borrower fails to make the interest payment after the 30-day grace period. A mortgage is not considered delinquent here if the borrower continues to make the interest payment but fails to pay off the mortgage when it matures. This kind of repayment default, while the borrower is current on interest, would be on top of the delinquency rate here.
Loans are pulled off the delinquency list if the interest gets paid, or if the loan is resolved through a foreclosure sale, generally involving big losses for the CMBS holders, or if a deal gets worked out between landlord and the special servicer that represents the CMBS holders, such as the mortgage being restructured or modified and extended.
Survive till 2025 has been the motto. But that might not work either. The Fed has cut its policy rate by 50 basis points in September and is likely to cut more but in smaller increments. Many CRE loans are floating-rate loans that adjust to a short-term rate (SOFR), and short-term rates move largely with the Fed’s policy rates. And floating-rate loans will have lower interest rates as the Fed cuts.
Long-term rates, including fixed-rate mortgage rates have risen sharply since the Fed started cutting rates, so that option isn’t appealing.
So the hope in the CRE industry is that rate cuts will be steep and many, thereby reducing floating-rate interest payments, making it easier for landlords to meet them. And so the prescription was: Survive till 2025, when interest rates would be, they hope, far lower than they were.
But rate cuts will do nothing to address the structural issues that office CRE faces. The landlord of a nearly empty older office tower isn’t going to be able to make the interest payment even at a lower rate when the tower is largely vacant.
And these older office towers face the brunt of the vacancy rates, amid a flight to quality now feasible because of vacancies even at the latest and greatest properties. And there are a lot of these older office towers around that have been refinanced at very high valuations in the years before the pandemic, but whose valuations have now plunged by 50%, 60%, or 70%, and they have become a nightmare for lenders and CMBS holders.


You must be logged in to post a comment.