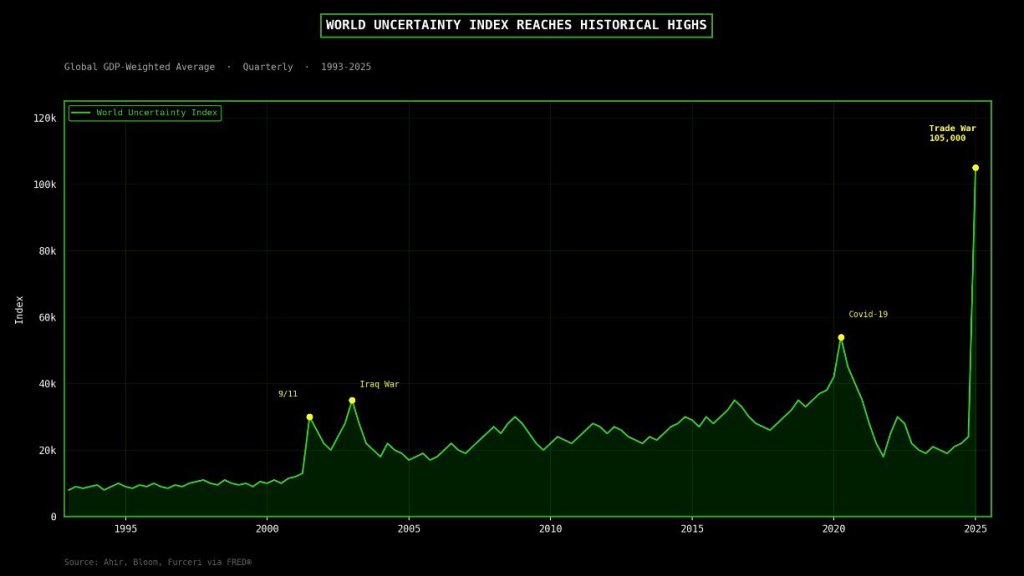
Global uncertainty hits an ALL-TIME HIGH.
Higher than Covid, the 2008 financial crisis, and the dot-com crash COMBINED.
You know what that means!
Confounded Interest – Anthony B. Sanders
Financial Markets And Real Estate
Global uncertainty hits an ALL-TIME HIGH.
Higher than Covid, the 2008 financial crisis, and the dot-com crash COMBINED.
You know what that means!
You got the silver? Lucky you!
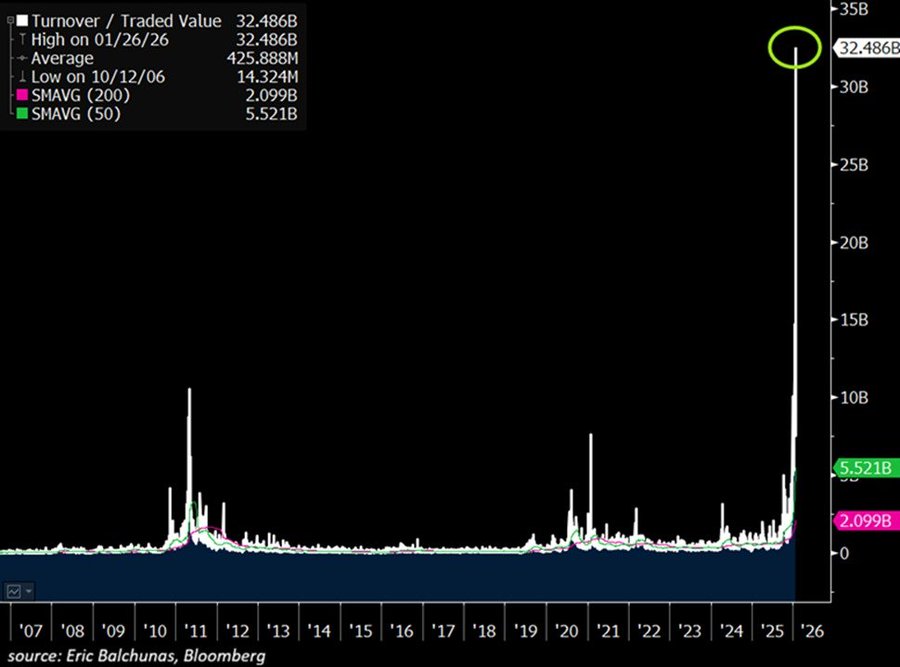
Silver ETF trading volume is exploding: Trading volume in the largest silver-backed ETF, $SLV, hit a record $40 billion on Monday.
This marks the highest turnover among any other asset and is 15 TIMES its average daily volume.
This also TRIPLES the previous peak seen in 2011.
By comparison, the S&P 500 ETF, $SPY, traded $25 billion, the Nasdaq 100 ETF, $QQQ, $17 billion, while Nvidia, $NVDA, and Tesla, $TSLA, each traded $16 billion.
Furthermore, the 2x leverage long-silver futures ETF, $AGQ, posted $8 billion in volume yesterday. The largest Gold ETF, $GLD, also saw massive turnover of $13 billion, but $27 BILLION lower than $SLV. Silver’s recent moves are truly unprecedented.
Thanks to the The Kobeissi Letter.
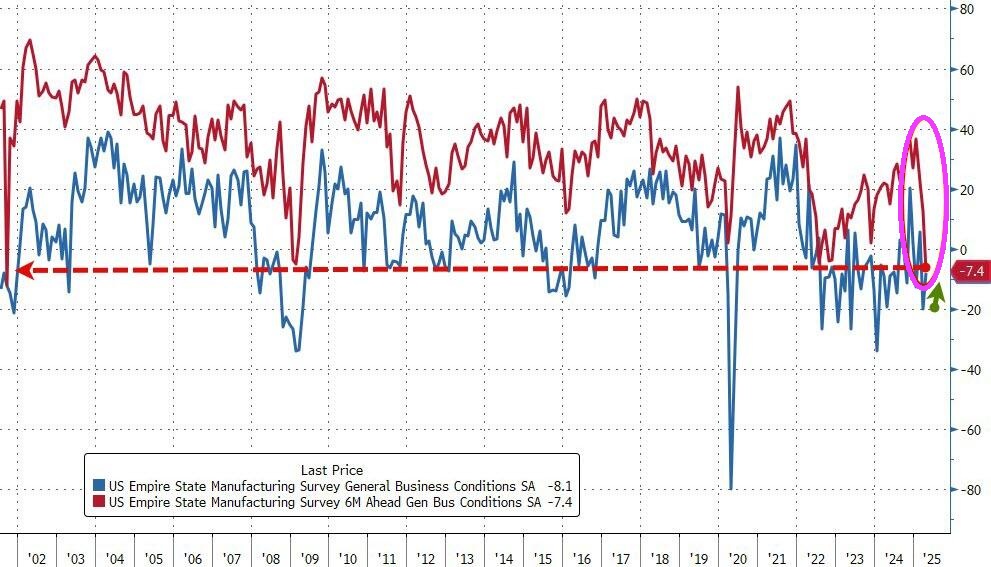
The Emperor is actually China’s Xi Jinping! Causing the Empire Fed Manufacturing index to decline.
Despite the slump in ‘soft’ survey data, analysts expected Empire Fed Manufacturing to bounce back from March’s tumble to one year lows and they were right with the headline index rising from -20.0 to -8.1 (considerably better than the -13.5), but still negative. However, while current conditions jumped, expectations plunged to the lowest since 9/11/.


Its Monday! Typically we see Blue Mondays. But not with the tariff war between China and the US. We are watching a chess match between Trump and China. Dow futures are up 461 points at 9am EST.
I’ve got a whole lot of lovin’ for the markets!

Obama/Biden/Harris/Schumer/Pelosi have let the US be the punks for China. Trump is simply trying to level the playing field and China’s Xie doesn’t like the new equilibrium.
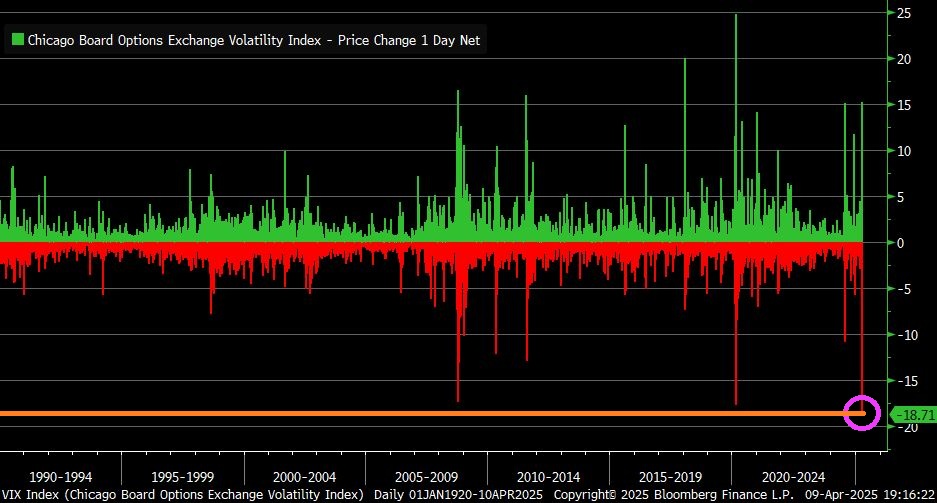
VIX Index fell by 18.7 points yesterday … largest one-day decline in history.
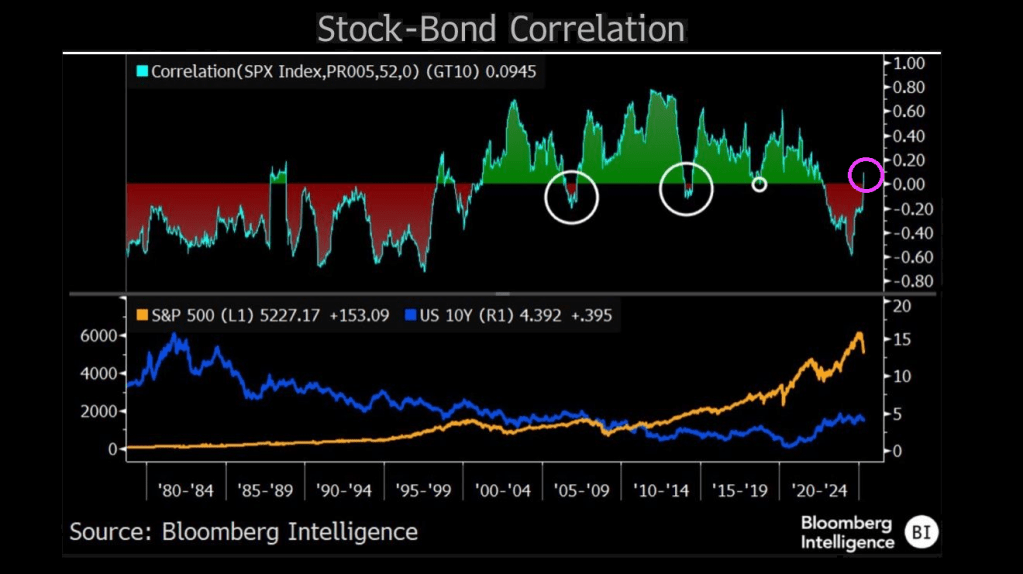
The correlation between stock prices and bond yields has returned to positive territory — hinting at a period of distress in equities and a regime shift in equity and bond markets where recession fears, rather than inflation, may be starting to drive direction of both. The correlation between the two asset classes was positive for the better part of 20 years prior to the pandemic, suggesting equities trended in the direction of yields as inflation mostly coincided with growth. Stocks held a negative correlation to yields throughout most of the 1980s and 1990s, when inflation hurt stocks — and that phenomenon returned for the 2022-24 bear market and recovery period.
Notably, major stock corrections occurred each time the correlation jumped out of its primary regime.
China’s Xi flashes a Hitler salute!

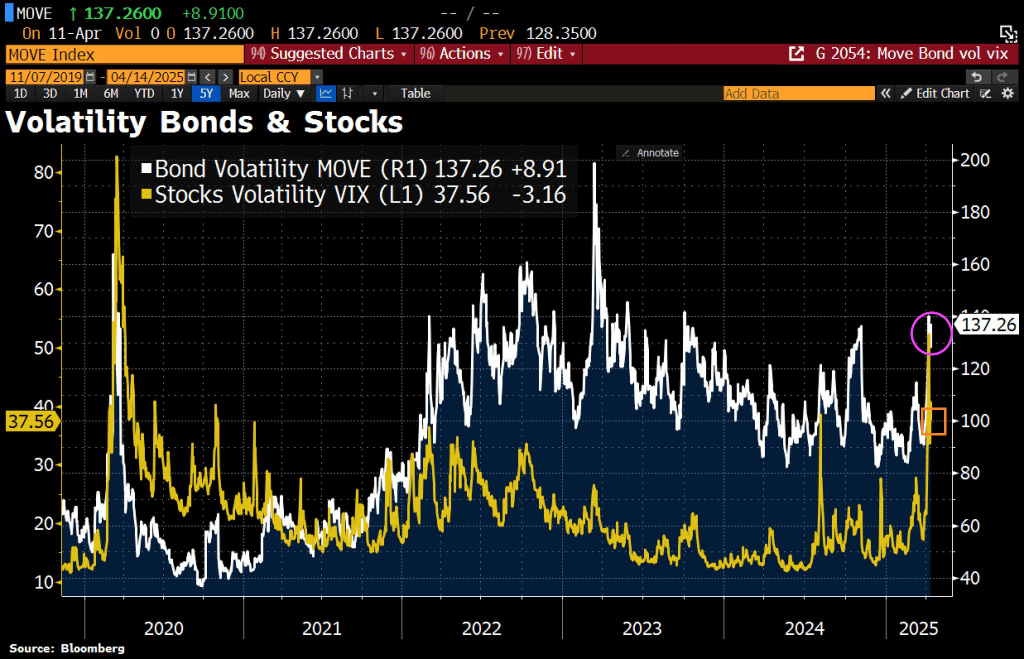
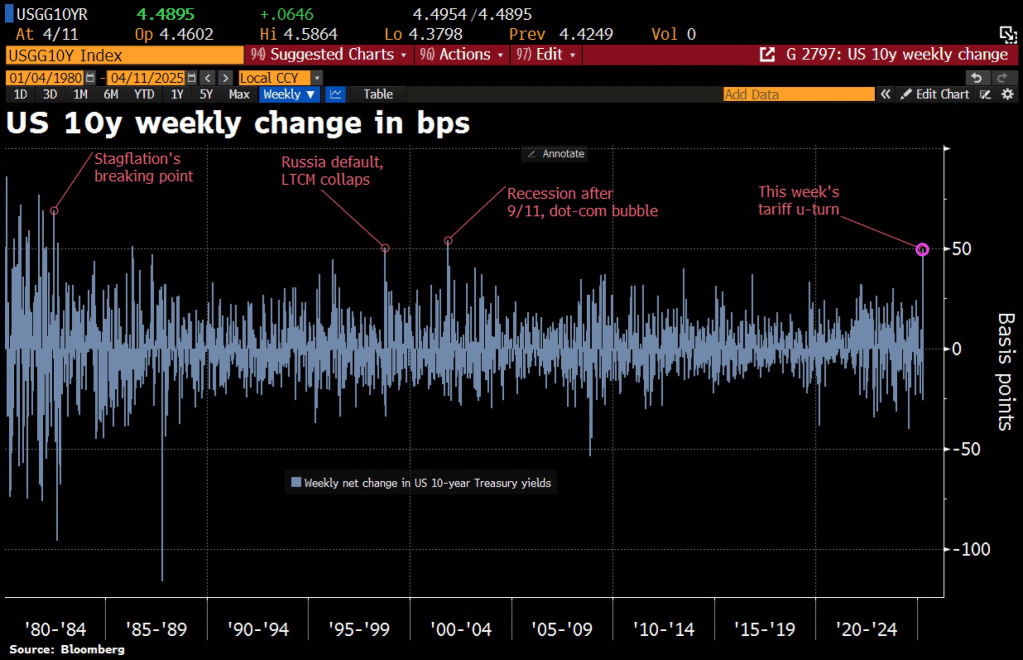
Thunderstruck! The tariff kerfuffle between the Trump Administration and China is causing turbulence in the Treasury market. The 10-year Treasury rate is soaring with China’s counterpunching.
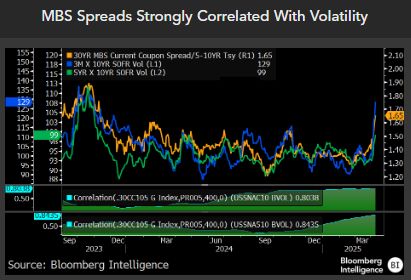
MBS spreads are widening.
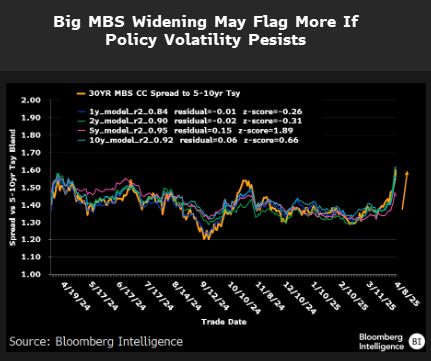
Along with volatility.
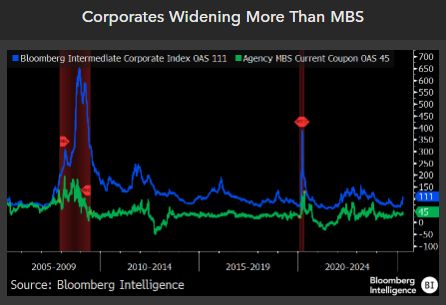
But corporate spreads are widening more than MBS spreads.
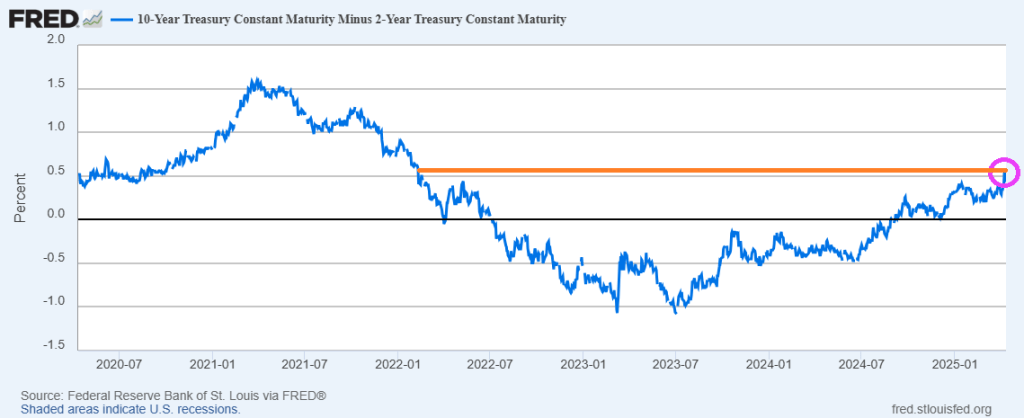
The 10Y-2Y yield curve has risen to the highest level since the early days of “China Joe” Biden.
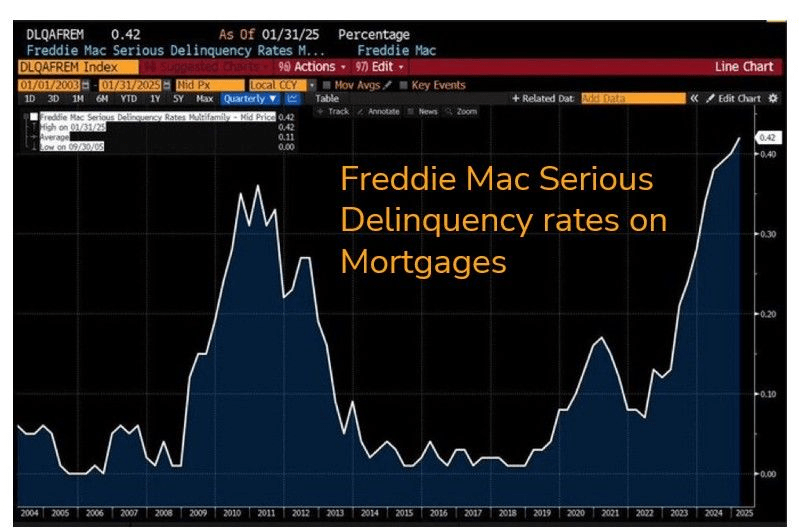
On a related note, Freddie Mac serious delinquency rates on mortgages is now the highest since the financial crisis.
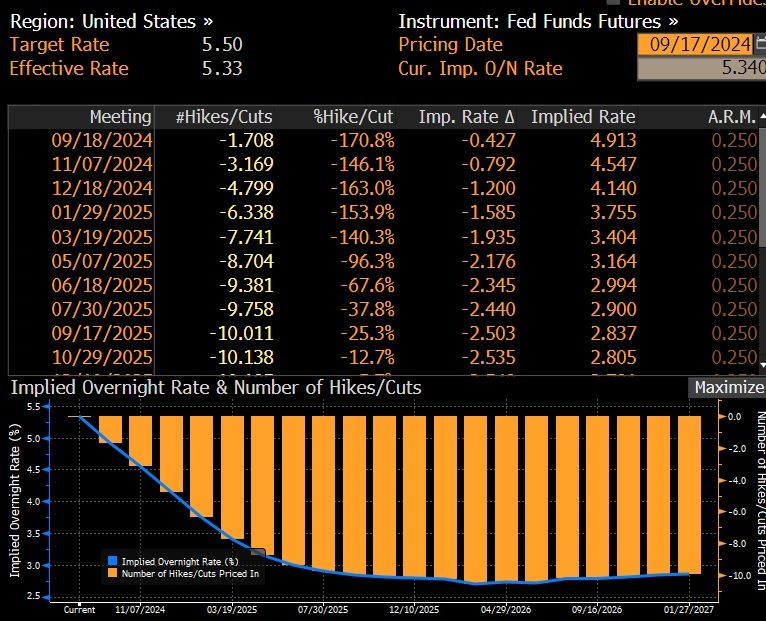
25 Or 50 Bps Cut! What’s It Gonna Be?
With uncertainty around today’s FOMC decision (50 or 25bps) at record highs, Goldman Sachs options guru John Marshall recommends buying options to position for FOMC-day volatility.
The opportunity, he notes, is most attractive in ETFs and Single Stock options.
Options imply a +/-1.1% move in S&P 500 for the 18-Sept FOMC meeting; this compares to an average of +/-1.2% move priced into SPX ahead of FOMC meetings since the beginning of 2022.
Arguably, this is an unusually important FOMC meeting due to the expected start of a cutting cycle.
On average, the S&P 500 has moved +/-1.3% during FOMC events since the beginning of 2022, coming above options implied moves.
In the July FOMC meeting the index moved +/-1.6% vs. an options implied expectations for a +/-1.1% move.
Goldman’s economists expect the September FOMC meeting to be the start of the Fed easing cycle with a 25bp rate cut followed by two consecutive 25bp rate cuts in November and December, and an eventual terminal rate of 3.25-3.5%.
They see differing asset performances around the start of the easing cycle depending on what motivated the Fed cuts.
Goldman analyzed moves across stocks and ETFs during the first Fed rate cut in the prior 3 Fed easing cycles (18-Sep-2007, 31-Jul-2019 & 3-Mar-2020).
Rate cuts during the 2007 and 2020 easing cycles were associated with a recession while the 2019 cut was due to a growth scare.
In the tables below are the top 20 names that saw unusual moves during the prior 3 Fed easing cycles and for the 2019 cycle separately.
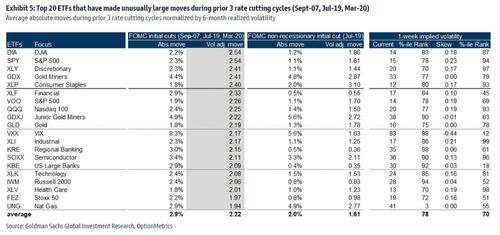
Financials and Tech were major movers during the beginning of the prior 3 Fed easing cycles while the 2019 cycle also saw unusual moves in Consumer Staples.

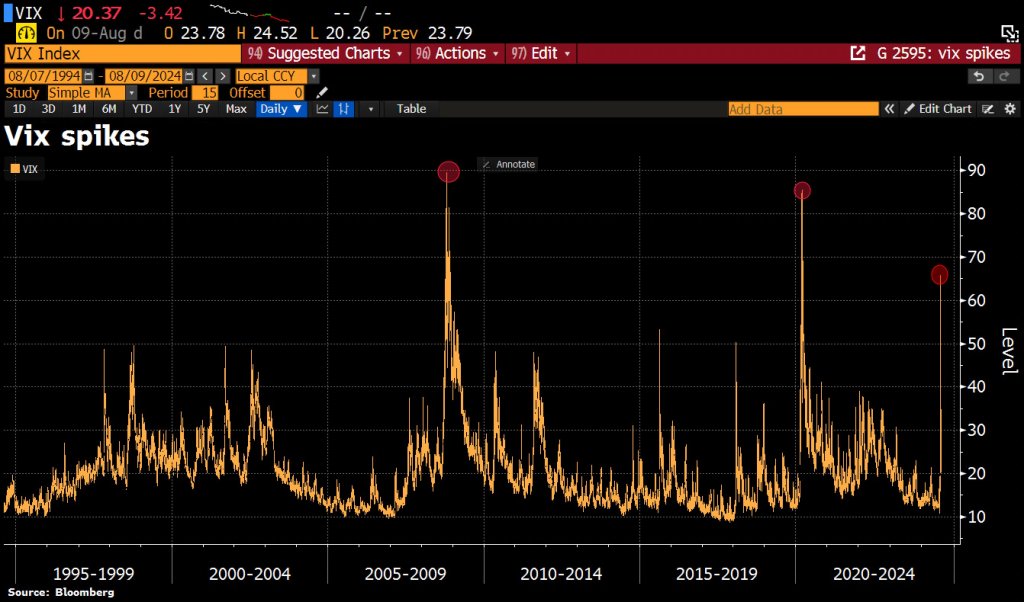
I have another use for VIX … to wipe out stock market gains. VIX is the S&P 500 volatility index, also known as “The Fear Index.”
Over the last 35yrs, the whole life of VIX history, there have only been 2 prior episodes of VIX trading >60: The 1st was during GFC, the collapse of Lehman, the 2nd episode occurred during Covid and we had a 3rd occurrence: that was last Monday.
VIX … wiping out stock returns!

Bidenomics (actually Biden/Harrisnomics) is all about huge payoffs to large, powerful donors. A good example is The Chips Act, intended to bring chip manufacturing back to the US from Taiwan, China, etc. Biden/Harris doled out $8.5 BILLION to Intel … which just laid off 15% of it’s labor force or 15k workers.
Intel has suspended dividends and its stock price has crashed from above $45 in March now down to $21.48, a 53% loss in 4 months.

Bear in mind that a Harris Presidency would be more of the same wasteful, Communist-style centralized economic (mis)management. Perhaps even worse.

And on that dreadful jobs report on Friday, the VIX fear index soared (white line) to its highest level since March 2023.

Former Fed Chair Janet Yellen, notorious for leaving rates too low for too long (TLTL) and then suddely raising them after Donald Trump was elected President, wants rates lower again for much longer. Make rates great again (MRGA?).
YELLEN SAYS DEBT SERVICE COSTS WILL BE 1% OF GDP FOR THE NEXT DECADE. – Reuters
Her statement implies that the economy will be strong and the government will run budget surpluses, or interest rates will be near zero for the next ten years.
Instead of guessing what she is pondering, we do some math and arrive at the only possible answer.
Before walking through various scenarios to figure out what Yellen may be implying, it’s helpful to provide background on what drives her mindset. In our article The Government Can’t Afford Higher For Longer, Much Longer, we shared the following graph and commentary:
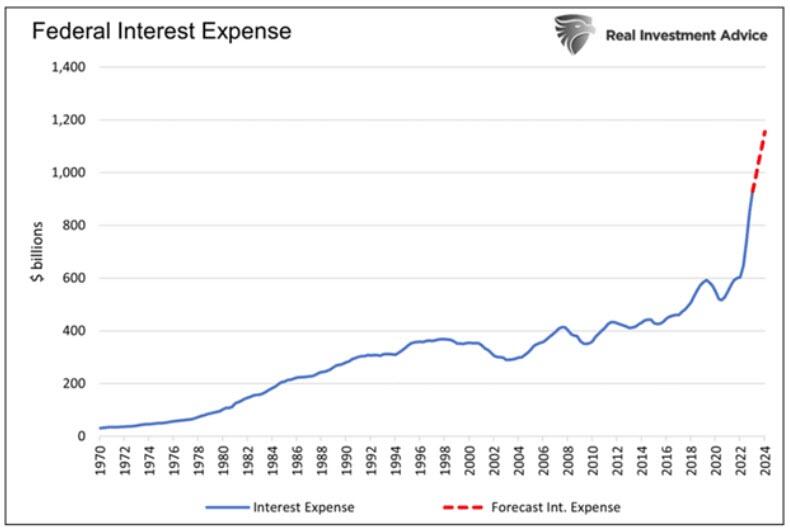
Total federal interest expenses should rise by approximately $226 billion over the next twelve months to over $1.15 trillion. For context, from the second quarter of 2010 to the end of 2021, when interest rates were near zero, the interest expense rose by $240 billion in aggregate. More stunningly, the interest expense has increased more in the last three years than in the fifty years prior.
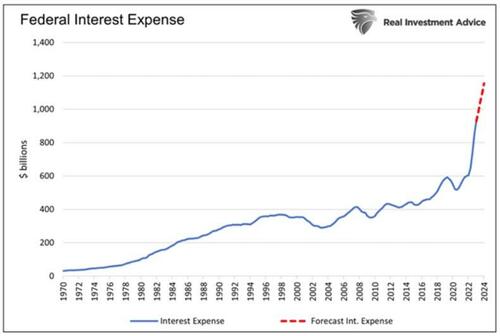
The graph above is just the tip of the fiscal iceberg. Every month, lower-interest-rate debt matures and will be replaced with higher-cost debt.
Higher interest rates are an additional funding burden for the federal government. Janet Yellen surely understands the damaging situation and grasps that higher interest rates are not feasible given current debt levels.
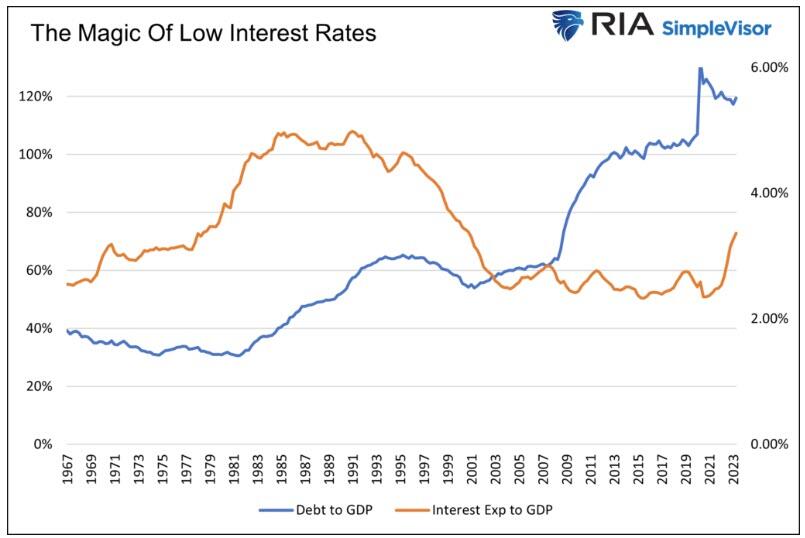
The government’s debt-to-GDP ratio has climbed three-fold since 1966. Yet, until very recently, the ratio of the federal interest expense to GDP was at its lowest level since 1966.
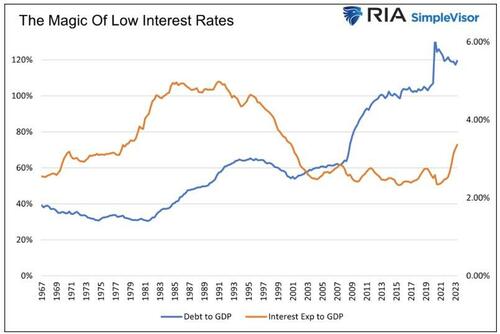
While the amount of debt rose sharply, its cost was offset by rapidly falling interest rates. As a result, higher debt levels were very manageable.
If $1 trillion of debt with a 4% coupon matures, and the Treasury replaces it with $2 trillion at a 2% coupon, the interest expense doesn’t change despite doubling the debt. While a simplified example, that is essentially what has occurred for the last 30 years.
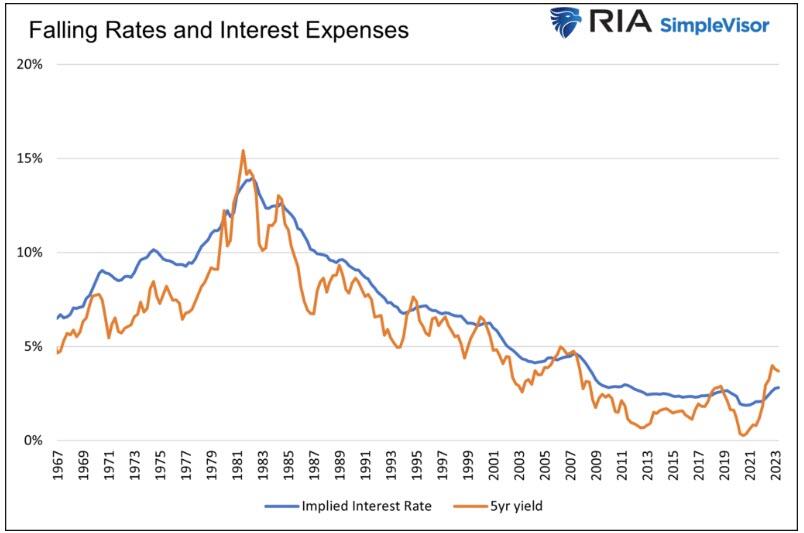
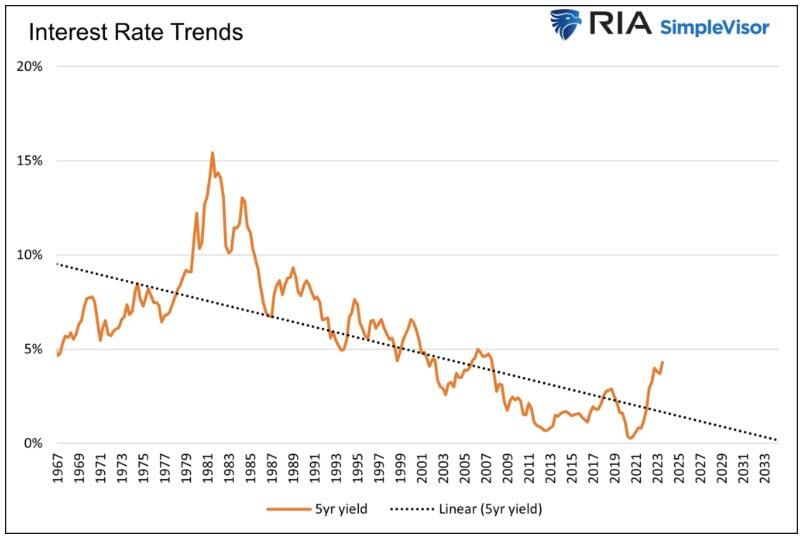
The following graph compares the 5-year U.S. Treasury note and the implied cost of funding the government’s debt.
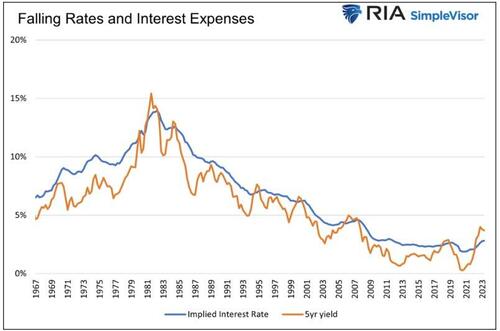
In time, as lower interest rate debt is replaced with higher interest rate debt, the benefits of lower rates work in reverse.
“Debt Service Costs At 1%” – Is It Possible?
We return to Janet Yellen’s message and discuss why she is likely correct.
In the five years leading up to the pandemic, nominal GDP grew at 5.03% annually. Let’s optimistically assume growth continues at 5% consistently for the next ten years. Now, let’s tack on an even bolder presumption: the government balances its budget every year for the next ten years. Thus, the amount of outstanding debt will remain constant. For context, in the last 57 years, there has only been one year in which the amount of debt has not increased.
In such a far-fetched scenario, the debt-to-GDP ratio would drop considerably to 70%. However, interest costs would equal 2% of GDP. Such is much better than the current 3.36% but double Janet Yellen’s 1% objective.
Budget surpluses for the next ten years would lower interest expenses even more and possibly get the interest expense to GDP ratio to 1%. However, the odds of a unicorn spraying rainbows across the sky and the government running a surplus are the same: zero percent.
Consequently, we exclude surpluses as a viable way to reduce the interest expense to a more manageable level.
Balanced budgets or surpluses are unrealistic, given the political and fiscal trends. Further, the economy relies heavily on government spending. While fiscal prudence would be good in the long run, the short-run effect would be a recession.
Instead of using pipe dreams as scenarios, let’s get realistic. The more likely, albeit still optimistic, scenario involves the debt and GDP growing at the same rate. Let’s also assume interest rates remain at current levels. In this exercise, we assume an average borrowing cost of 4.75%, which is a little below the current weighted average funding cost for the government. Under this “realistic” picture, interest expense would climb to 5.6% of GDP.
The only logical variable in the equation that can make Janet Yellen correct is the future interest rate.
To arrive at Yellen’s 1% figure, assuming debt grows at the rate of GDP, interest rates must be much lower.
In time, a weighted average interest rate of 0.85% would put the nation’s interest expense at 1% of GDP.
When Janet Yellen tells us the debt cost to GDP ratio will be 1% over the next ten years, she is really saying interest rates will be below 1% for the next ten years.
Therefore, Janet Yellen must believe that the recent spike in inflation and yields is an anomaly. If the pre-pandemic economic and interest rate trends resume, she will be correct.

Part of Janet Yellen’s job is to exude confidence to its investors. In this case, it means telling the public that the current jump in interest expenses will not last. While she would probably prefer to be straightforward and say interest rates will be much lower, she must also be sympathetic to the Fed’s job of getting inflation down. Therefore, to walk the party line, she must speak in code, so to speak.
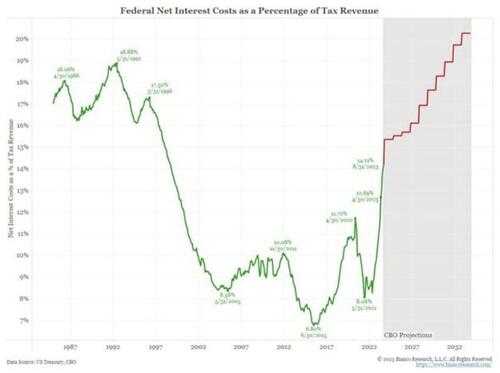
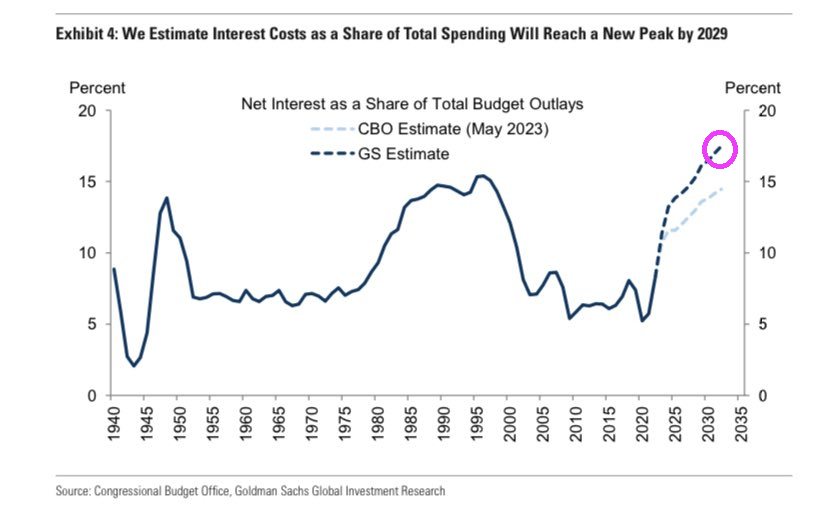
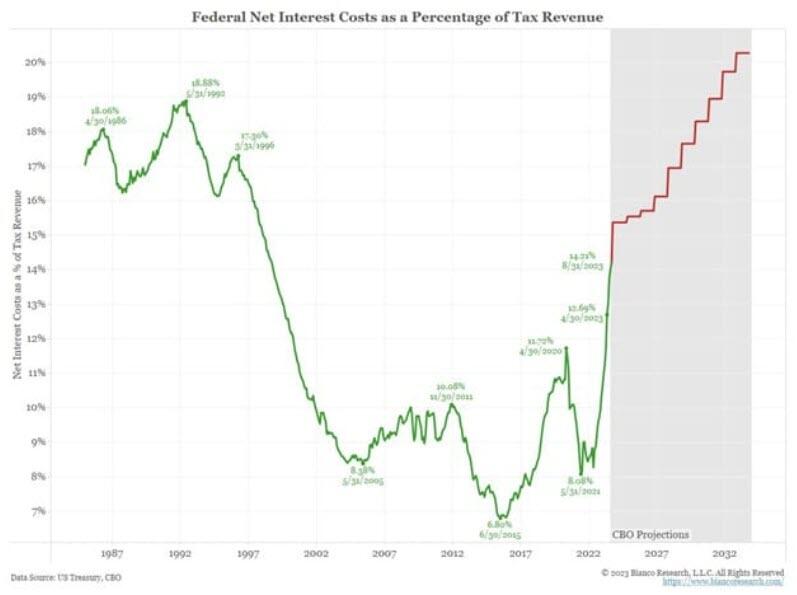
Whether you agree with Yellen’s projection or not, the following CBO graph projecting interest costs as a percentage of tax revenues, courtesy of Bianco Research, highlights that the government has no choice but lower for longer interest rates. The current level of interest rates will bankrupt the nation.
This makes sense. Two global elitists who look down with disdain and want to reprogram MAGA voters. Can we reprogram the MRGA types into letting rates float to market.


You must be logged in to post a comment.