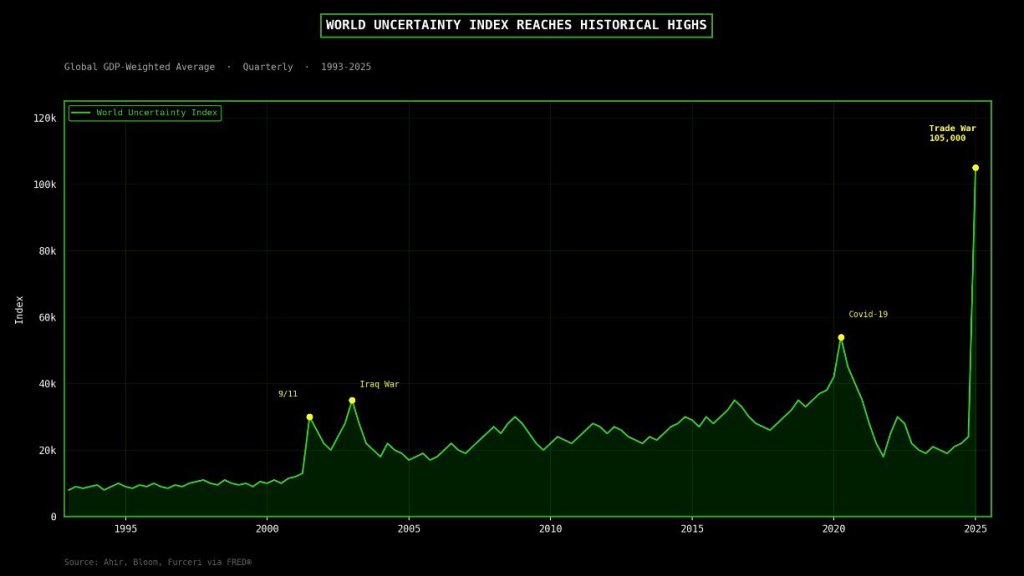
Global uncertainty hits an ALL-TIME HIGH.
Higher than Covid, the 2008 financial crisis, and the dot-com crash COMBINED.
You know what that means!
Confounded Interest – Anthony B. Sanders
Financial Markets And Real Estate
Global uncertainty hits an ALL-TIME HIGH.
Higher than Covid, the 2008 financial crisis, and the dot-com crash COMBINED.
You know what that means!
Household formation is slowing. Partly due to immigration slowing, partly due to increased cost on living (primarily due to Biden-era Federal spending).
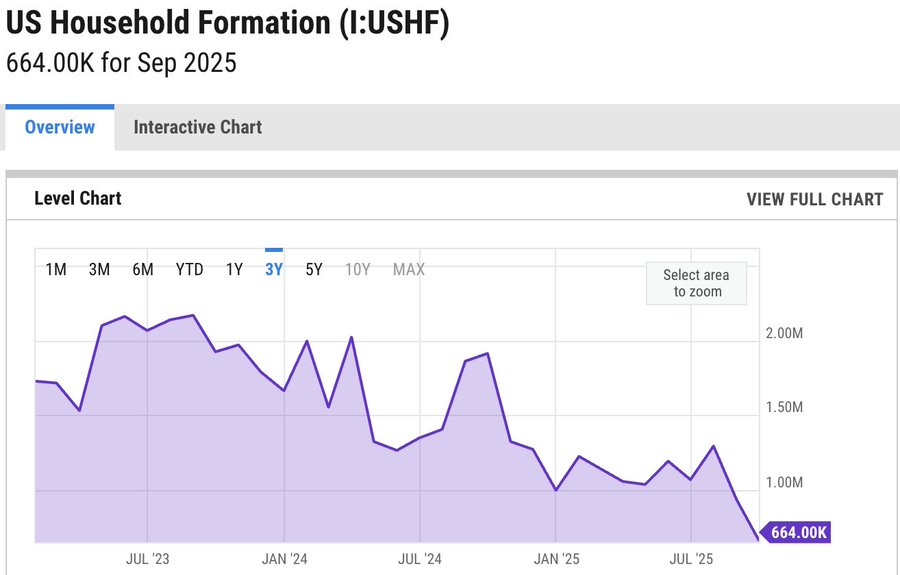
But if Democrats win Congress, they will undoubtedly go for open borders … again.
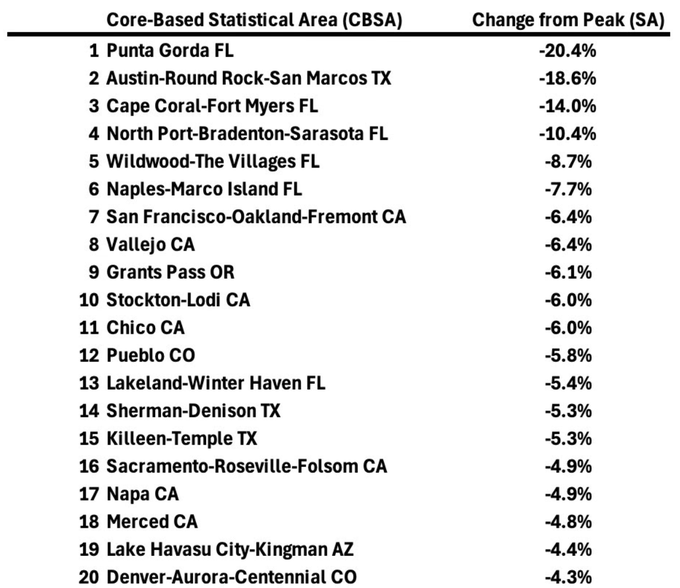
Home prices are tanking in bubble-ish metro areas like Florida, California and Austin Texas. Oddly, I have lived in Austin, San Francisco and Chico CA. All before that were bubble magnates.
One way to get household formation to increase? https://x.com/i/status/2017468783267614785

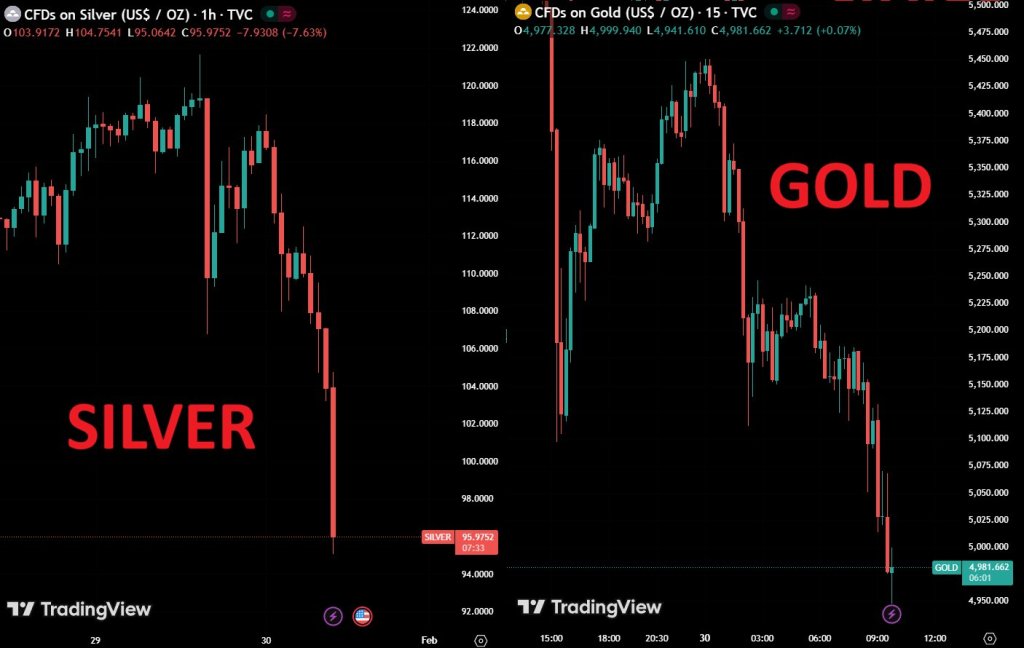
Call it the Post Powell Panic! After The Fed decided to do nothing at the FOMC meeting.
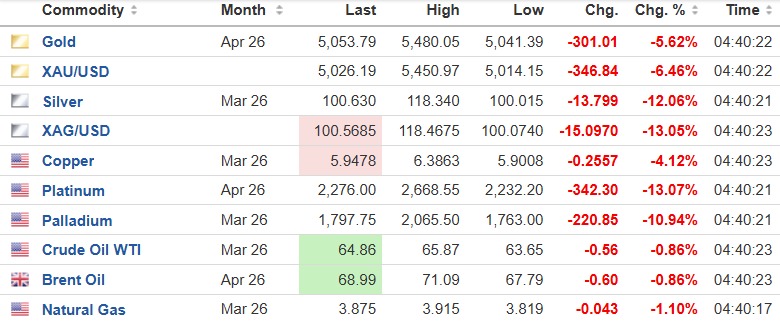
Gold is down -12% from the peak, trading below $5,000.
Silver is down -21%, trading below $100 for the first time since Friday, officially in a BEAR MARKET.
Rough night in the precious metals market space. An absolute BLOODBATH.
Is the top behind us?
Gold -6%
Silver -12%
Copper -4%
Platinum -13%
Palladium -11%
Trillions in market cap wiped out in a few hours.
Powell at The Fed FOMC meeting imitating former Fed Chair Janet Yellen. And Trump has nominated Kevin Warsh for Fed Chair who is expected to maintain Fed indepence.


You got the silver? Lucky you!
Silver ETF trading volume is exploding: Trading volume in the largest silver-backed ETF, $SLV, hit a record $40 billion on Monday.
This marks the highest turnover among any other asset and is 15 TIMES its average daily volume.
This also TRIPLES the previous peak seen in 2011.
By comparison, the S&P 500 ETF, $SPY, traded $25 billion, the Nasdaq 100 ETF, $QQQ, $17 billion, while Nvidia, $NVDA, and Tesla, $TSLA, each traded $16 billion.
Furthermore, the 2x leverage long-silver futures ETF, $AGQ, posted $8 billion in volume yesterday. The largest Gold ETF, $GLD, also saw massive turnover of $13 billion, but $27 BILLION lower than $SLV. Silver’s recent moves are truly unprecedented.
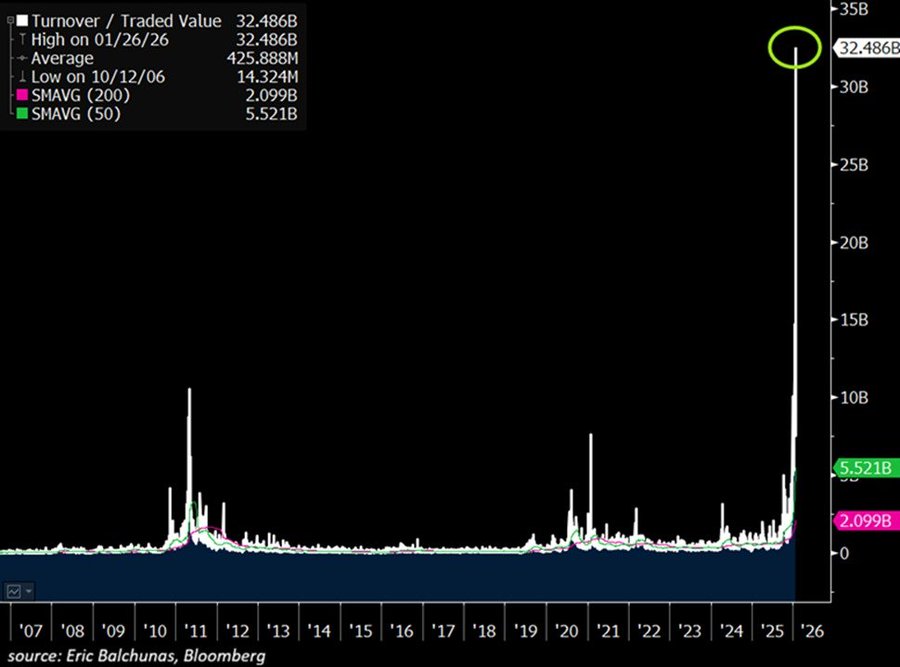
Thanks to the The Kobeissi Letter.
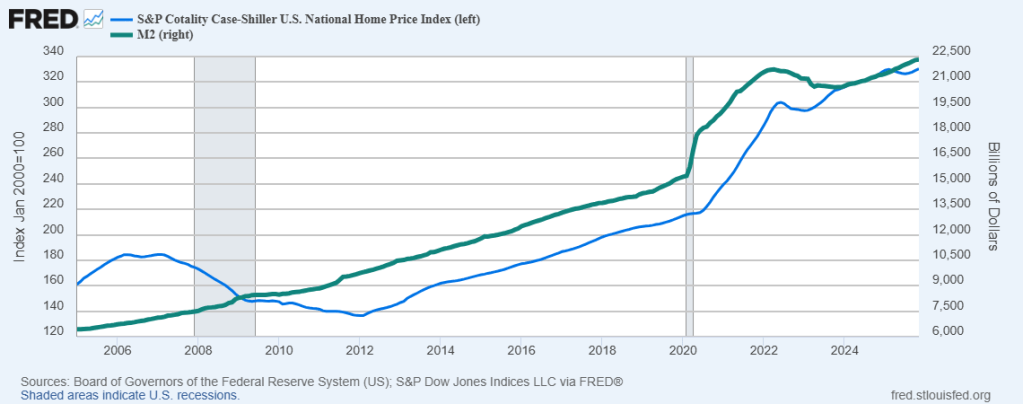
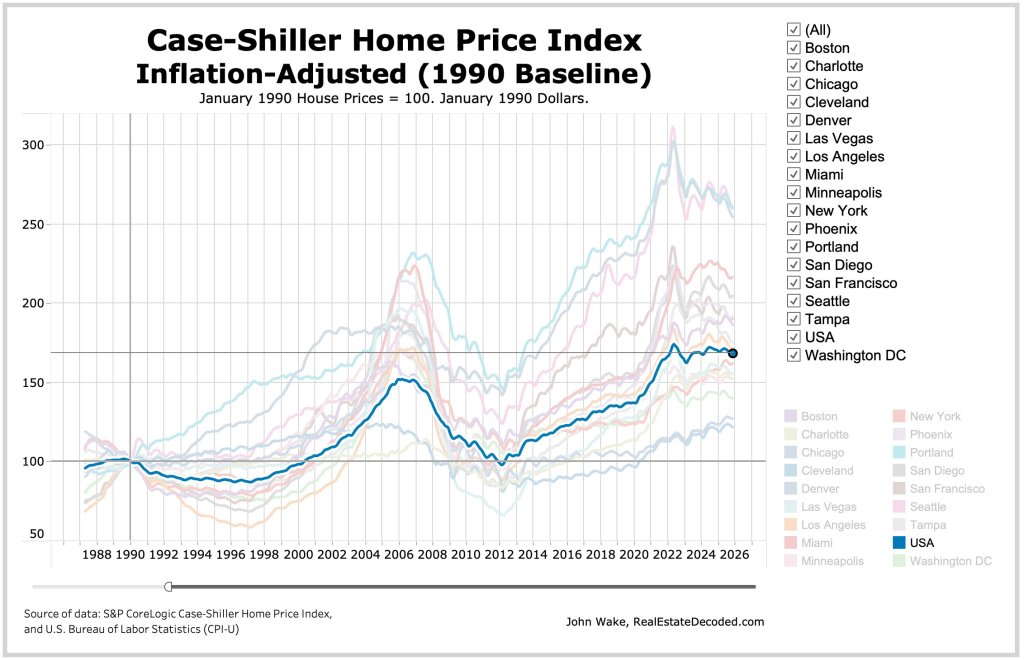
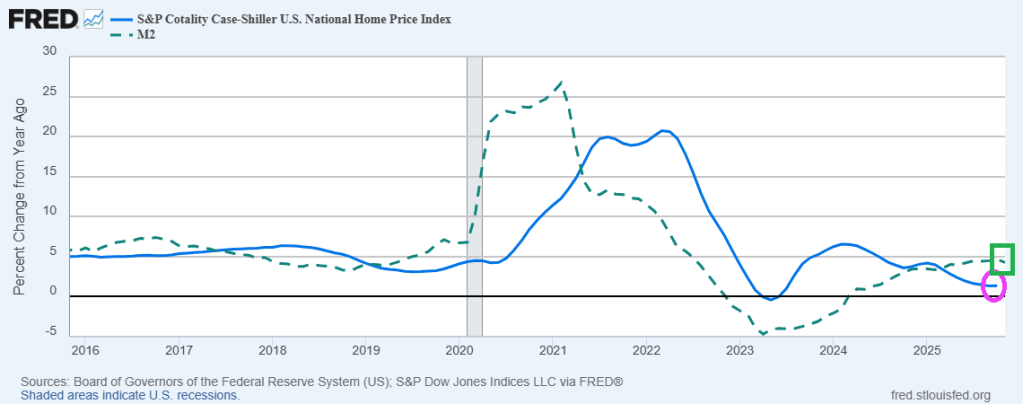
Keep on printing money. It seems that home price growth requires The Fed to keep printing money.
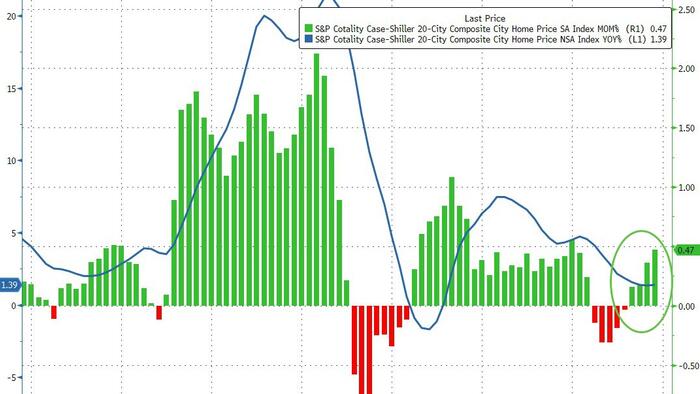
S&P/Case-Shiller released the monthly Home Price Indices for November (“November” is a 3-month average of September, October and November closing prices). September closing prices include some contracts signed in July, so there is a significant lag to this data. Here is a graph of the month-over-month (MoM) change in the Case-Shiller National Index Seasonally Adjusted (SA).
From S&P S&P Cotality Case-Shiller Index Reports Annual Gain In November 2025
From S&P S&P Cotality Case-Shiller Index Reports Annual Gain In November 2025
The S&P Cotality Case-Shiller U.S. National Home Price NSA Index posted a 1.4% annual gain for November, in line with the previous month.
Real home values declined as consumer inflation (2.7%) outpaced the National Index gain (1.4%) by 1.3 percentage points.
Regional divergence persisted: Midwestern and Northeastern markets led by Chicago (+5.7%) and New York (+5.0%) posted gains, while Sun Belt cities including Tampa (–3.9%), Phoenix (–1.4%), Dallas (–1.4%), and Miami (–1.0%) saw declines.
…
“Regional patterns continue to illustrate a stark divergence. Chicago leads all cities for a second consecutive month with a 5.7% year-over-year price increase, followed by New York at 5.0% and Cleveland at 3.4%. These historically steady Midwestern and Northeastern markets have maintained respectable gains even as overall conditions cool. By contrast, Tampa home prices are 3.9% lower than a year ago – the steepest decline among the 20 cities, extending that market’s 13-month streak of annual drops. Other Sun Belt boomtowns remain under pressure as well: Phoenix (-1.4%), Dallas (-1.4%), and Miami (-1.0%) each continue to see year-over-year declines, a dramatic turnaround from their pandemic-era strength.
“Monthly price changes were mixed but leaned negative in November, underscoring persistent softness. On a non-seasonally adjusted basis, 15 of the 20 major metro areas saw prices decline from October (versus 16 declines in the previous month). Only a handful of markets – including Los Angeles, San Diego, Miami, New York, and Phoenix – eked out slight gains before seasonal adjustment. After accounting for typical seasonal slowing, the National Index inched up just 0.4% for the month, indicating that price momentum remains muted.
…
The S&P Cotality Case-Shiller U.S. National Home Price NSA Index, covering all nine U.S. census divisions, reported a 1.4% annual gain for November. The 10-City Composite showed an annual increase of 2.0%, up from a 1.9% increase in the previous month. The 20-City Composite posted a year-over-year increase of 1.4%, up from a 1.3% increase in the previous month.
…
The pre-seasonally adjusted U.S. National Index saw a drop of 0.1% and the 20-City Composite Index fell 0.03%, while the 10-City Composite Index increased 0.1%.
After seasonal adjustment, the U.S. National Index reported a monthly increase of 0.4%, and both the 10-City Composite and 20-City Composite Indices posted month-over-month gains of 0.5%.
While its not the 2009, we do have a house price bubble that is deflating as The Fed slows M2 Money growth. However, we are witnessing rising foreclosure rates.
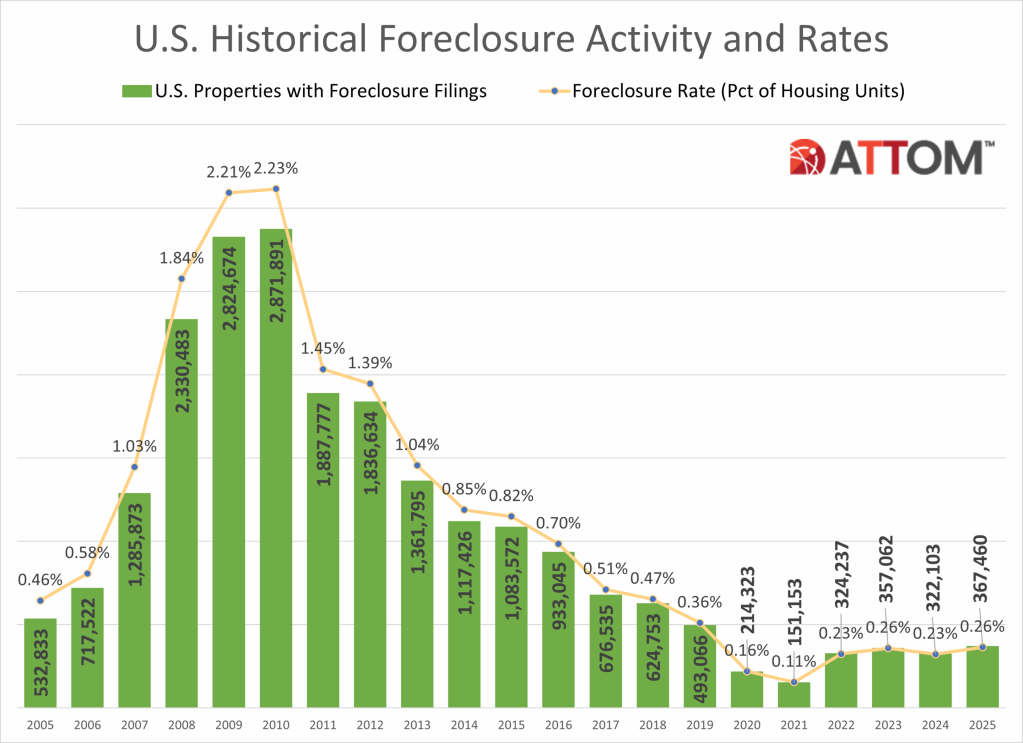
Foreclosure activity increased in 2025, reflecting a continued normalization of the housing market following several years of historically low levels,” said Rob Barber, CEO at ATTOM. “While filings, starts, and repossessions all rose compared to 2024, foreclosure activity remains well below pre-pandemic norms and a fraction of what we saw during the last housing crisis. The data suggests that today’s uptick is being driven more by market recalibration than widespread homeowner distress, with strong equity positions and more disciplined lending continuing to limit risk.
Foreclosure starts on the rise nationwide
Lenders started the foreclosure process on 289,441 U.S. properties in 2025, up 14 percent from 2024, up 213 percent from the pandemic-era low in 2021, but down 14 percent form 2019 and down 86 percent from a peak of 2,139,005 in 2009.
States that saw the greatest number of foreclosure starts in 2025 included Texas (37,215 foreclosure starts); Florida (34,336 foreclosure starts); California (29,777 foreclosure starts); Illinois (15,010 foreclosure starts); and New York (13,664 foreclosure starts).
Those metropolitan statistical areas with a population greater than 1 million that saw the greatest number of foreclosure starts in 2025 included New York, NY (14,189 foreclosure starts); Chicago, IL (13,312 foreclosure starts); Houston, TX (13,009 foreclosure starts); Miami, FL (8,936 foreclosure starts); and Los Angeles, CA (8,503 foreclosure starts).
Bank repossessions increase year over year
Lenders repossessed 46,439 properties through foreclosures (REO) in 2025, up 27 percent from 2024 but down 68 percent from 143,955 in 2019, the last full year before pandemic-related declines, and down 96 percent from a peak of 1,050,500 in 2010.
States that saw the greatest number of REOs in 2025 included Texas (5,147 REOs); California (4,030 REOs); Pennsylvania (2,975 REOs); Florida (2,869 REOs); and Illinois (2,768 REOs).
Those metropolitan statistical areas with a population greater than 1 million that saw the greatest number of REOs in 2025 included Chicago, IL (2,033 REOs); New York, NY (1,462 REOs); Houston, TX (1,381 REOs); Detroit, MI (1,105 REOs); and Philadelphia, PA (1,100 REOs).
Florida, Delaware, and South Carolina record the worst foreclosure rates in 2025
States with the worst foreclosure rates in 2025 were Florida (1 in every 230 housing units with a foreclosure filing); Delaware (1 in every 240 housing units); South Carolina (1 in every 242 housing units); Illinois (1 in every 248 housing units); and Nevada (1 in every 248 housing units).
Rounding out the top 10 states with the worst foreclosure rates in 2025, were New Jersey (1 in every 273 housing units); Indiana (1 in every 302 housing units); Ohio (1 in every 307 housing units); Texas (1 in every 319 housing units); and Maryland (1 in every 326 housing units).
Lakeland, Columbia, and Cleveland post the worst metro foreclosure rates in 2025
Among 225 metropolitan statistical areas with a population of at least 200,000, those with the worst foreclosure rates in 2025 were Lakeland, FL (1 in every 145 housing units with a foreclosure filing); Columbia, SC (1 in every 165 housing units); Cleveland, OH (1 in every 187 housing units); Cape Coral, FL (1 in every 189 housing units); and Atlantic City, NJ (1 in every 192 housing units).
Metro areas with a population greater than 1 million, including Cleveland that had the worst foreclosure rates in 2025 were: Jacksonville, FL (1 in every 200 housing units); Las Vegas, NV (1 in every 210 housing units); Chicago, IL (1 in every 214 housing units); and Orlando, FL (1 in every 217 housing units).
Average time to foreclose decreases
U.S. properties foreclosed in the fourth quarter of 2025 had been in the foreclosure process an average of 592 days, a 3 percent decrease from the previous quarter and a 22 percent decrease from a year ago.
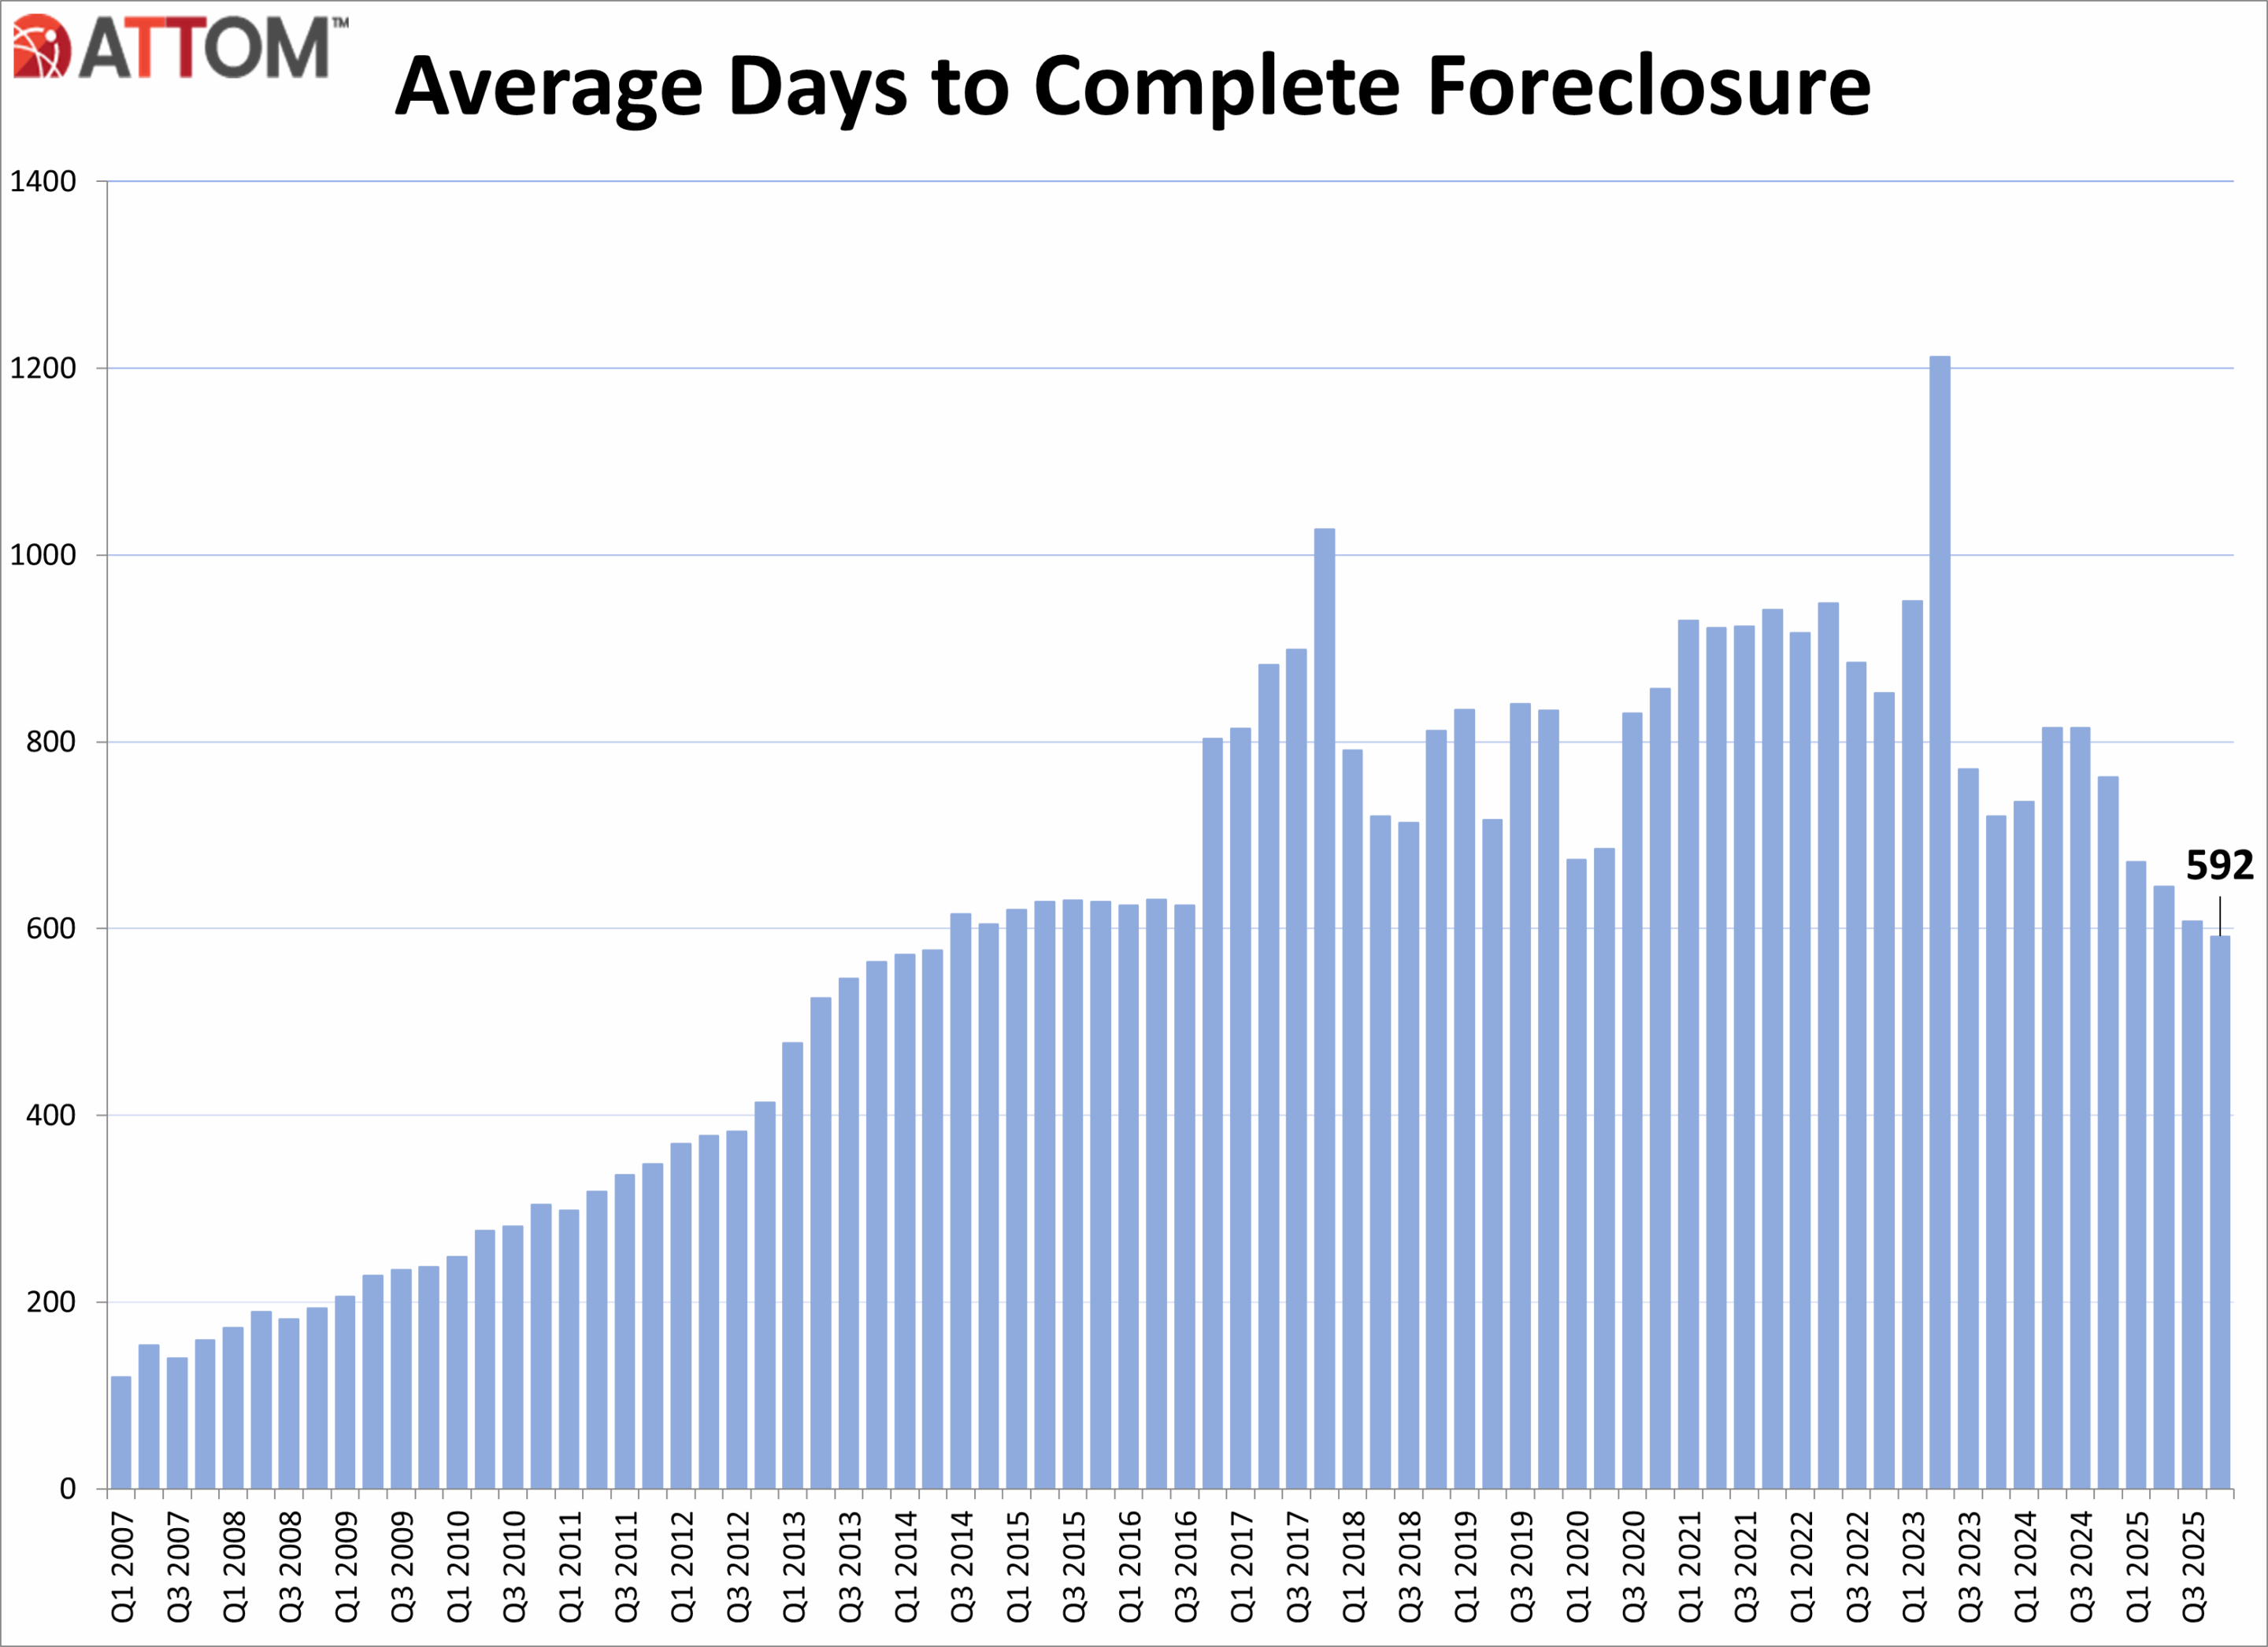
States with the longest average time to foreclose in Q4 2025 were Louisiana (3,461 days); New York (1,998 days); Hawaii (1,760 days); Connecticut (1,600 days); and Kansas (1,594 days).
Powering Real Estate Businesses with Property Data and AnalyticsSolutions For Every Industry
Q4 2025 Foreclosure Activity Key Takeaways
December 2025 Foreclosure Activity Key Takeaways
Conclusion
ATTOM’s Year-End 2025 Foreclosure Market Report shows that U.S. foreclosure activity increased in 2025, with foreclosure filings, starts, and bank repossessions all rising compared to 2024, signaling a continued shift toward more normalized market conditions. Despite the annual increases, foreclosure activity remains significantly below pre-pandemic levels and far below peaks seen during the last housing crisis. December 2025 and Q4 2025 data also showed increased foreclosure activity on both a monthly and annual basis.
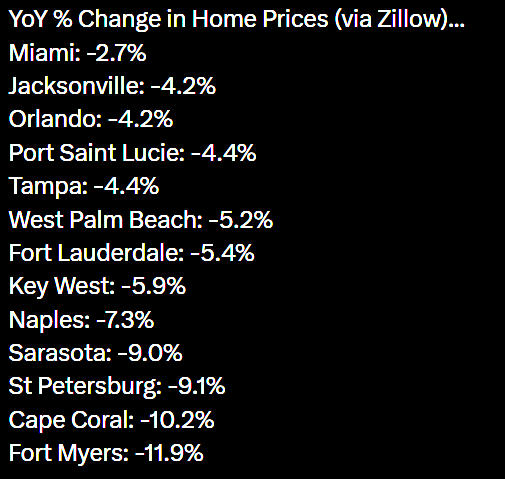
Florida home prices are tanking with Fort Myers leading the collapse at -11.9% YoY.

President Trump ordered Fannie Mae and Freddie Mac to operate like The Federal Reserve. Buying assets to manipulate interest rates. In this case, F&F have been ordered to buy $200 billion of agency MBS.
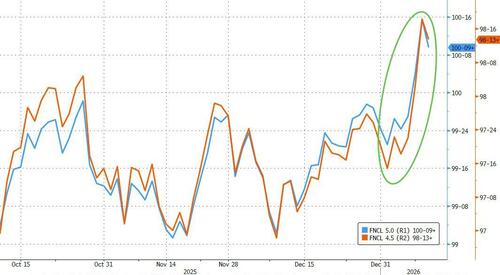
Thursday’s Truth Social post triggered an immediate snap tighter in mortgages, led by the belly and lower coupons. By pulling MBS spreads tighter and crowding out real-money buyers, Fannie and Freddie’s purchases would push incremental demand into Treasuries as the next-best duration substitute, putting a modest bid under the belly of the curve.
However, execution and the ultimate size of purchases is still unclear, as my colleague Alyce Andres noted. If the government-sponsored enterprises GSEs stagger purchases, and signal an ultimate increase above the announces $200 billion, further tightening should occur. They can fund a lot of the buys from existing liquidity portfolios, though there’s a path where they could issue short-term debt to preserve operating buffers and could nudge repo wider at the margin.
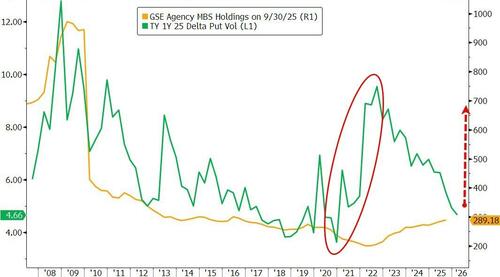
The bigger transmission channel is hedging, as highlighted by colleagues Ira Jersey and Will Hoffman. Unlike the Fed, the GSEs actively hedge MBS holdings, shedding duration by paying fixed rates in swaps and using swaptions to manage the negative convexity and vega risks embedded in mortgages. That matters for swap spreads and for volatility, especially in the belly.
That’s why GSE MBS purchases don’t have to be huge to change the feel in rate markets. The post-Global Financial Crisis regime dulled the classic convexity feedback loop because the Fed held such a large amount of agency MBS and didn’t hedge it, while the GSEs shrank their portfolios. Trump’s directive risks bringing more of that regime back.
A recent note out of Goldman Sachs frames it cleanly: A $200 billion build could lift the active convexity-hedger footprint by about 25%. The street then starts front-running the mechanical flows — paying in selloffs, receiving in rallies — which makes breakouts more likely even if day-to-day ranges look calm, Goldman added.
Positioning makes the setup more precarious. JPMorgan already saw mortgage valuations as a “bit snug” before the announcement, while BofA flagged that rates market had recently added fresh belly shorts sitting against a backdrop of benchmark funds still overweight MBS versus IG.
That mix can keep the initial tightening sticky, but it also raises the odds of sharp reversals if the market decides the purchasing flows are slower, smaller, or more heavily hedged than hoped.
Fannie and Freddie’s retained portfolio are soaring along with the duration gap.

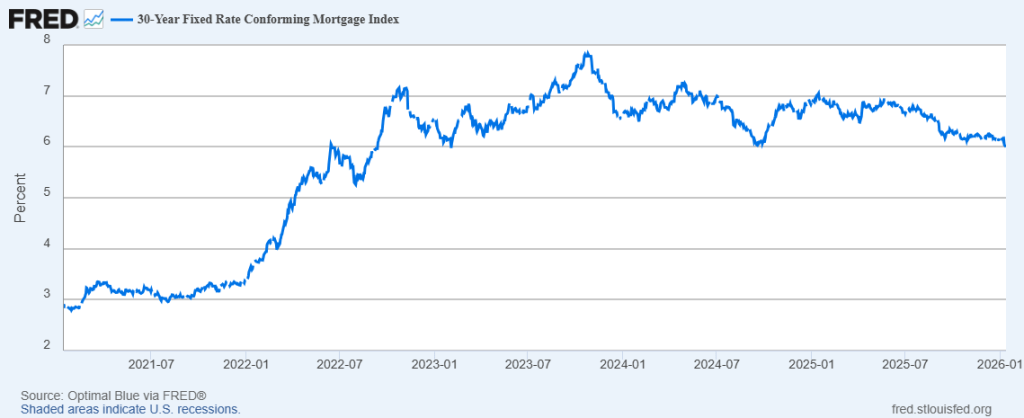
The effect on mortgage rates has so far has been negligible. The 30-year conforming mortgage just fell below 6% at 5.99%.
With all the breaking news about Maduro’s capture in Venezuela and the potential collapse of Iran’s Islamic government, I will provide some good news for investors about Mortgage-backed Securities (MBS).
Mortgage-backed securities (MBS) are capping off an exceptionally strong 2025 with further outperformance in December, beating the rest of the aggregate bond market on an excess return basis. Both total and excess returns for full year 2025 were the highest in more than a decade. MBS performance has been boosted by spread tightening as volatility declined and scarce net supply that was met with resilient demand, including renewed GSE and overseas buying.
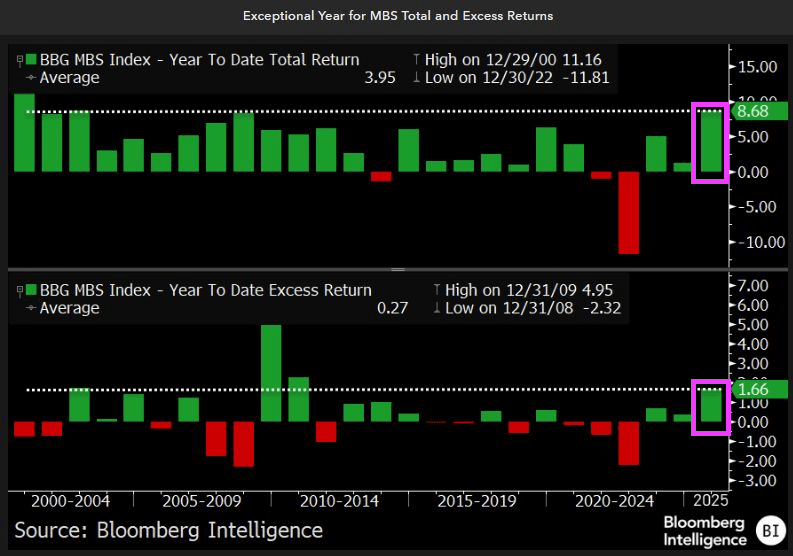
Thanks to University of Chicago graduate Erica Adelberg.
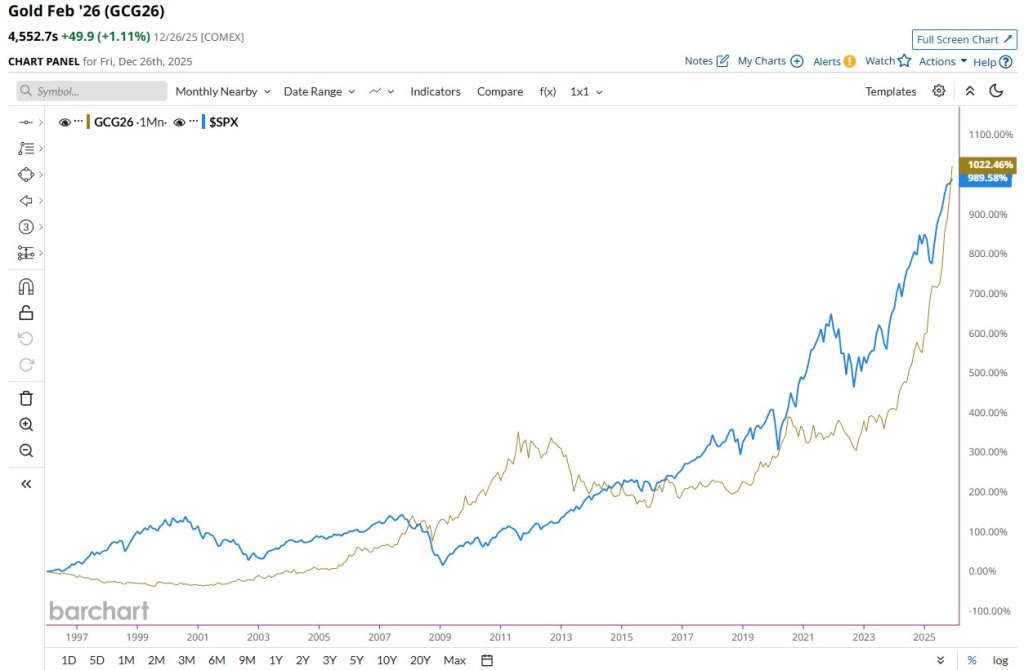
Gold and silver. Gold is now outperforming the Stock Market over the last 30 years.
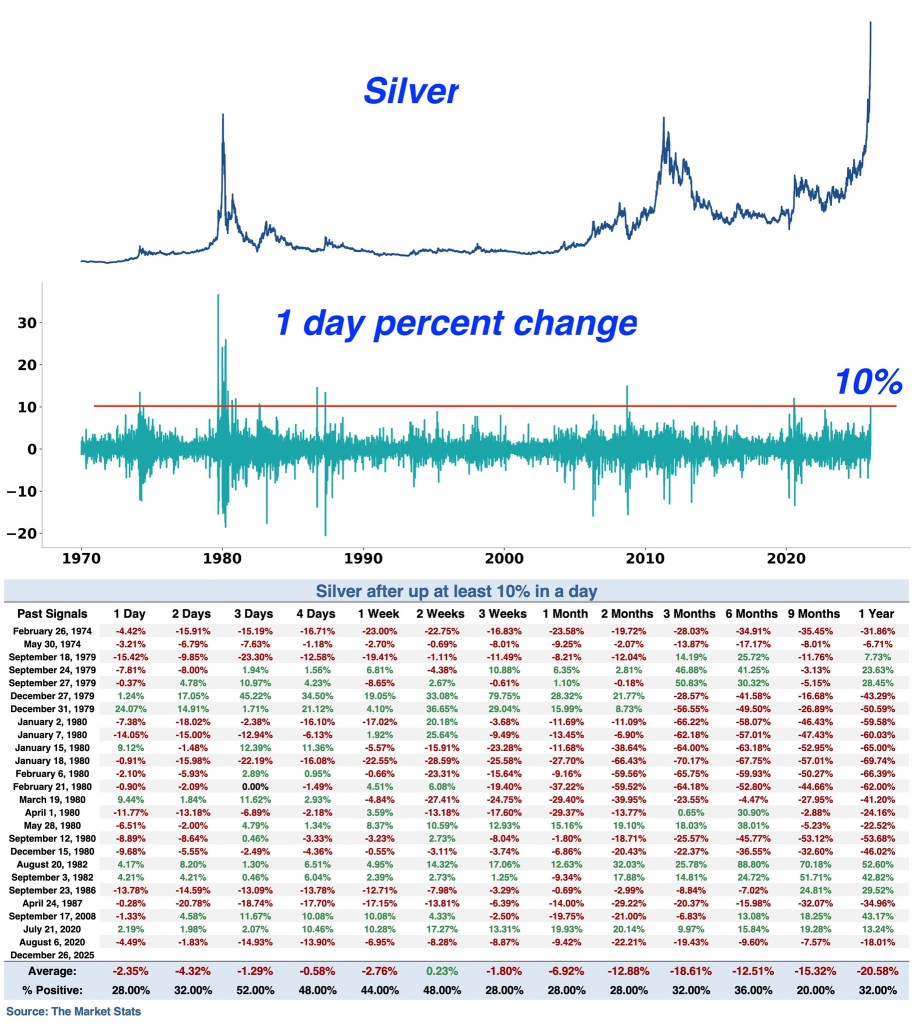
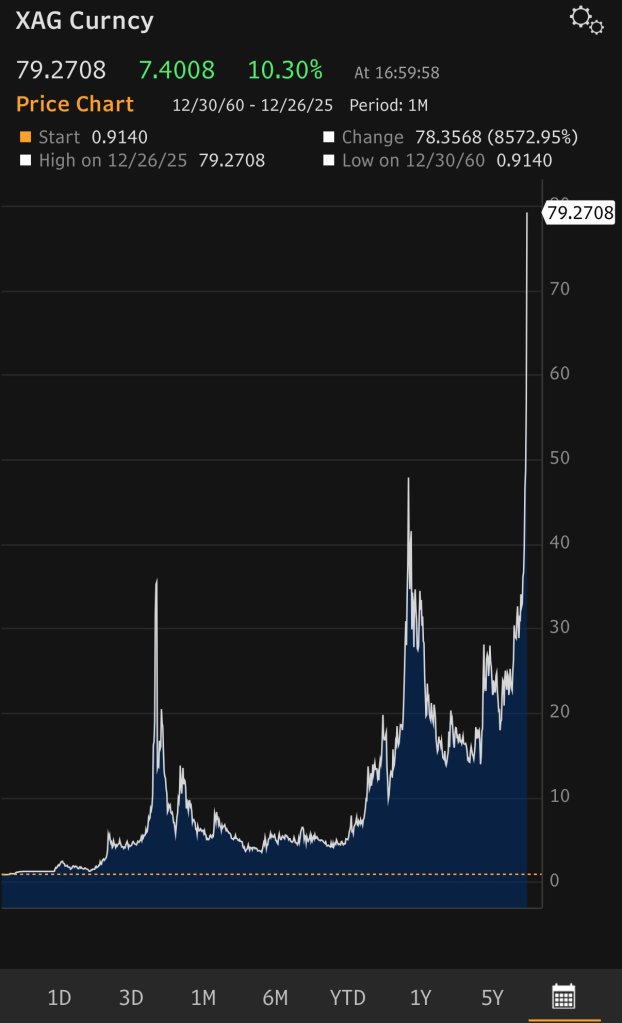
Silver is up 10% on Friday.
Silver (XAG) just hit the $79.2708 price point.
Dino’s song. A shout-out to David Freiberg on the Gibson SG bass and John Cipollina on the Gibson SG guitar. I love the Gibson SG!

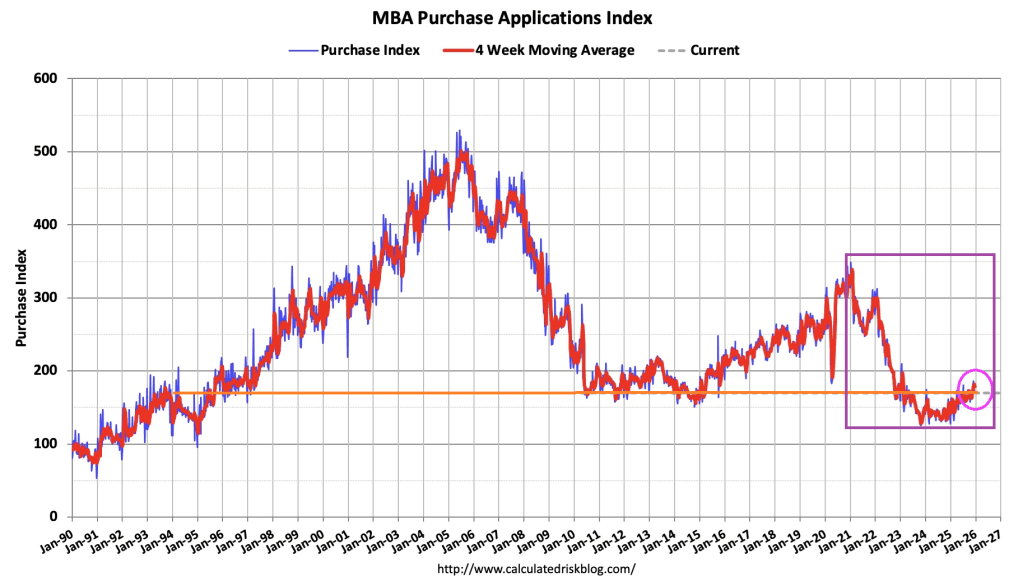
Twas the end of the year and mortgage demand is poor, but the new year is just around the corner and mortgage demand will rise.
The Market Composite Index, a measure of mortgage loan application volume, decreased 5.0 percent on a seasonally adjusted basis from one week earlier. On an unadjusted basis, the Index decreased 6 percent compared with the previous week. The seasonally adjusted Purchase Index decreased 4 percent from one week earlier. The unadjusted Purchase Index decreased 6 percent compared with the previous week and was 16 percent higher than the same week one year ago.
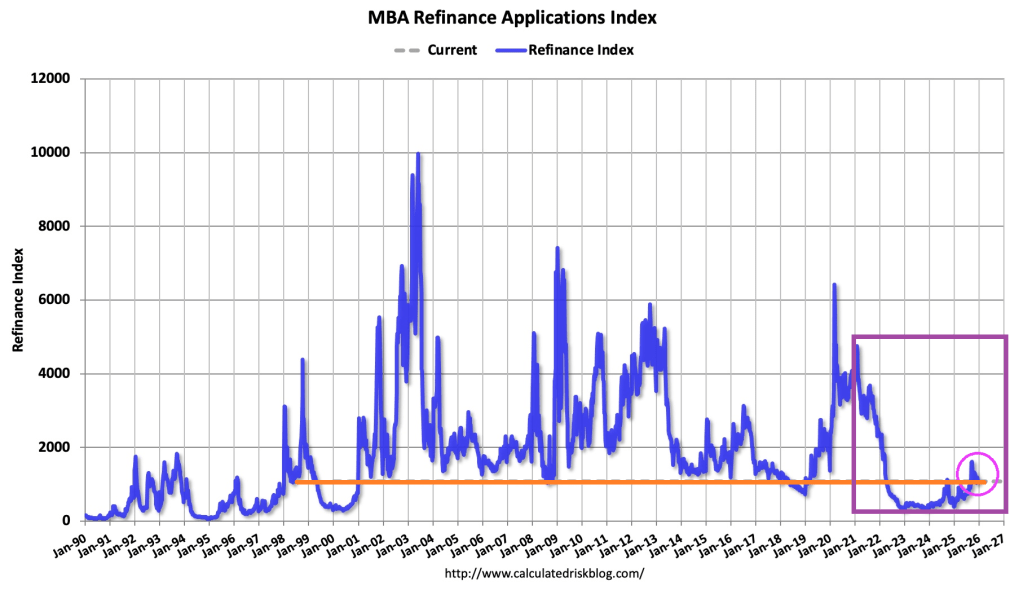
The Refinance Index decreased 6 percent from the previous week and was 110 percent higher than the same week one year ago.
Overall mortgage application volume fell last week, despite the slight decline in mortgage rates. I expect the trends of a softening job market, sticky inflation, elevated home inventories, and steady mortgage rates will persist into the new year.

You must be logged in to post a comment.