The US economy is gradually recovering from Bidenomics (government/donor dictated spending). Mortgage applications increased 11.2 percent from one week earlier, according to data from the Mortgage Bankers Association’s (MBA) Weekly Mortgage Applications Survey for the week ending March 7, 2025.
The Market Composite Index, a measure of mortgage loan application volume, increased 11.2 percent on a seasonally adjusted basis from one week earlier. On an unadjusted basis, the Index increased 12 percent compared with the previous week. The seasonally adjusted Purchase Index increased 7 percent from one week earlier. The unadjusted Purchase Index increased 8 percent compared with the previous week and was 4 percent higher than the same week one year ago.
The Refinance Index increased 16 percent from the previous week and was 90 percent higher than the same week one year ago.
Mortgage rates declined for the sixth consecutive week, with the 30-year fixed rate dropping to 6.67 percent, the lowest level since October 2024. As a result, applications increased over the week and were up 31 percent from a year ago.
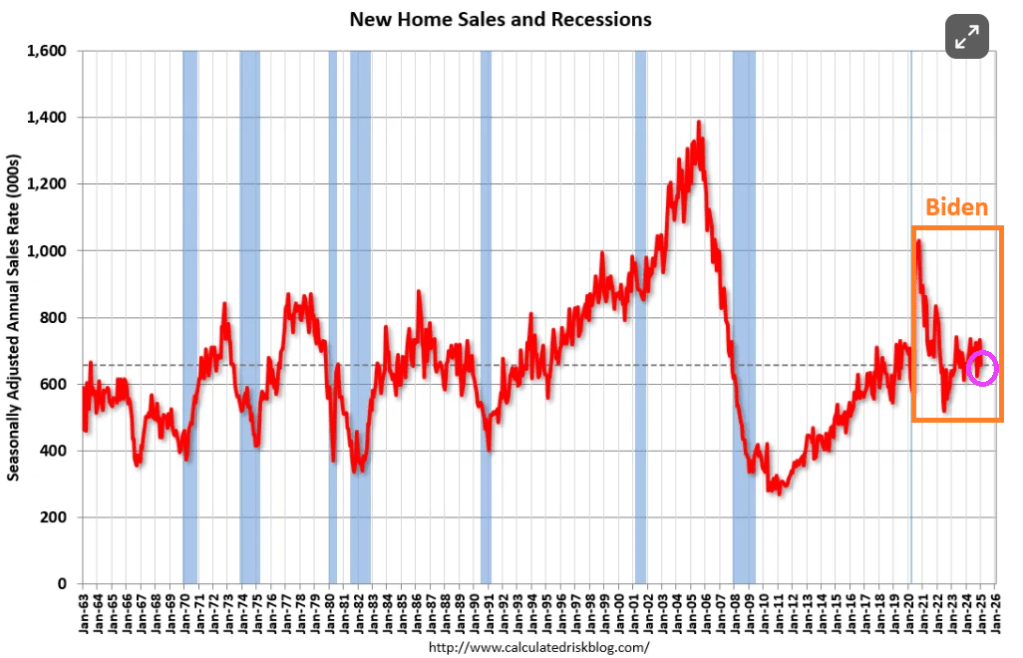
High housing prices, high commodity prices, high interest rates. All thanks to Biden’s horrible top-down economic policies. Its as is Biden was humming “I’m going to take prices higher” while he was President.
Sales of new single-family houses in January 2025 were at a seasonally adjusted annual rate of 657,000, according to estimates released jointly today by the U.S. Census Bureau and the Department of Housing and Urban Development. This is 10.5 percent below the revised December rate of 734,000 and is 1.1 percent below the January 2024 estimate of 664,000.
The most unaffordble countries are Portugal, Canada, the USA, Switzerland, and the Czech Republic. The most affordable? Romania, Finland, Italy, and Bulgaria.
For the USA, Hawaii and California are the least affordable while West Virginia and Iowa are the most affordable.
The left has come out in force to attack D.O.G.E. and Elon Musk. Why? First, The Left doesn’t want to upset the candy apple cart (government waste and corruption). Second, the Left wants to pretend that they hate the rich (although George/Alexander Soros are huge donors, not to mention Bill Gates and most of Hollywood elites are billionaires/millionaires). But the saddest act of all are Joe Biden and Kamala Harris. These two clowns had the Social Security data and never looked at it … allegedly.
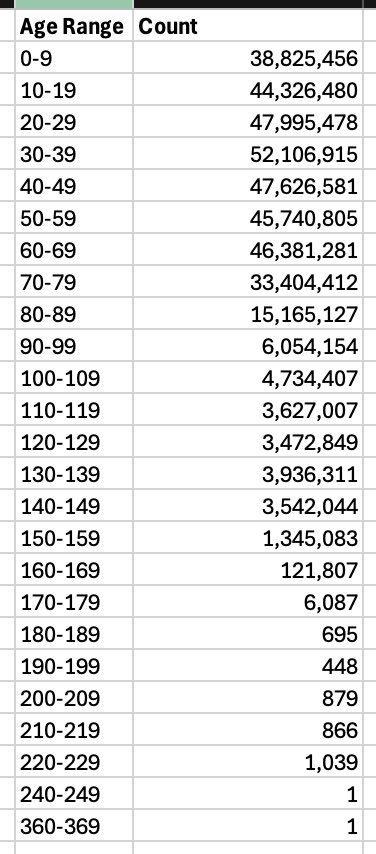
What would they have found if they had looked at the Social Security books? According to Elon Musk, they would have discovered 20,788,904 people at the age of 100 and above. That is significantly higher that the entire population of Naples Florida at 19,704.
Here is what Elon Musk discovered about people receiving Social Security (and disability payments). Joe and Kamala didnt notice someone that was between 360 and 369 years of age??
The point is that this is a collosal embarrasment. And epic fraud. And even more vexxing is that 394,943,364 are collecting Social Security while the total population of the USA is 334 Million?? That leaves 60 million more people receiving Social Security payments than there are people in the USA!
Don’t tell Elon about candied apples that have replaced government cheese in the Federal government giveaway program for votes!And Cloward/Piven!
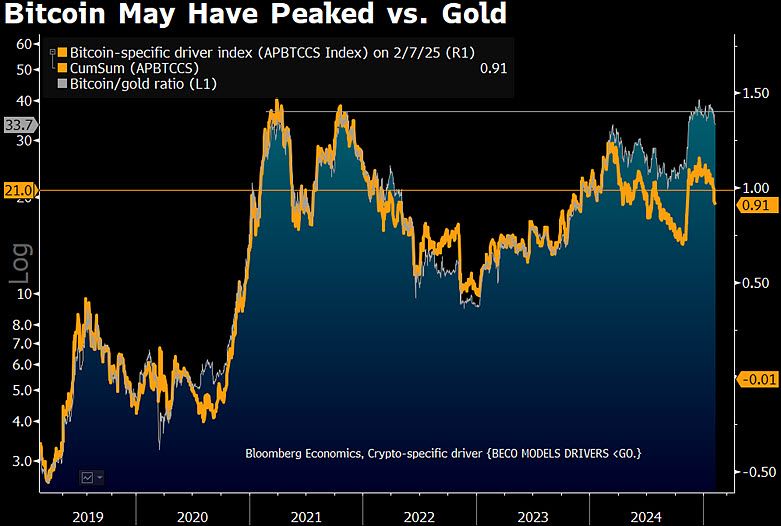
Mike McGlone has an interesting perspective on Bitcoin versus Gold.
Gold $3,000, Bitcoin $70,000?
Is there good reason for reversion lower? My bias is leaning that way, especially if the US hashtag#stockmarket reverses some of last year’s almost $12 trillion advance, about 40% of GDP.
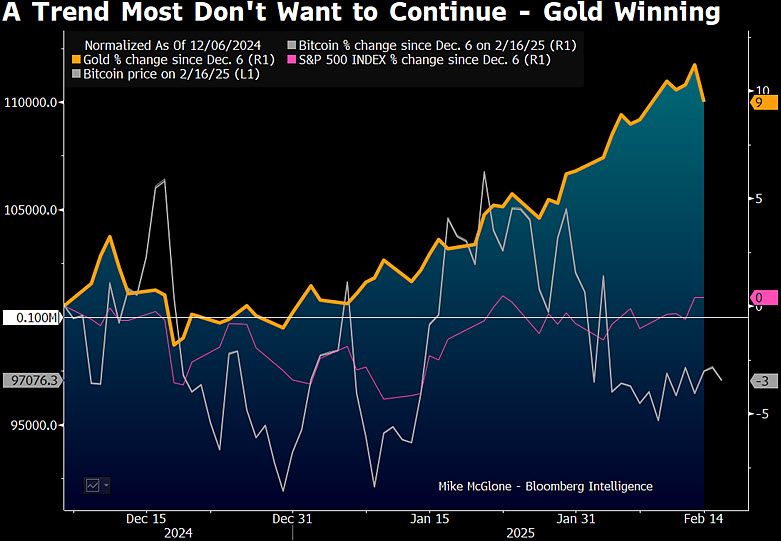
Bitcoin approaching $150,000 in 2025 might suggest another $12+ trillion year of US stockmarket wealth creation, inflation and Fed tightening. Heading toward $50,000 could coincide with some typical deflation following the inflation and put the Fed at ease. Up about 10% since Bitcoin first closed above $100,000, gold may sniffing out a bit of risk-asset normalization. So it appears gold is winning.
Full disclosure: I own both. Plus silver. And a house.
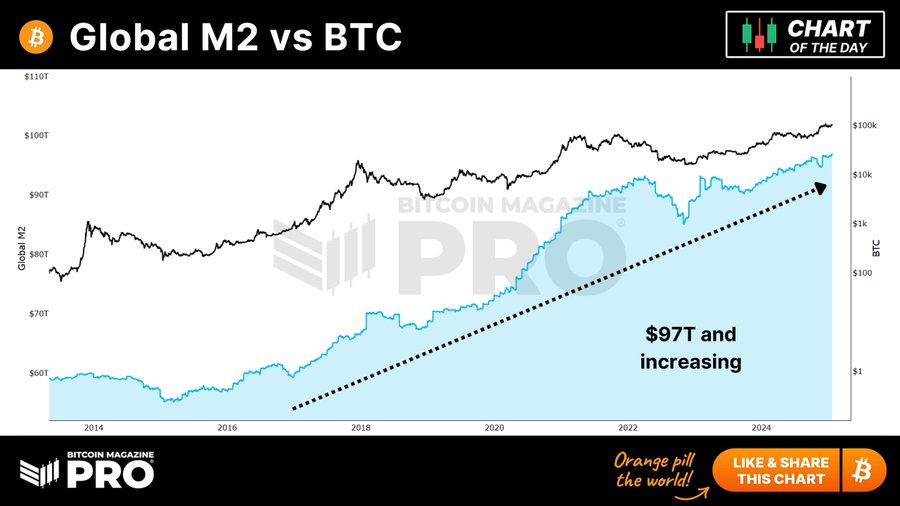
Nobel prize winner in economics, Gene Fama, said recently that cryptocurrencies will eventually be worthless. Well Gene, not if The Federal Reserve and other central banks keep printing money.
Global M2 money supply is at $97T and increasing. And with the increase in global M2, bitcoin and other cryptos are likely to keep rising.
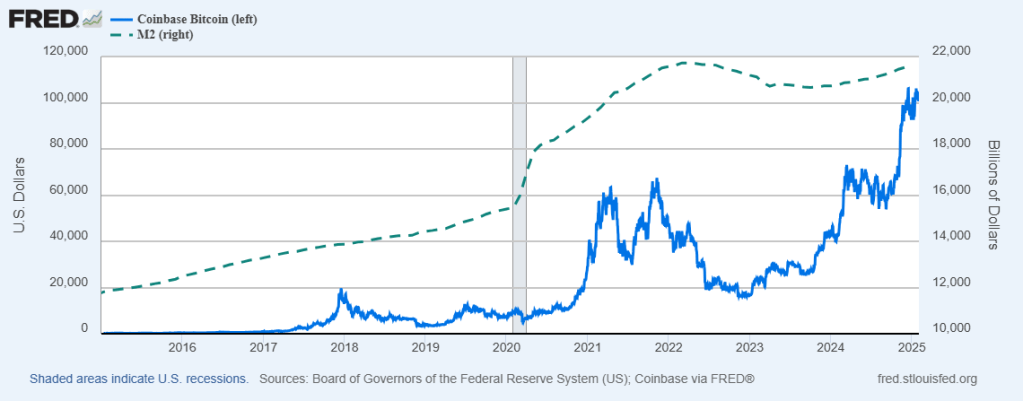
On the US side, M2 Money has increased 12.7% under reckless spending Joe Biden while Bitcoin has increased 249%.
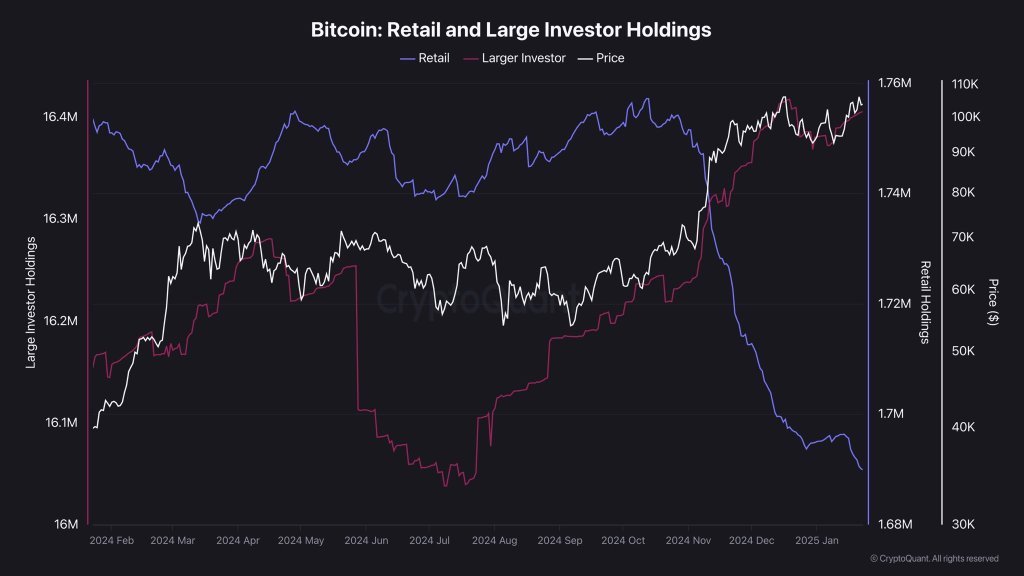
Retail investor holdings have declined while large investor holdings as Bitcoin increases in price.
On a different note, the Philadelphia Eagles will be playing the Kansas City Swifties next Sunday.
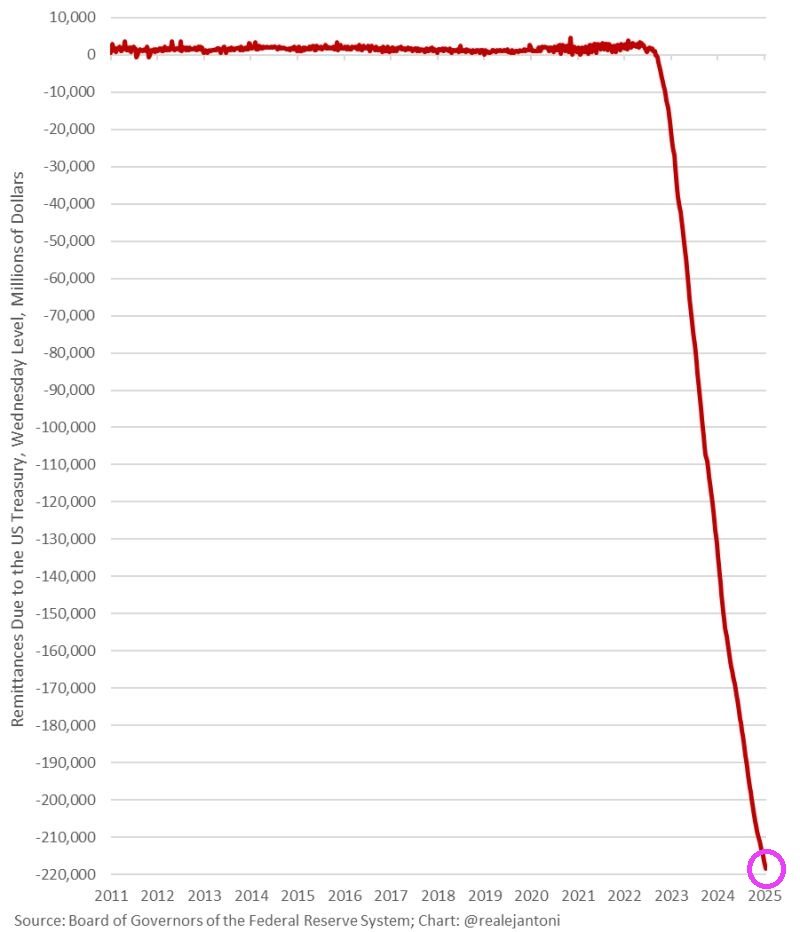
The Federal Reserve (aka, The Green Slime) represents the Spirit of Washington DC. A glutenous pig spending trillions it doesn’t have on insane policies. And The Fed ends up funding the insane spending and racking up massive losses.
Trump is inheriting a Federal Reserve w/ not only unprecedented losses of $218 billion, but it’s still losing money; the Fed won’t send the Treasury a dime for the entirety of Trump’s term; that’s never happened since the inception of the Fed – another challenge for Trump.
Wow. Money printing by The Federal Reserve went will after the Covid outbreak in early 2020. So did Federal spending. Unfortunately, politicians are addicted to Federal spending. And Senators like Chuck Schumer (D-NY) and Adam Schiff (D-CA) are trying to obstruct any spending cuts by Trump and his DOGE.
Well, M1 Money printing is UP 365% since Covid while M2 Money printing is UP 40%.
Federal current expenditures are up 45% since the Covid outbreak. But were never returned to normal spending levels.
New York senator Chuck Schumer is opposed to Trump’s efforts to cut Federal spending. Is Senator Schumer REALLY the political boss of Tammany Hall, the Democratic Party’s political machine that played a major role in the politics of 19th-century New York City and State?
One reason that US home prices remain high (and unaffordable for many) is The Federal Reserve (aka, The Green Slime). Former Fed Chair (and Biden’s Treasury Secretary is no Luciana Paluzzi, the Italian beauty from the James Bond film Thunderball. Yellen is just a far-left economic hack.
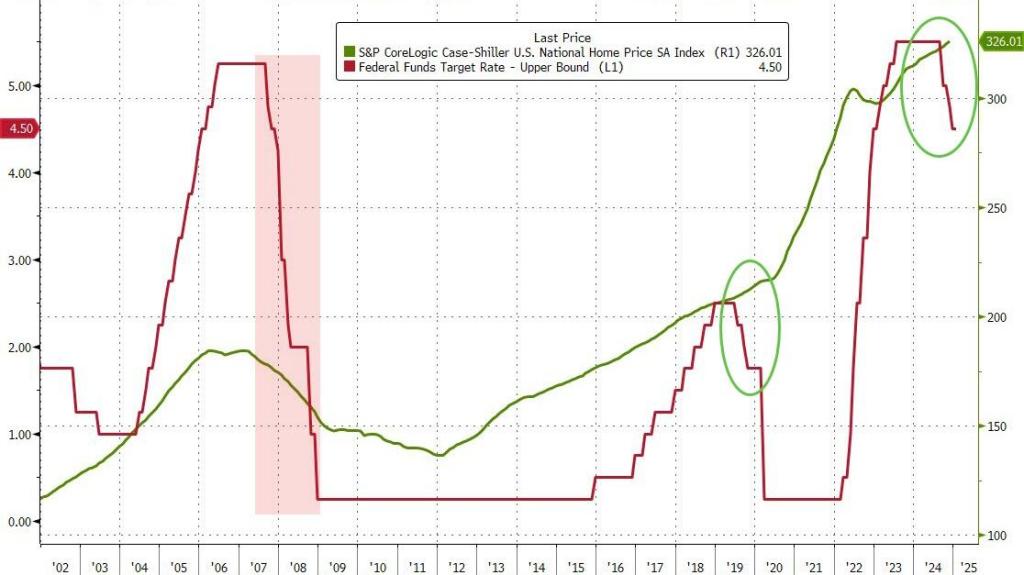
Look at the Case-Shiller national home price index compared with The Fed funds target rate.
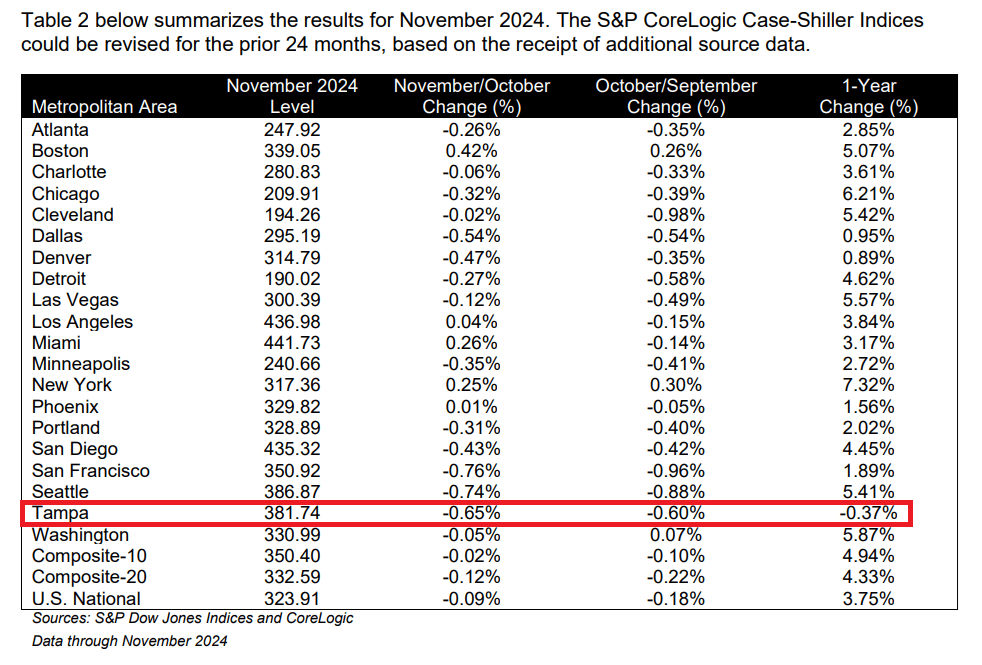
The S&P CoreLogic Case-Shiller U.S. National Home Price NSA Index, covering all nine U.S. census divisions, reported a 3.8% annual return for November, up from a 3.6% annual gain in the previous month. The 10-City Composite saw an annual increase of 4.9%, recording the same annual increase in the previous month. The 20-City Composite posted a year-over-year increase of 4.3%, up from a 4.2% increase in the previous month. New York again reported the highest annual gain among the 20 cities with a 7.3% increase in November, followed by Chicago and Washington with annual increases of 6.2% and 5.9%, respectively. Tampa posted the lowest return, falling 0.4%.
The pre-seasonally adjusted U.S. National, 20-City, and 10-City Composite Indices’ upward trends continued to reverse in November, with a -0.1% drop for the national index, while the 20-City Composite saw a -0.1% decline and the 10-City Composite was unchanged.
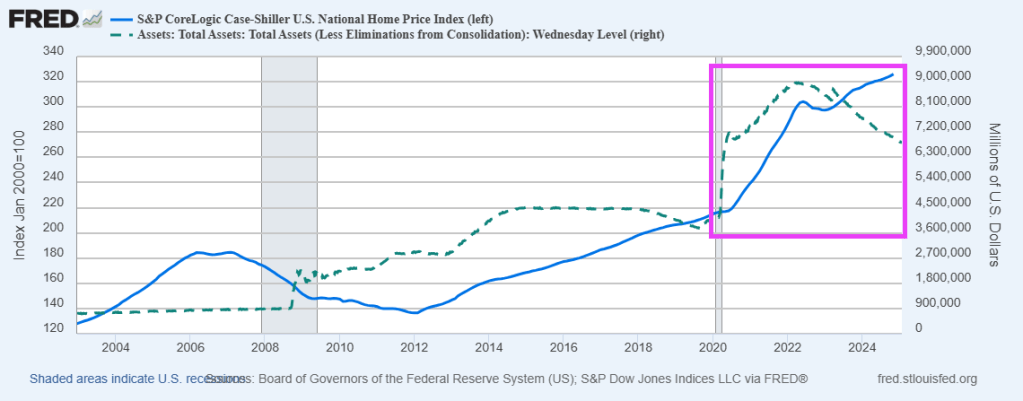
While the Fed Funds target rate gyrates, The Fed’s balance sheet remains high.


You must be logged in to post a comment.