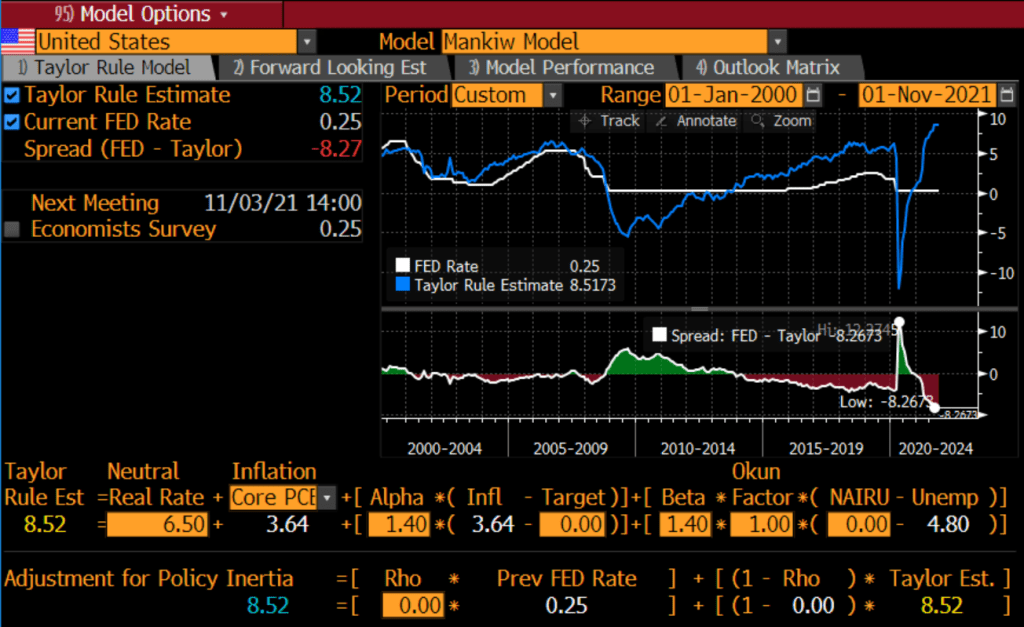
As we approach another Fed Open Market Committee (FOMC) meeting (November 3rd), it is time to look at the Taylor Rule, created by Stanford economist John Taylor to help everyone understand what The Fed is likely to do. Unfortunately, The Fed doesn’t do what expected.
For example, look at the Taylor Rule using Greg Mankiw’s specification. It says The Fed Funds Target Rate should be 8.52%, not the lowly 0.25% it is today.
That is a big gap between where The Taylor Rule says we should be and where Powell and the FOMC is.
Will The Fed raise their target rate on November 3rd? Or at least start slowing the balance sheet?
With central banks around the world signalling tighter policy amid rising prices, Lagarde said the ECB had done much “soul-searching” over its stance but concluded that inflation was still temporary, so a policy response would be premature.
Soul-searching? The ECB is just doing what Powell and the Fed (aka, Jerome Jett and the Blackhearts) are doing. Keeping the foot on the monetary gas pedal in the face of inflation.
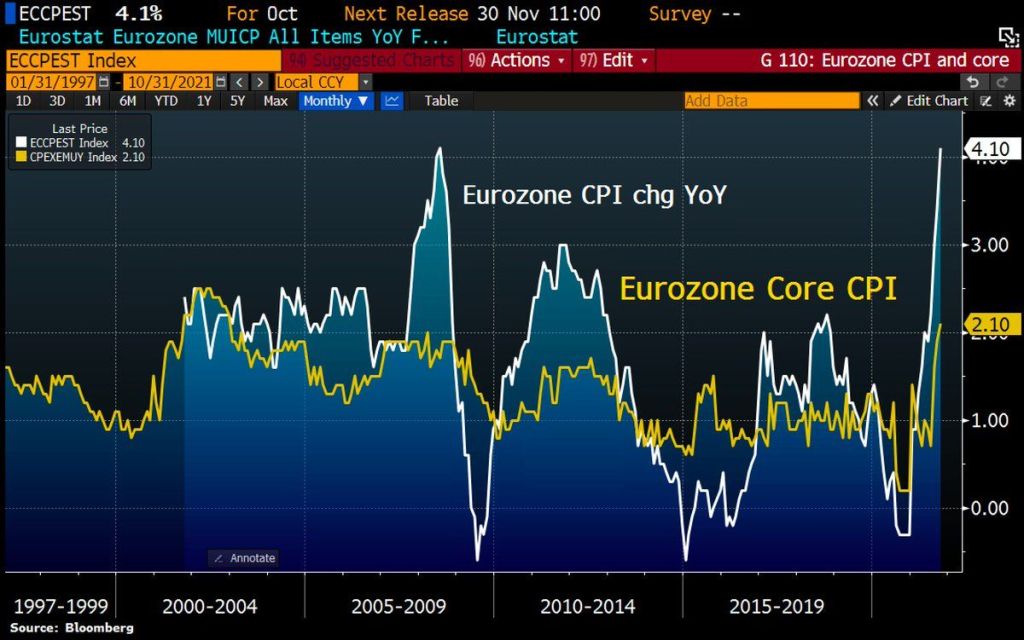
Let’s start Eurozone inflation. It is now sitting a 4.10% YoY. And core inflation is sitting at 2.10% YoY. Inflation is now the highest since 2009 while core inflation is at the highest since 2001.
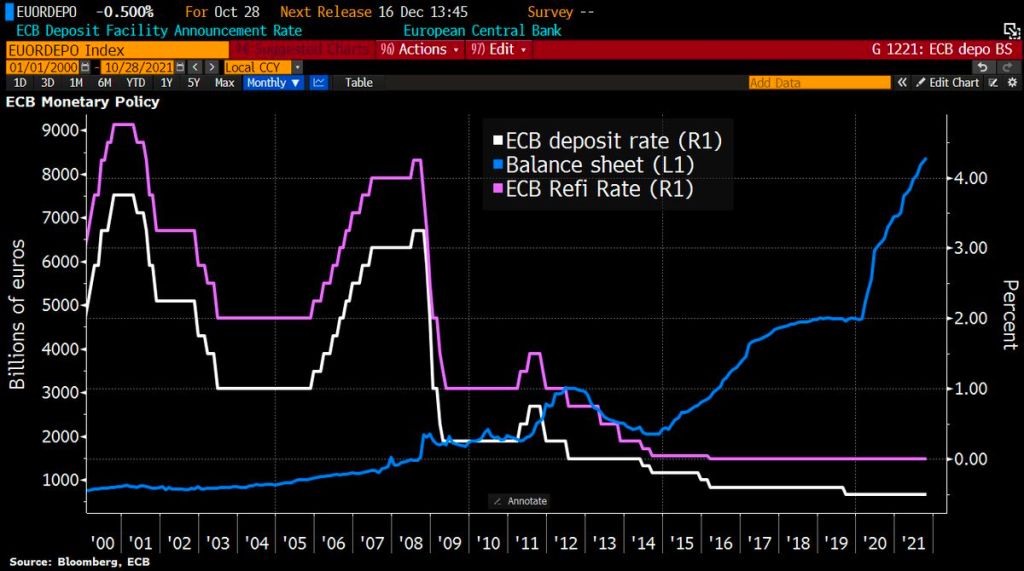
Like the Federal Reserve, the ECB still has its foot on the monetary accelerator pedal despite booming inflation.
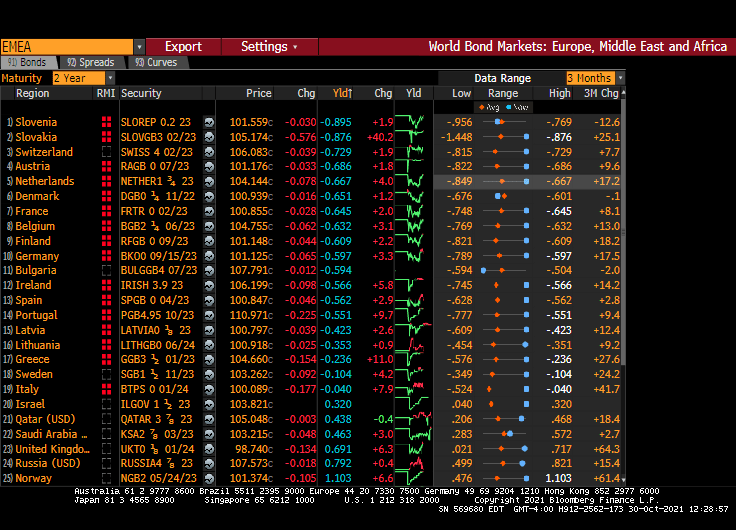
So, Christine, 19 nations in “Europe” having negative 2-year sovereign yields isn’t low enough for you?
The ECB’s platform in Frankfurt reminds me of a bad TV quiz show where participants try to guess prices next year. Call it “The Price Is Wrong.”
Unless, of course, the ECB sees a massive depression ahead.
(Bloomberg) — The largest owner of U.S. rental houses isn’t seeing any let-up in demand, or in its ability to increase rents.
Invitation Homes Inc., which owns more than 80,000 single-family rentals, raised prices by nearly 11% in the third quarter, according to a statement. The company boosted rents by 8% on renewals and 18% when leasing homes to new tenants. Rates are rising fastest in the Southwest, where rents increased 30% on new leases in Las Vegas, and 29% in Phoenix.
“It’s a little bit crazy,” Chief Executive Officer Dallas Tanner said on a conference call with investors Thursday. “There just isn’t enough quality housing available right now.”
Rising rents have been a staple of the economy since early Covid lockdowns lifted in the middle of last year. Surging purchase prices have pushed homeownership out of reach for first-time buyers.
Invitation’s properties, which tend be more centrally located than those owned by other institutional landlords, have been especially popular. And tenants tended to stay put: The company had a record-low turnover rate in the quarter, which reduced the expenses associated with preparing a house for leasing.
Invitation’s shares rose slightly to $40.77 at 12:49 p.m. New York time after the company raised its expectations for full- year revenue and net operating income. The stock is up 37% for the year.
As Milton Friedman once said, “If you put the federal government in charge of the Sahara Desert, in 5 years there’d be a shortage of sand.” In this case, The Federal government and Federal Reserve were put in charge of the Covid epidemic and we have shortages of almost everything. Including housing.
I don’t have Invitations rent growth chart, but here is Zillow’s YoY rent chart against The Fed’s balance sheet.
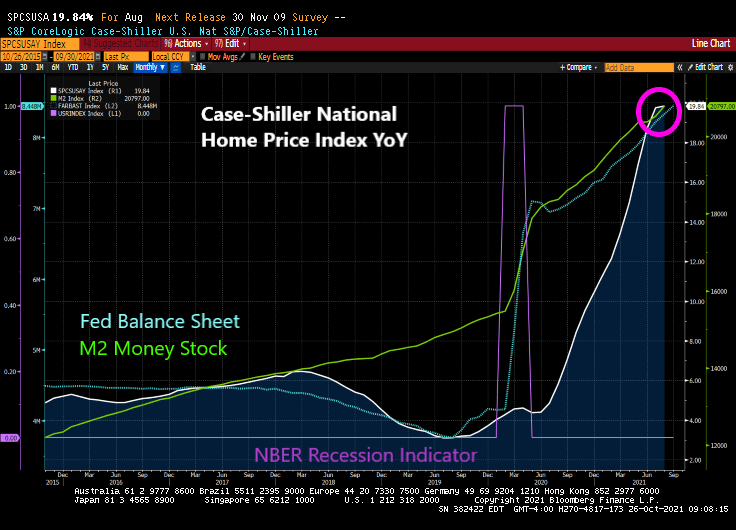
The good news? The 11% increase is almost half of the 20% YoY Case-Shiller National home price index.
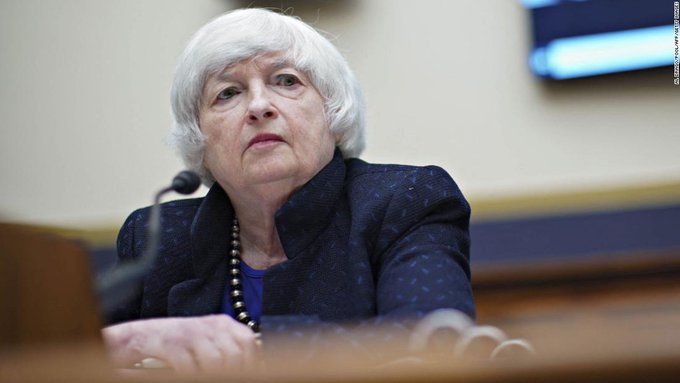
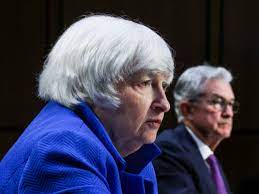
Here is Treasury Secretary Janet Yellen making housing supply disappear.
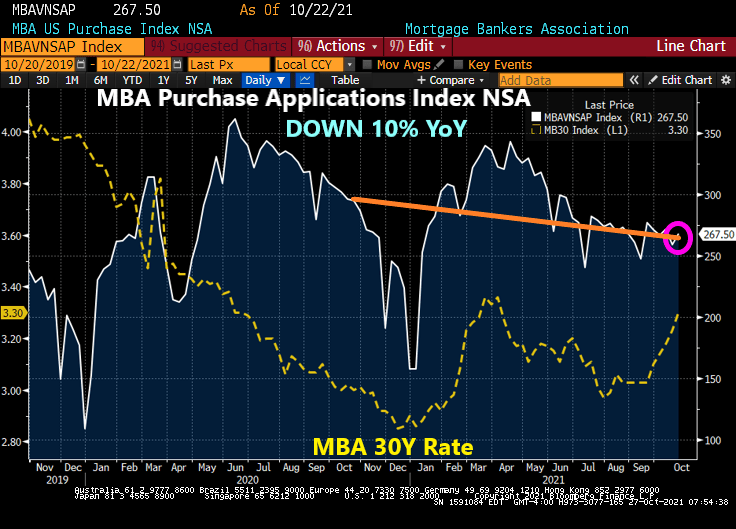
Mortgage purchase applications rose 3.24% from the previous week, according to data from the Mortgage Bankers Association. However, purchase applications are down 9.3% from
Mortgage refinancing applications declined -1.57% from the previous week as mortgage rates rose from 3.23% to 3.30%.
Between The Federal Reserve’s unorthodox monetary policy and insane spending from Congress and Biden Administration, we are seeing a near 20% rise in home prices for August.
Please note that pre-COVID the Case-Shiller home price index (national) was growing at 4%. Thanks to Fed Stimulypto, home prices are roaring at near 20% YoY.
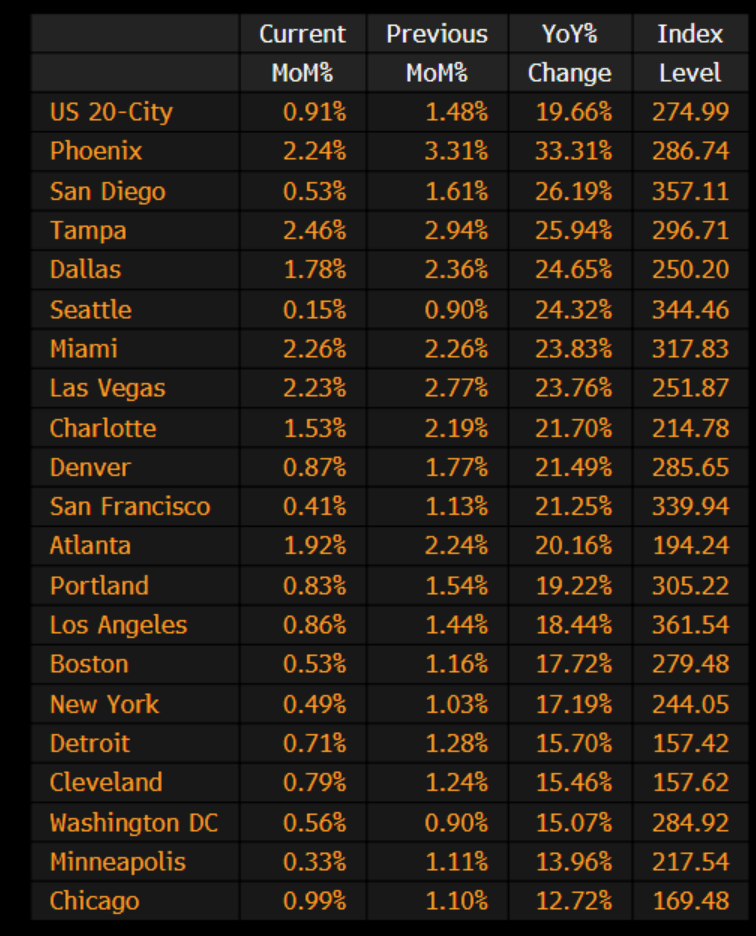
Phoenix AZ home prices are growing at a 33.31% pace. The slowest growing? The US “shoot ’em up” capital, Chicago, is growing at 12.72% and is the slowest growing Case-Shiller 20 city.
I feel like I am living in the movie “Cloverfield” with The Federal Reserve as the uncontrollable monster.
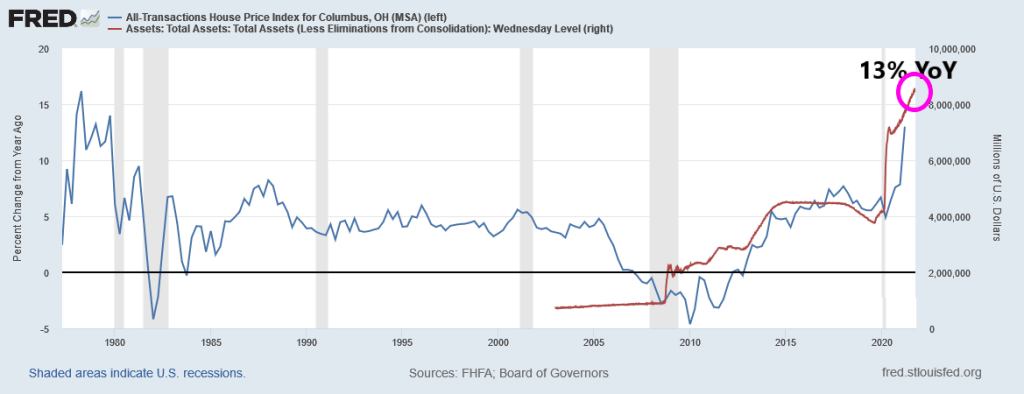
UPDATE: Columbus Ohio as of Q2 2021 is growing at a 13% YoY pace.
I remember my academic colleague at The Ohio State University (now at Notre Dame), Paul Schultz saying “Why do you find fixed-income and the yield curve interesting?” I have always found the yield curve to be interesting … at least until The Federal Reserve hammered down the short-end with it zero-interest rate policy (ZIRP) and tried manipulating the 10-year Treasury Note yield through Quantitative Easing (QE) meaning The Fed’s purchase of Treasuries and Agency Mortgage-backed Securities (MBS). No, I still think the manipulated yield curve is interesting.
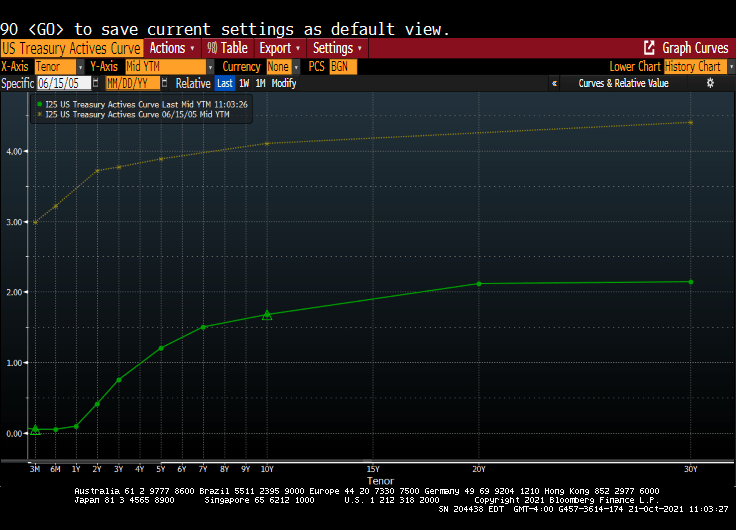
Here is today’s Treasury actives curve (green) versus the yield curve at the peak of the previous housing bubble in 2005 yellow). That is a 300 basis point shift as the short-end. And a 243 basis point shift for the 10-year Treasury Note.
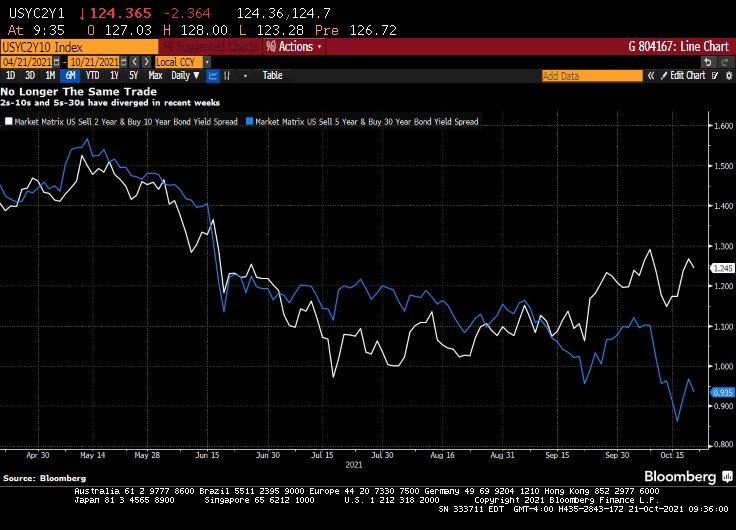
(Bloomberg) — The yield curve is one of the most-powerful forces in the observable financial universe. While much of the price action that we see on a day-to-day basis may be driven by some sort of dark energy, the curve provides a highly visible lodestone indicating the state of policy settings and the likely trajectory of the economy. That being said, the curve is often misunderstood — a bear flattening often produces plenty of hand-wringing, when it’s the bull steepening that you should really worry about. In fact, referring to “the curve” itself is something of a misnomer — while different iterations of the yield curve often travel in tandem, sometimes their paths diverge. That has been the case recently, though perhaps not for much longer. The recent rise in two-year yields looks more than justified, as various fixed income models demonstrate in a roundabout way.
For the past year and a half or so, most of the focus on the yield curve in this column has been on the 5s-30s iteration. The rationale for this has been relatively straightforward: With the Fed funds rate locked in near zero for the foreseeable future, the two-year note has been moribund. As such, 2s-10s has really just been another articulation of the 10-year yield. And much like recent price action vis-a-vis my 10-year model, the curve briefly traded where it “ought” to in March before once again becoming too flat in recent months.
At least 5s-30s has had the benefit of containing a useful forward-looking component on both legs of the spread. Yet even as I type that, it is interesting to note that 2s-10s and 5s-30s exhibited virtually identical price action at virtually identical levels earlier this year. While they remain positively correlated, of course, a clear wedge has emerged between the two curves as five-year yields have broken decisively through 1%, pricing greater conviction that a monetary tightening cycle will fully emerge over the next half-decade.
Yet I am left to wonder about the two-year note. The eurodollar strip is pricing that the bulk of monetary tightening will come by the end of 2023, a period that’s now largely captured by the shortest-maturity coupon security. To be sure, the appropriate level for 2s is a function not only of the ultimate magnitude of monetary tightening, but when it begins. After all, a 150 bp hike in Q4 of 2023 carries very different implications for the current two-year note than a 25 bp rate rise every three months from Q3 of next year onwards.
It occurred to me that I could back out a model for two-year yields by simply subtracting the output of my yield curve model from that of the 10-year model. I had no real idea of what to expect from this exercise, but even with the proviso that short-end yields rarely stray too far from the policy rate, I was pleasantly surprised at how close the fit is from this “derivative” model for the two-year.
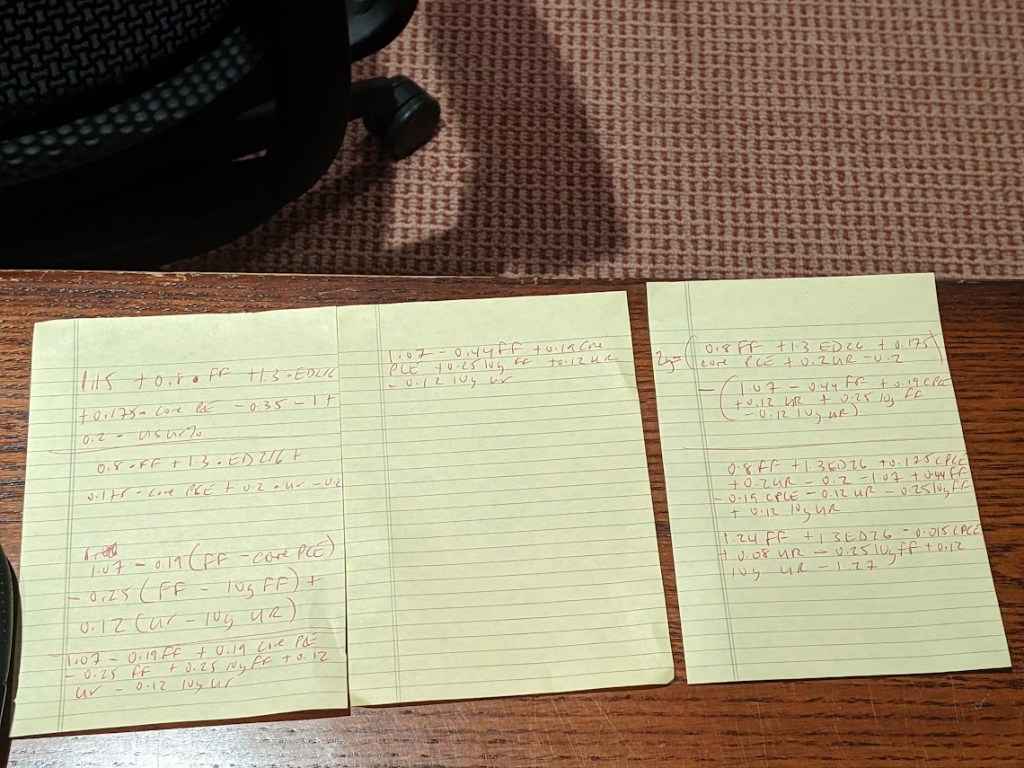
The question then arose, naturally, of what actually went into the calculation of this “model.” After all, knowing the formulae of the two constituent models — for the 10-year and the yield curve– should allow for the distillation of a separate equation for the two-year note. Because that sort of thing is more fun than unpacking more boxes, that’s how I spent a few minutes on Wednesday night. The outcome isn’t necessarily an optimal model for the two-year, but more of an accidental one.
A bit of high school algebra
For what it’s worth, the resultant formula is 2y = 1.24 * FDTR + 1.3 * (ED2 – ED6) -0.015 PCE CYOY + 0.08 * USURTOT – 0.25 * (10y average of FDTR) + 0.12 * (10y average of USURTOT) – 1.27. I am pretty sure that one could get similar results with a simpler framework; the notion that a 2% rise in core inflation is worth just 3 bps on the two-year yield, all else being equal, leaves me simultaneously amused and bemused.
What does seem evident, however, is that henceforth there is going to be considerably more signal generated from two-year yields than has been the case in recent quarters. As such, 2s-10s are going to be worth following again, just as much if not more than 5s-30s. Both nominal yields and the curves are clearly constrained by the notion that all of this inflation kerfuffle really is transitory at its heart, and that, with r* remaining in the gutter, the long-run lid on nominal policy rates is going to be extraordinarily low.
That’s probably as good a null hypothesis as any, and possibly better than most. That being said, if we’re still having a lot of the same inflation conversations a year from now, we’re gonna need a long hard think about whether some of the post-GFC lessons need to be unlearned. In the meantime, at least fixed income is interesting again. I wonder where the yield curve and the model will eventually meet up to shake hands again… -Cameron Crise
The yield curve will become more interesting if Powell and The Gang take their foot off the monetary accelerator pedal.
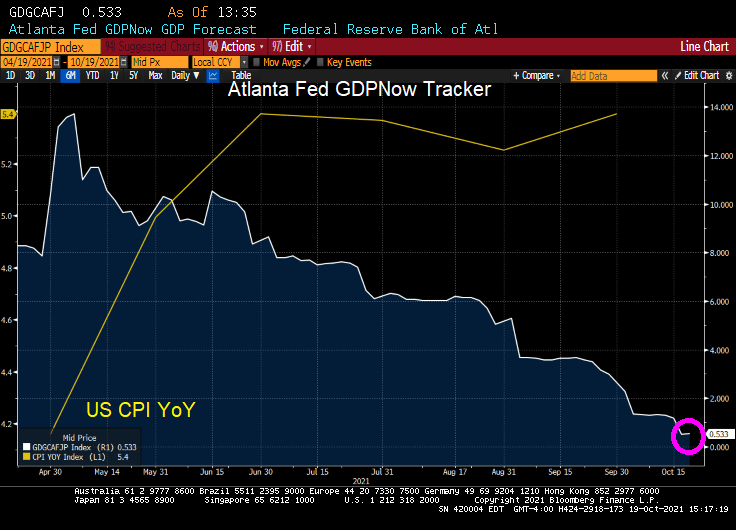
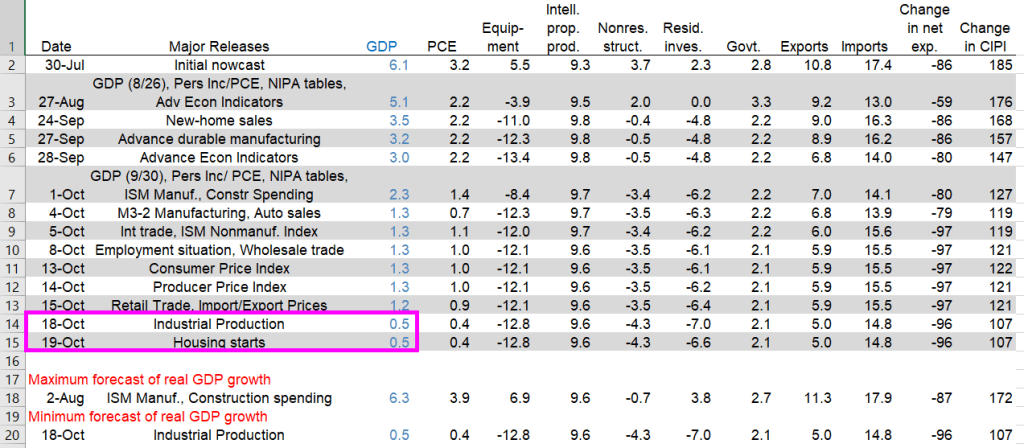
The Atlanta Fed’s GDPNow model estimate for real GDP growth (seasonally adjusted annual rate) in the third quarter of 2021 is 0.5percent on October 19, down from 1.2 percent on October 15. After recent releases from the US Census Bureau and the Federal Reserve Board of Governors, the nowcasts of third-quarter real personal consumption expenditures growth and third-quarter real gross private domestic investment growth decreased from 0.9 percent and 10.6 percent, respectively, to 0.4 percent and 8.4 percent, respectively.
US real GDP nosedived to 0.5% according to the Atlanta Fed GDPNow real-time tracker.
Again, The Fed and Federal government pumped trillions of stimulus into an unprepared economy resulting in massive bottlenecks. So, we are getting declining GDP and rising inflation.
Yesterday’s industrial production dove leading to the 0.5% GDP figure. Today’s housing starts didn’t impact GDP in a meaningful way.
Has The Federal Reserve lost control of the economy? And inflation? The answer is likely yes. Why?
The Covid crisis has been played by the Federal government as an excuse for insane levels for spending coupled with massive monetary stimulus from The Federal Reserve.
As an example of The Fed losing control is US savings. The Fed’s model is to drive savers into consumption, therefore raising production and increasing GDP growth. But alas, The Fed can’t overcome the fear faced by consumers with Covid, Covid shutdowns, and rapidly rising prices.
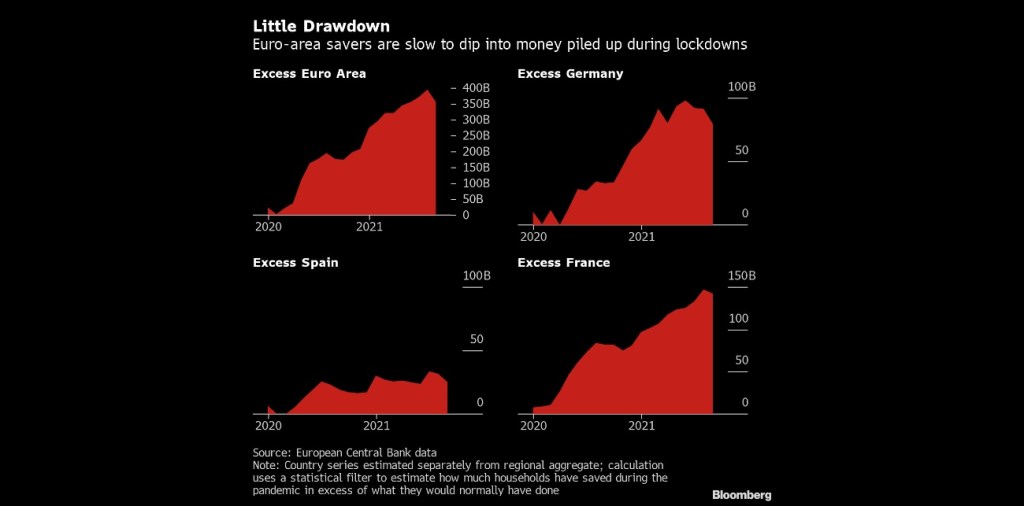
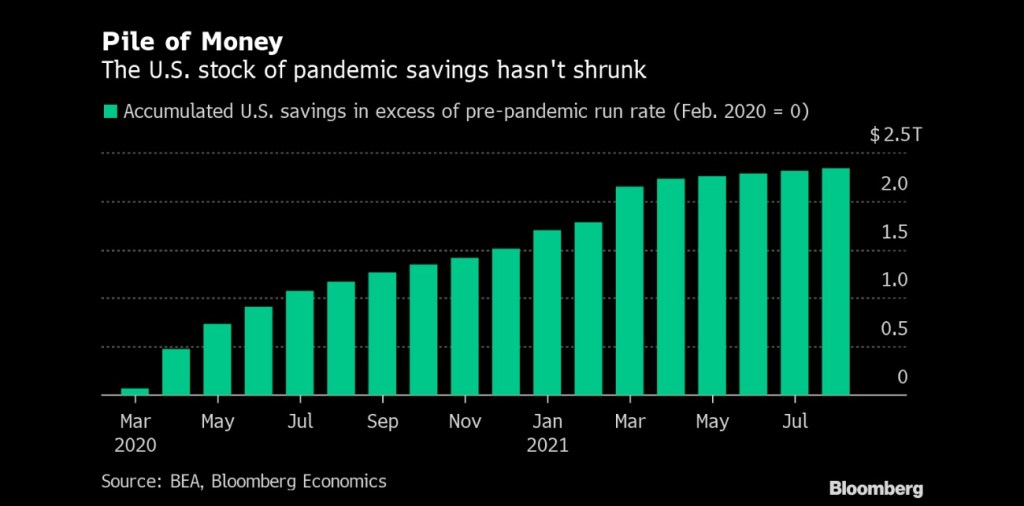
(Bloomberg) — Consumers in Europe and the U.S. aren’t rushing to spend more than $2.7 trillion in savings socked away during the pandemic, dashing hopes for a consumption-fueled boost to economic growth on both sides of the Atlantic.
In the wake of lockdown easing during the northern hemisphere’s summer holiday season, excess savings in euro-area bank balances declined only marginally in August, and Italy still recorded an increase, according to calculations by Bloomberg Economics. In the U.S. there has also been no drawdown, the figures show.
The absence of a consumption surge that had been anticipated by some economists may speak against the prospect of a lasting inflation shock feared by central banks. While higher balances could help households cope with skyrocketing heating bills, tepid demand might temper businesses’ ability to push through permanent price increases.
In the USA, we see accumulated savings despite near-zero deposit rates at banks.
To be sure, The Fed reacted (or overreacted) to the Covid outbreak by increasing the money supply and their purchase of Treasuries and Agency MBS as the Federal government went on a wild spending spree.
But with trillions in Stimulypto Federal spending and Fed money printing, the bottlenecks in the economy (which apparently weren’t known before … ) have contributed to massive price increases that aren’t going away any time soon.
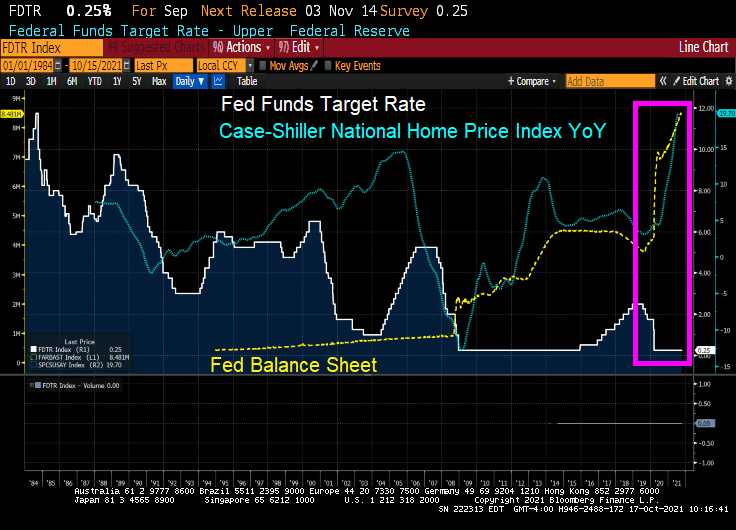
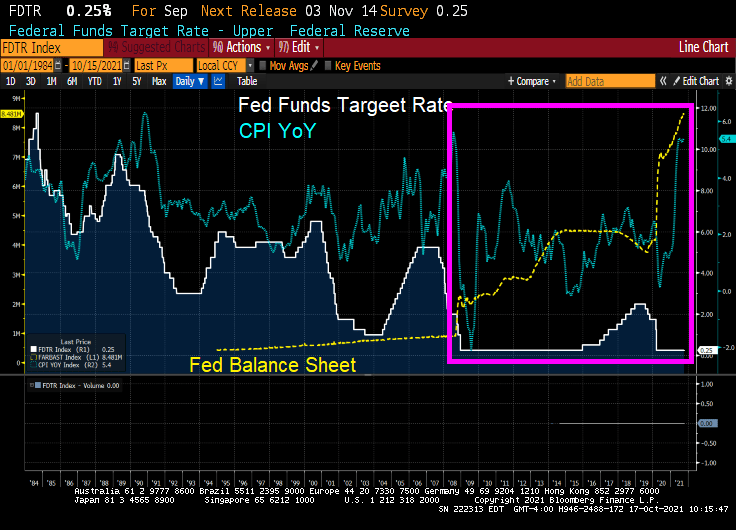
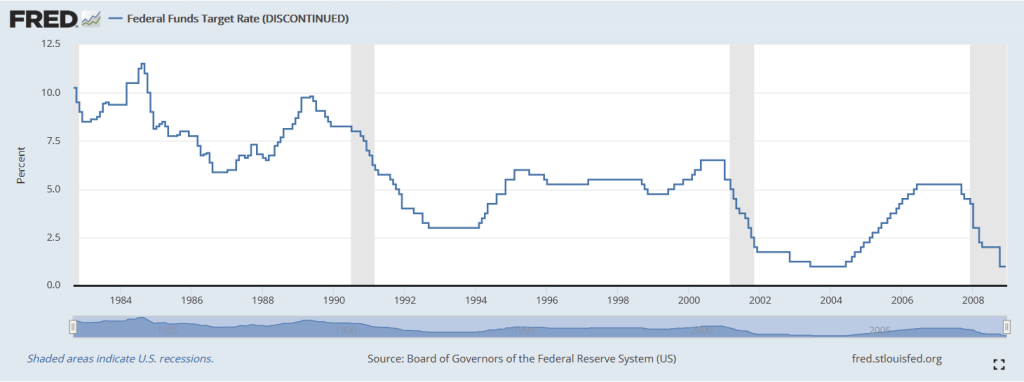
Notice how Fed monetary policies changed after the housing bubble burst and ensuring financial crisis/Great Recession. Before 2008, The Fed periodically whipsawed their Fed Funds target rate. But since late 2008, we have seen hardly any move from The Fed (except for 2017-2020 while Trump was President). For Obama,
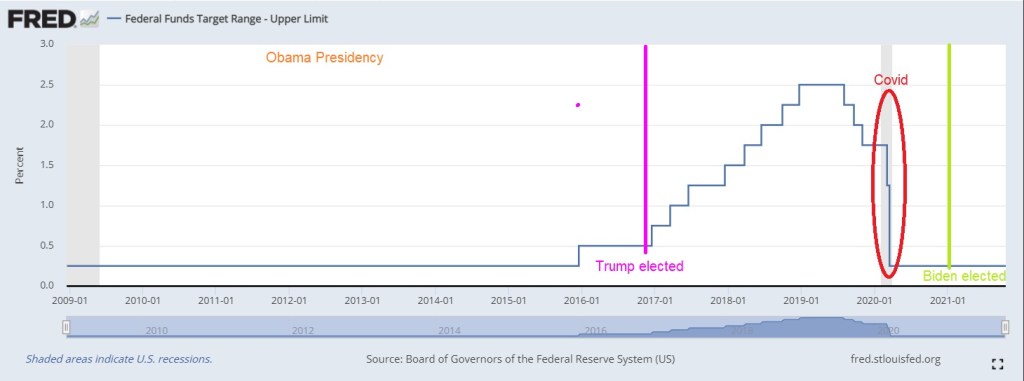
Here is a look at The Fed’s record under Obama, Trump and Biden. The Fed raised their target rate only once under Obama until Trump was elected. Then The Fed raised rates 8 times. Then began lowering them again (5 times) leading to a big drop when Covid stuck. So for Trump, The Fed changed their target rate 13 times compared to 1 rate change under Obama and none under Biden.
And the above chart is only The Fed’s target rate. My point is that Yellen failing to raise rates under Obama has resulted in this over DC-Stimulypto we are seeing today.
Note the difference in Fed policies BEFORE the financial crisis. We need to return to a normal Fed policy rather than the hyper-inflationary zero-rate, QE policies since 2008.
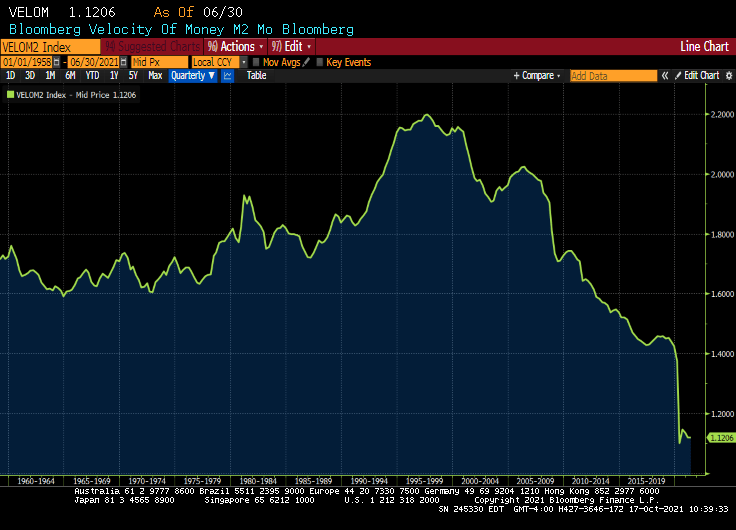
M2 Money velocity (GDP/M2 Money) remains near an all-time low.
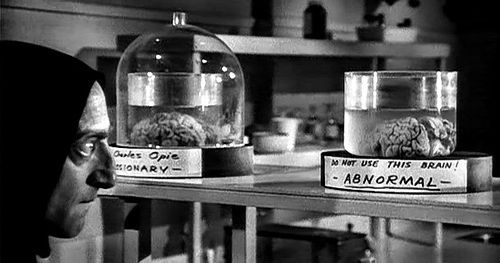
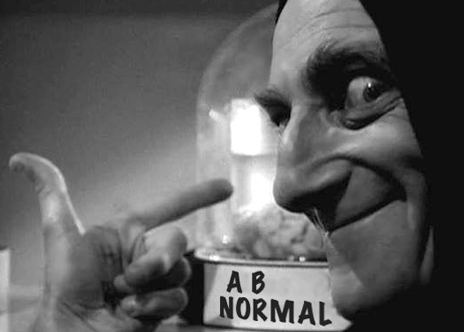
But given DC’s spending spree and all-time lows for M2 Money Velocity, The Fed is going to need to keep purchasing trillions in debt at low interest rates. The abnormal Obama years (Bernanke/Yellen) are the NEW abnormal. Or should I say abby normal policies?
Dr. Frederick FrankensteinAre you saying that I put an abnormal brain into a seven and a half foot long, fifty-four inch wide GORILLA?
So, yes, Bernanke and Yellen put into place abnormal policies that Powell is following into the world’s largest economy (or gorilla).
Only Igor and The Federal Reserve would pick such abnormal policies that ultimately lead to massive misallocations and inflation.
On a side note, do Biden and Transportation Secretary Pete Buttigieg really believe that they can fix the backed-up ports that are flooded with cargo thanks to Stimulypto? By Christmas??
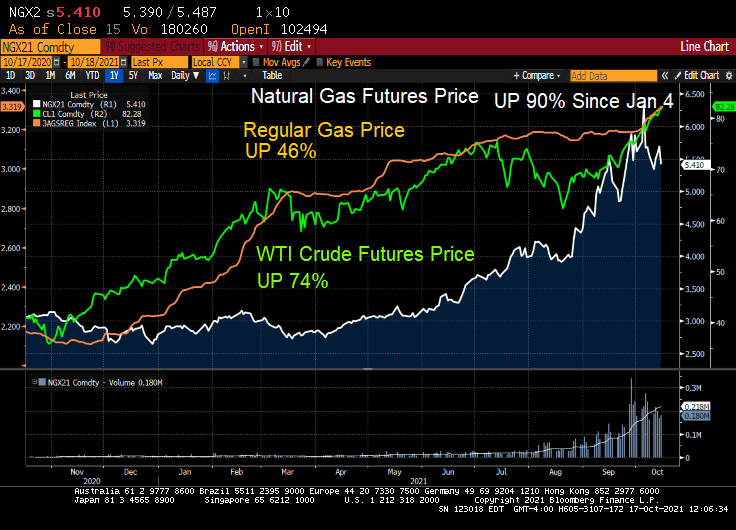
Not with natural gas prices up 90% since January 4th!
At least the Atlanta Fed’s President Raphael Bostic finally admitted that inflation isn’t as transitory as he previously believed. The Fed dumped trillions in liquidity into an economic system that was unprepared for it, and he is surprised that prices are going nuts?
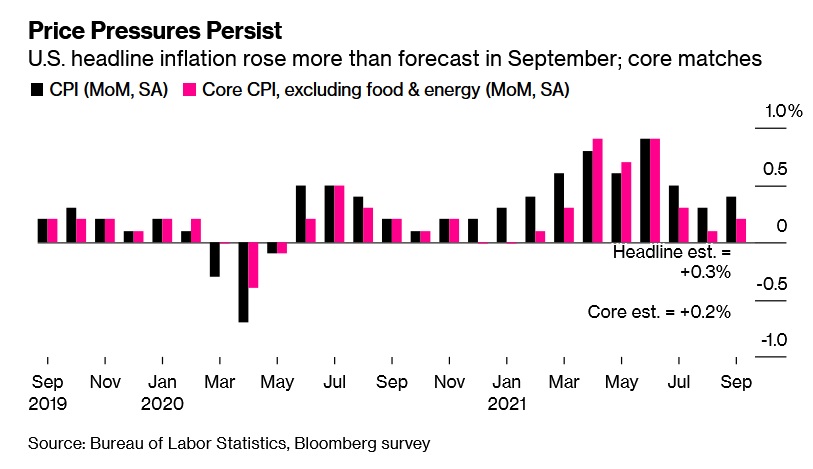
The consumer price index increased 0.4% from August, according to Labor Department data released Wednesday. Compared with a year ago, the CPI rose 5.4%, matching the largest annual gain since 2008. Excluding the volatile food and energy components, so-called core inflation rose 0.2% from the prior month.
Price Pressures Persist
U.S. headline inflation rose more than forecast in September.
Source: Bureau of Labor Statistics, Bloomberg survey
The median estimate in a Bloomberg survey of economists called for a 0.3% monthly gain in the overall measure and a 0.2% advance in the core rate.
A combination of unprecedented shipping challenges, materials shortages, high commodities prices and rising wages have sharply driven up costs for producers. Many have passed some portion of those costs along to consumers, leading to more persistent inflation than many economists — including those at the Federal Reserve — had originally anticipated.
The pickup in price growth seen last month reflected higher food and shelter costs. Meantime, measures of used cars and trucks, apparel and airfares cooled.
U.S. equity futures fluctuated and Treasury yields were little changed following the report.
Hotels, Rents
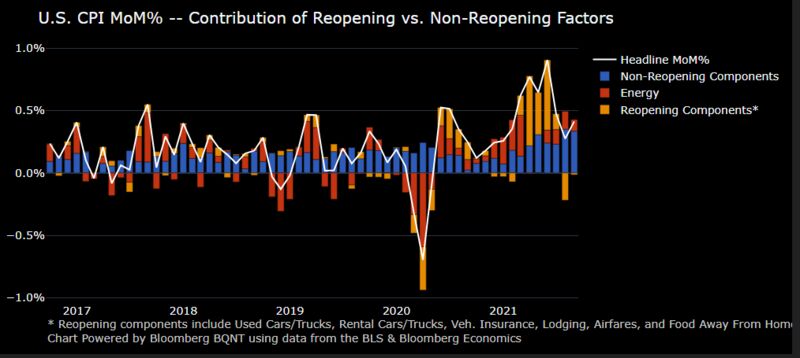
The CPI data reflects crosscurrents in the economy. Hotel fares fell, reflecting the impact of the delta variant on travel, but inflation is broadening out beyond categories associated with reopening.
Higher home prices are now starting to filter through in the data. Rent of primary residence jumped 0.5%, the most since 2001, while a measure of homeowners’ equivalent rent posted the biggest gain in five years. Shelter costs, which are seen as a more structural component of the CPI and make up about a third of the overall index, could prove a more durable tailwind to inflation.
Non-reopening components in CPI have larger contribution to September increase
The report will likely reinforce the Fed’s inclination to soon start tapering its asset purchases, especially as the supply-chain challenges plaguing businesses show little signs of abating. Minutes from last month’s Federal Open Market Committee meeting — out Wednesday afternoon — will provide further insight on policy makers’ views toward progress on employment and inflation goals for tapering.
A New York Fed survey out Tuesday showed U.S. consumers’ expectations for inflation continued to rise in September, with 1-year and 3-year expectations accelerating to record highs.
American consumers are also experiencing higher prices for new vehicles and household furnishings and supplies, which increased by a record 1.3%, the report showed. And looking ahead, elevated energy prices are set to take an additional bite out of workers’ paychecks.
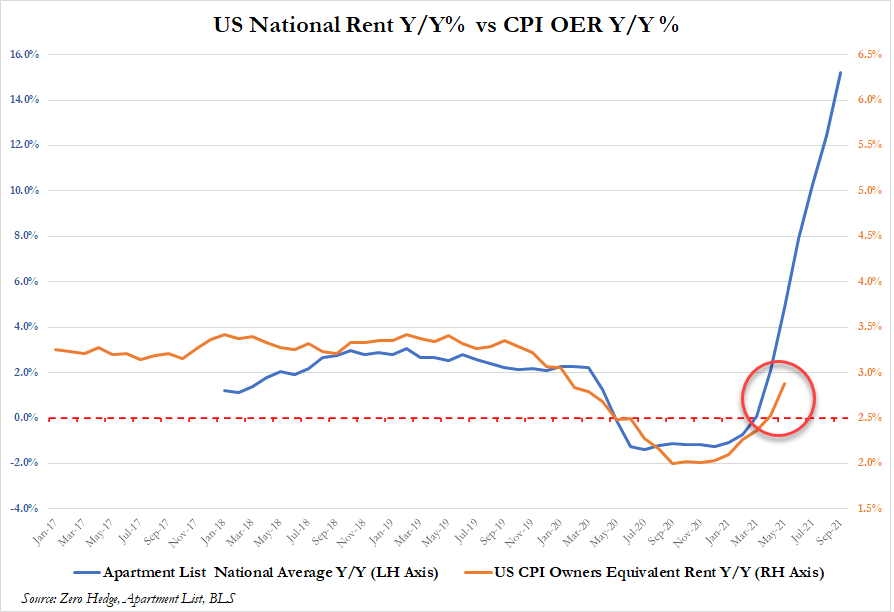
While we know that apartment rents are growing at 15.5% YoY, the CPI for Owner’s Equivalent Rent only rose by 3.2% YoY.















You must be logged in to post a comment.