The Fed Helped Create Housing Bubble I And Then Helped Create Housing Bubble II: The Sequel (Case Study Of Phoenix AZ Home Price Bubble)

Phil Hall of Benzinga wrote a series of excellent articles in four parts for MortgageOrb (although “The Orb” has removed his name). Here are the links to his stories.

https://mortgageorb.com/the-fall-and-rise-of-the-housing-market-part-one

https://mortgageorb.com/the-fall-and-rise-of-the-housing-market-part-two

https://mortgageorb.com/the-fall-and-rise-of-the-housing-market-part-three

https://mortgageorb.com/the-fall-and-rise-of-the-housing-market-part-four

After re-reading these excellent articles on the housing bubble and crash, I thought I would take the opportunity to present a few charts to highlight the housing bubble, pre-crash and post-crash.

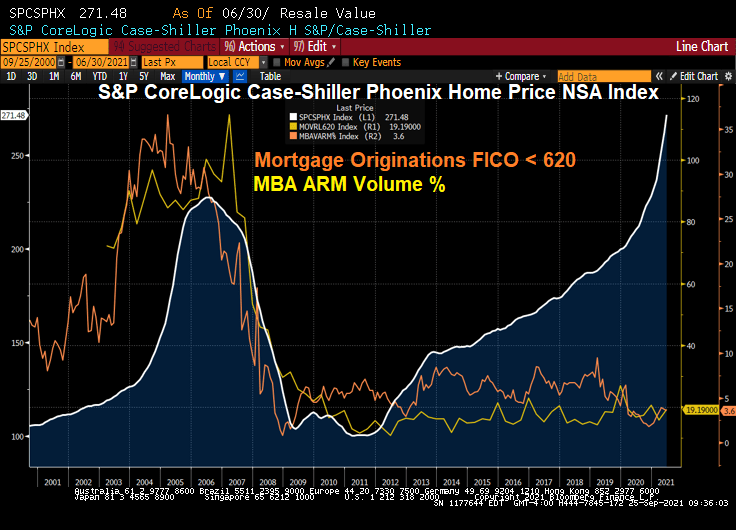
Here is a graph of Phoenix AZ home prices. Note the bubble that peaked in mid 2006. The Phoenix bubble correlates with the large volume of sub-620 FICO lending and Adjustable-rate mortgage (ARM) lending. Bear in mind, many of the ARMs prior to 2010 were NINJA (no income, no job) ARM loans.

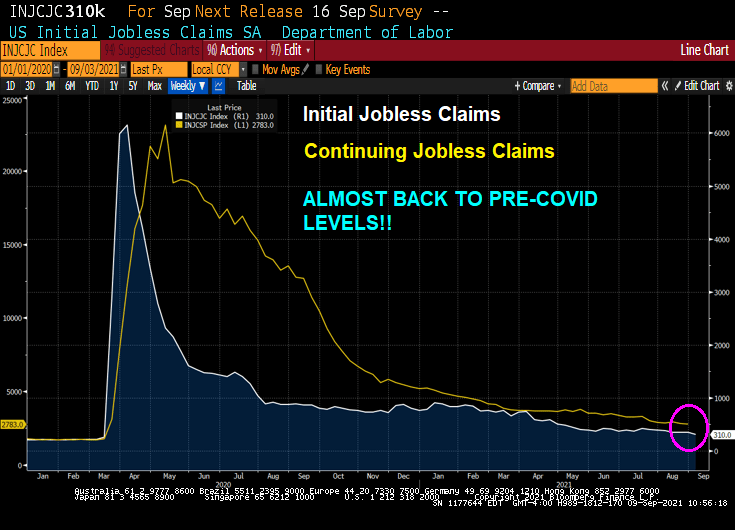
What happened? Serious delinquenices at the national levels spiked as The Great Recession set in and unemployment spiked.

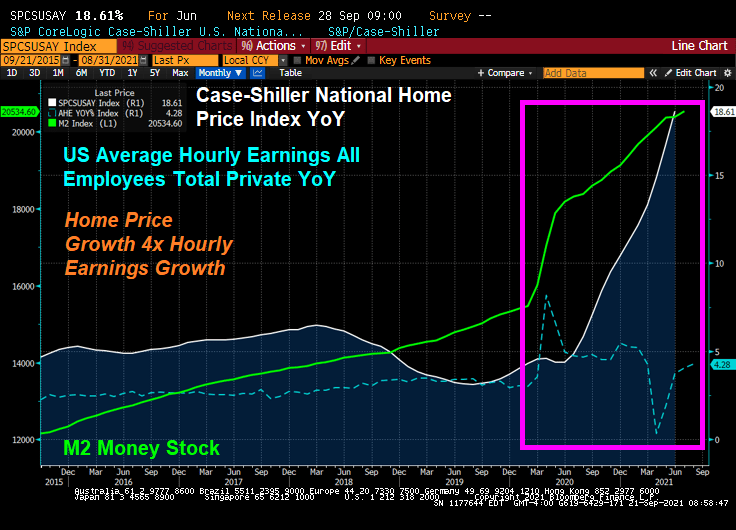
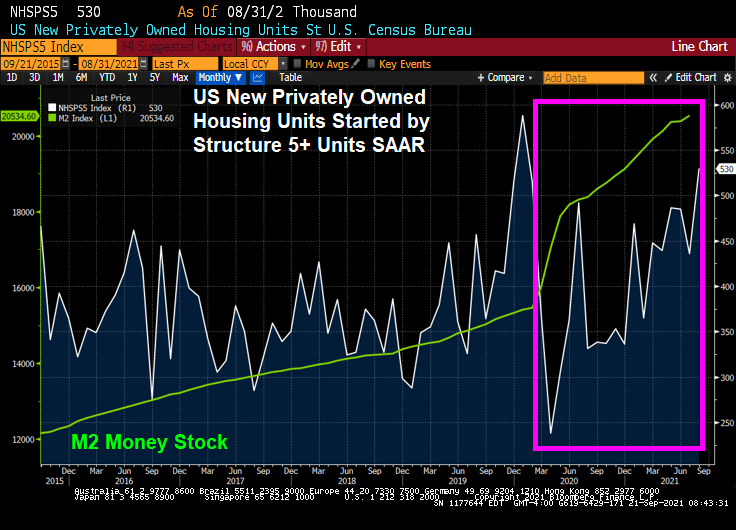
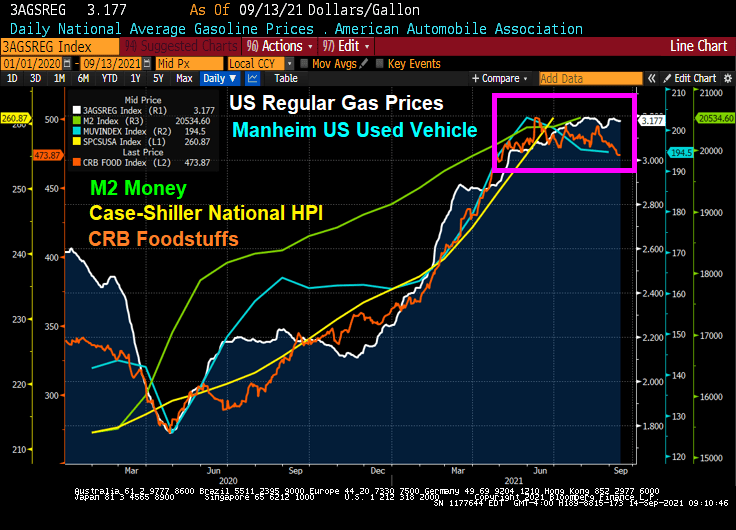
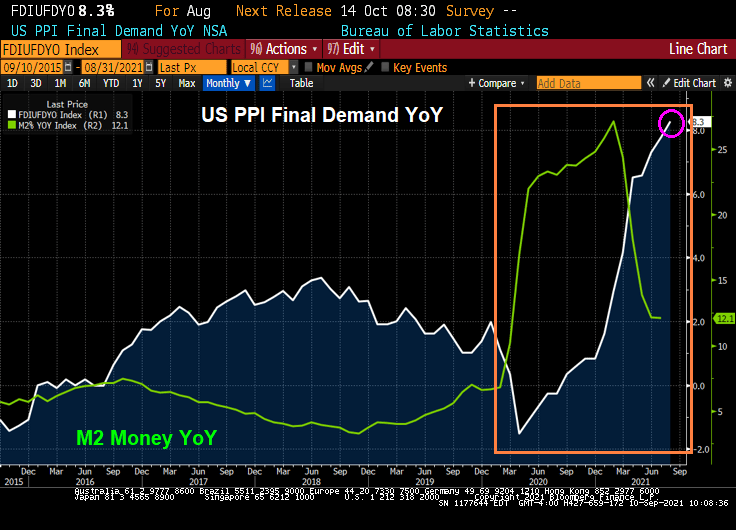
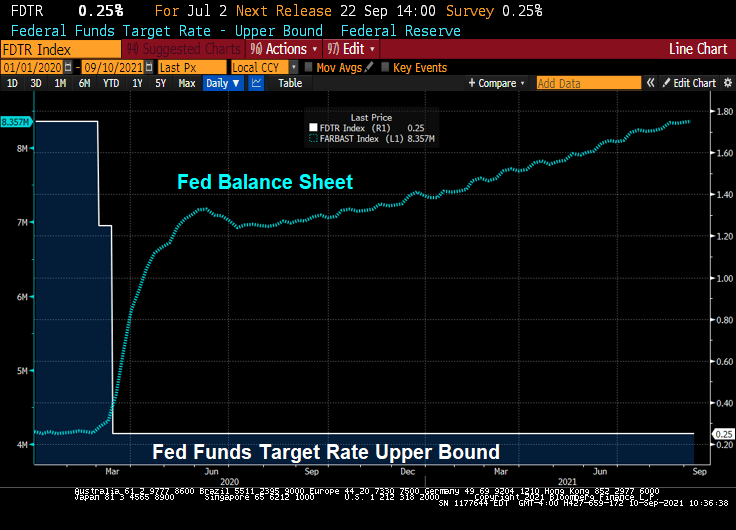
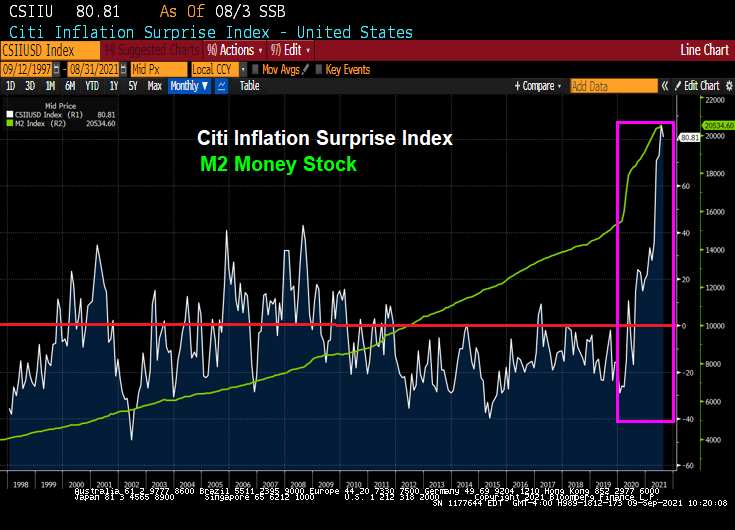
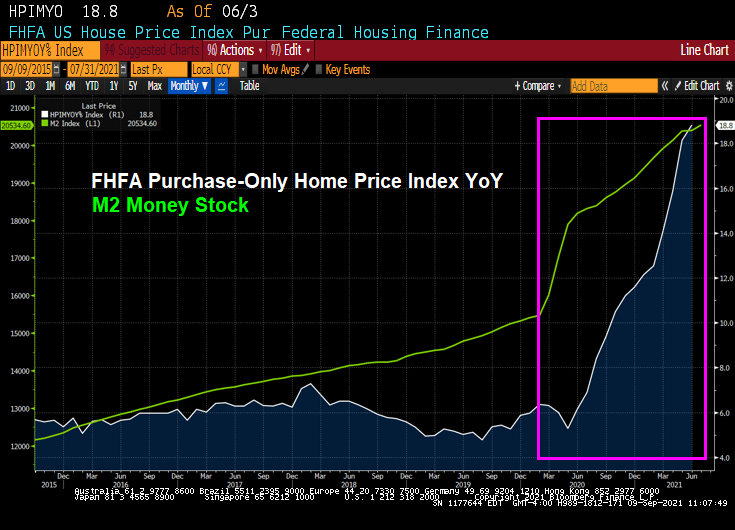
Since the housing bubble burst and surge in serious mortgage delinquencies, The Federal Reserve entered the economy with a vengeance. And have never left, and increased their drowning of markets with liquidity.

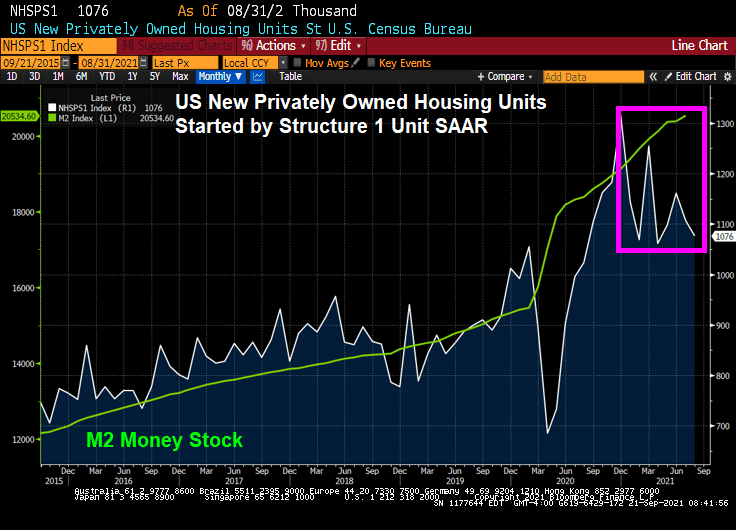
The Fed whip-sawing of interest rates in response to the 2001 recession was certainly a problem. They dropped The Fed Funds Target rate like a rock, then homebuilding went wild nationally and home prices soared thanks to Alt-A (NINJA) and ARM lending. But now The Fed is dominating markets like a gigantic T-Rex.

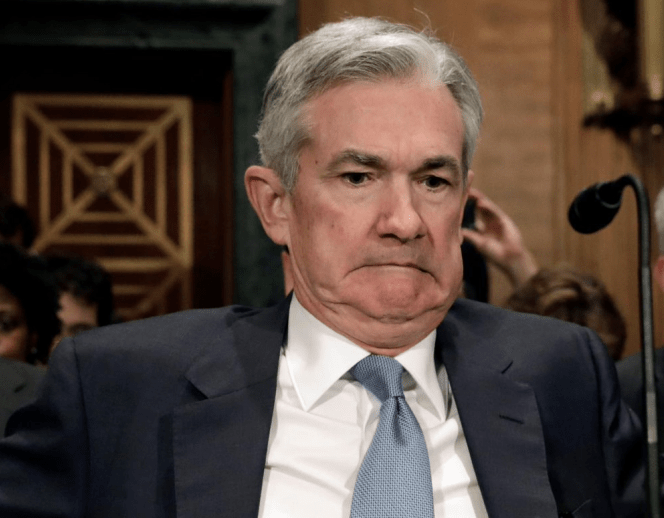
Oddly, then Fed Chair Ben Bernanke never saw the bubble coming. Or the burst.

Speaking of pizza, Donato’s from Columbus Ohio is my favorite. Founder’s Favorite is my favorite, but they do offer the dreaded Hawaiian pizza (ham, pineapple, almonds and … cinnamon?)

Bleech!

US Homeowner Equity Surged +29.3% YoY (California The Biggest Gainer) Thanks Mostly To Federal Reserve

Since Q2 2020, US homeowners have been big winners in terms of home price gains and equity in their homes. Unfortunately, this means that renters are big losers. Once again, The Federal Reserve is benefiting once segment of the population while punishing the other segment.

Homeowner Equity Q2 2021

CoreLogic analysis shows U.S. homeowners with mortgages (roughly 63% of all properties*) have seen their equity increase by a total of nearly $2.9 trillion since the second quarter of 2020, an increase of 29.3% year over year.

*Homeownership mortgage source: 2016 American Community Survey.

Figure 1 National Homeowner Equity YOY Change

National Homeowner Equity

In the second quarter of 2021, the average homeowner gained approximately $51,500 in equity during the past year.

California, Washington, and Idaho experienced the largest average equity gains at $116,300, $102,900 and $97,000 respectively. Meanwhile, North Dakota experienced the lowest average equity gain in the second quarter of 2021 at $10,600.

Figure 4 National Homeowner Equity Average Equity Gain

10 Select Metros Change

CoreLogic provides homeowner equity data at the metropolitan level, in this graphic 10 of the largest cities, by housing stock are depicted. 

Negative equity has seen a recent decrease across the country. San Francisco-Redwood City-South San Francisco, CA, is the least challenged, with Negative Equity Share of all mortgages at 0.6%.

Figure 5 National Homeowner Equity

Loan-to-Value Ratio (LTV)

The graph represents National Homeowner Equity Distribution across multiple LTV Segments.

Figure 6 National Homeowner Equity Loan-to-Value Ratio

Since growing home equity lead to lower default risk (or at least losses to the mortgage holder), we are seeing mortgage delinquencies fall after the Covid surge.

Of the top ten cities, Chicago leads in negative equity.

Maybe Fed Chair Jerome Powell is trying to soothe us, like Sam and Dave.

U.S. Housing Starts Rose by More Than Forecast in August (Home Price Growth >4x Hourly Earnings Growth) Will The Thrill Be Gone When Stimulus Is Remove?

The unorthodox monetary stimulus from The Federal Reserve and stimulypto-level spending by the Federal government has resulted in a surge in US housing starts. But that thrill may be gone if the stimulypto is removed.

(Bloomberg) -By Olivia Rockeman- U.S. housing starts rose by more than expected in August, suggesting that the supply and labor constraints that have been holding back construction eased in the month.

Residential starts rose 3.9% last month to a 1.62 million annualized rate after an upwardly revised July print, according to government data released Tuesday. The median estimate in a Bloomberg survey called for a 1.55 million pace. 

Building permits, meanwhile, increased 6% in August, the biggest gain since January, reflecting a sizable jump in multi-family units. Permit applications for single-family homes also edged higher.

The data suggest that builders are making some construction headway despite limited availability of land, labor and materials, which has slowed residential starts from a 15-year high in March. Despite the bottlenecks, housing starts remain mostly above pre-pandemic levels, which is expected keep construction activity elevated for some time.

1-unit (single family detached) starts got a tremendous jolt from The Fed’s monetary stimulus and Federal governments fiscal stimulus. But government stimulus wears out.

Given the high cost of housing in the USA, particularly in coastal metro areas, we see home price growth raging at over 4 times hourly earnings growth.

As a result, we are seeing a burst of 5+ unit (multifamily) housing starts. Note the burst of 5+ housing starts prior to Covid striking in early 2020.

Permits for 1-unit housing are up only slightly but 5+ unit permits are up 19.7%.

Remember, the withdrawal of fiscal stimulus will lead to a big fiscal cliff.

Is the thrill gone from owning a single-family detached home?

Urkel Economy! US Consumer Confidence Lowest In Decades Thanks To Rising Prices (Home Buying Conditions Fall To 60)

This is the Steve Urkel economy where The Federal Reserve and Federal government screw everything up with their policies (or follicies) and say “Whoops! Did I do that?”

(Bloomberg) — U.S. consumer sentiment rose slightly in early September but remained close to a near-decade low, while buying conditions deteriorated to their worst since 1980 because of high prices.

The University of Michigan’s preliminary sentiment index edged up to 71 from 70.3 in August, data released Friday showed. The figure trailed the median estimate of 72 in a Bloomberg survey of economists.

Buying conditions for household durables, homes and motor vehicles all fell to the lowest in decades. The report said the declines were due to complaints about high prices. Consumers expect inflation to rise 4.7% over the coming year, matching the highest since 2008.

September’s UMich Buying Conditions for Houses fell to 60 … thanks to superheated house prices.

I can just picture Fed Chair Jerome Powell channeling Steve Urkel and saying “Whoops!! Did I do that?”

US Workers Made Only 8 Cents More Per Hour, Inflation-Adjusted, Than In January 1973 (While Real Home Prices Soar)

The US Bureau of Labor Statistics released their Real Earnings Report for August yesterday. And is it pretty depressing for US workers.

  • Real average hourly earnings for all employees increased 0.4 percent from July to August, seasonally adjusted. This result stems from an increase of 0.6 percent in average hourly earnings combined with an increase of 0.3 percent in the Consumer Price Index for All Urban Consumers (CPI-U). 
  • Real average weekly earnings increased 0.3 percent over the month due to the change in real average hourly earnings combined with no change in the average workweek.  

If we look at REAL US housing prices versus REAL average hourly earnings for production and nonsupervisory employees, we can see waves of imbalance between the two measures (also known as “bubbles”). Such as today.

But the real horror chart is the following (courtesy of Mish). It shows that real hourly earnings have barely changed since January 1973.

Of course, labor outsourcing to lower labor cost countries is the chief culprit. Karsten Manufacturing, maker of Ping golf clubs, no longer makes their castings in Phoenix AZ thanks, in part, to EPA regulations. Ping clubheads are now made in Asia.

August US Inflation At 5.3% YoY, Real Avg Hourly Earnings At -0.9% (Gasoline Up 42.7% YoY, Used Cars And Trucks Up 31.9% YoY, Home Prices Up 18.6% YoY)

US inflation remained about the same in August as it was in July. CPI YoY fell ever so slightly from 5.4% in July to 5.3% in August. Real hourly earnings remain negative.

The source of consumer inflation? Gasoline prices rose 42.7% YoY while used cars and trucks rose 31.9% YoY.

Shelter rose 2.8% YoY. That is odd since the Case-Shiller national price index is growing at a torrid 18.61% YoY pace and the Zillow Rent Index YoY has recovered to a sizzling 9.24% YoY pace.

The YoY heatmap of inflation.

However, with the exception of home prices and rent, we are seeing a slowing of used car, foodstuffs and regular gas prices over the summer.

Yikes! Time to trim The Fed’s asset purchases!!

NY Fed Survey Of Consumer Expectations Points To 5.2% Inflation In One Year (Too Bad Hourly Wages Are Growing At 4.3%!)

US inflation is run, runaway.

Americans are expecting a record surge in inflation over the next few years, according to a new report from the Federal Reserve Bank of New York.

In its August Survey of Consumer Expectations, the bank said Monday that respondents see inflation a year from now at 5.2%, up from 4.9% the prior month. Three years from now, it is expected to be at 4%, up from 3.7% in July. Both readings mark record-high readings for data that goes back to 2013.

It is a shame that in that last reading that the CPI YoY exceeded Average Hourly Earnings YoY by a 5.4% to 4.3% margin.

Yes, inflation is hot, hot, hot and consumers are feeling it.

U.S. Producer Prices Increased in August by More Than Forecast (Hot, Hot, Hot!) Fed Pouring Money Into Clogged System

Producer prices are getting hot, hot, hot!

(Bloomberg) — Prices paid to U.S. producers increased in August by more than forecast as persistent supply chain disruptions squeeze production costs higher. 

The producer price index for final demand increased 0.7% from the prior month and 8.3% from a year ago, a fresh series high, Labor Department data showed Friday. Excluding the volatile food and energy components, the so-called core PPI advanced 0.6%, and was up 6.7% from August of last year.

PPI Final Demand prices rose 8.3% YoY in August.

Given that there are shortages in the economy, why is The Federal Reserve pumping so much money into the system? It is like repeatedly flushing a clogged toilet hoping it will clear.

The correct way to clear a clogged economic toilet.

Not The Fed way of clearing clogged toilets. Pumping trillions of dollars into a clogged economic system.

The Fed’s comment on their plumbing prowess? “Come on feel the noiz!”

Because inflation is run, runaway.

Citi Inflation Surprise Index Remains Elevated With M2 Money Surge (Did The Fed Overreact??)

Covid struck in early 2020 and The Fed spiked the punchbowl with a massive surge in M2 Money. Like a storm surge.

Today’s unemployment report showed initial jobless claims and continuing jobless claims ALMOST at pre-Covid levels.

So it appears that The Fed’s job is done (under the assumption that The Fed had anything to do with the recovery).

So did The Fed almost violently overreact to the Covid crisis? The Atlanta Fed’s Raphael Bostic says it is too early to withdraw while St Louis Fed’s James “Bully” Bullard says it is time to taper.

Really Raph? 18.8% price growth is not enough for you?

Homebuying Startup Orchard Reaches $1 Billion Unicorn Valuation (But What Is House Price Growth Slows … Or Falls??)

Let’s get ready to tumble! New homebuying startup emerges as US house prices begin slowing.

(Bloomberg) — Orchard, which offers cash to homebuyers upfront so they can purchase a new residence before selling their old one, raised $100 million to fuel growth in an ultra-competitive housing market that’s pushing shoppers to find new ways to stand out.

The fundraising round values the startup at more than $1 billion, making it the latest unicorn company to tackle the challenge of simplifying the process of buying or selling a home. Boston-based Accomplice led the round, with existing investors FirstMark, Revolution, First American and Juxtapose also participating.

“We can say we’re a unicorn, which feels good for about five seconds, and then it’s back to the real world of building a business,” Chief Executive Officer Court Cunningham said in an interview. “We’re trying to create a modern way to buy and sell homes, and that’s capital intensive.”

Cunningham, previously CEO of online marketing company Yodle, started Orchard in 2017 to take on what he viewed as a ripe opportunity: Consumers were frustrated with the traditional way of buying and selling homes, and the $1.7 trillion U.S. housing market was big enough to make tackling the problem worthwhile.

Orchard focuses on people who are trying to buy their next home while selling an existing one, a nerve-wracking process that can cause a transaction to collapse or result in households carrying two mortgages.
In addition to offering cash to help clients buy their next home, the New York-based company provides funds to make light repairs before listing the existing home on the market. Orchard seeks to profit by operating as a brokerage and earning commissions.

There have always been services that purchase homes from you. Typically, there firms simply pay off your mortgage, so if you have a higher mortgage balance relative to you home value, you may not like what you are offered. But Orchard is not that model.

If you “List with Orchard,” and your home doesn’t end up selling on the open market, Orchard will buy your home. Sellers in some markets also have the option to sell immediately to the company. Orchard wants you to list for 30 days before selling to them for their backup cash offer price. If you sell directly to Orchard, you’ll also pay an additional 1% convenience fee on top of the 6% you’re already paying commission.

When home prices have been rising at a 17-18% YoY pace, this seems like a good model. But what if The Federal Reserve removes it massive monetary stimulus and/or The Federal Government slows down it fiscal stimulus? Then Orchard, if they purchase your home, will likely lose considerable amounts. Being aware of this possibility, Orchard is likely to buy homes at a considerable discount.

But there is still worries about inflation. Here is the Citi Inflation Surprise index.

Orchard has a northern Virginia site.

Publicly traded companies known as iBuyers are pioneering a high-tech approach to home-flipping intended to make selling properties easier. Those firms include Opendoor Technologies Inc., Redfin Corp., and Offerpad Solutions Inc. A fourth, Zillow Group Inc., recently raised $450 million by issuing bonds, backed by the homes it buys and sells.

Whoomp, there it is.