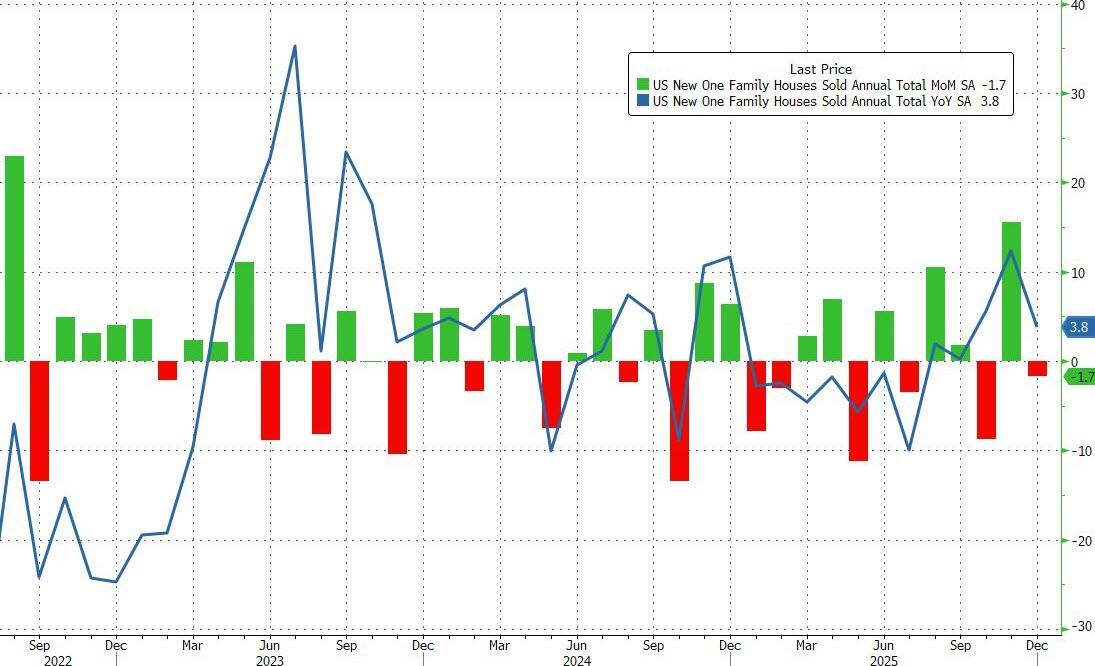
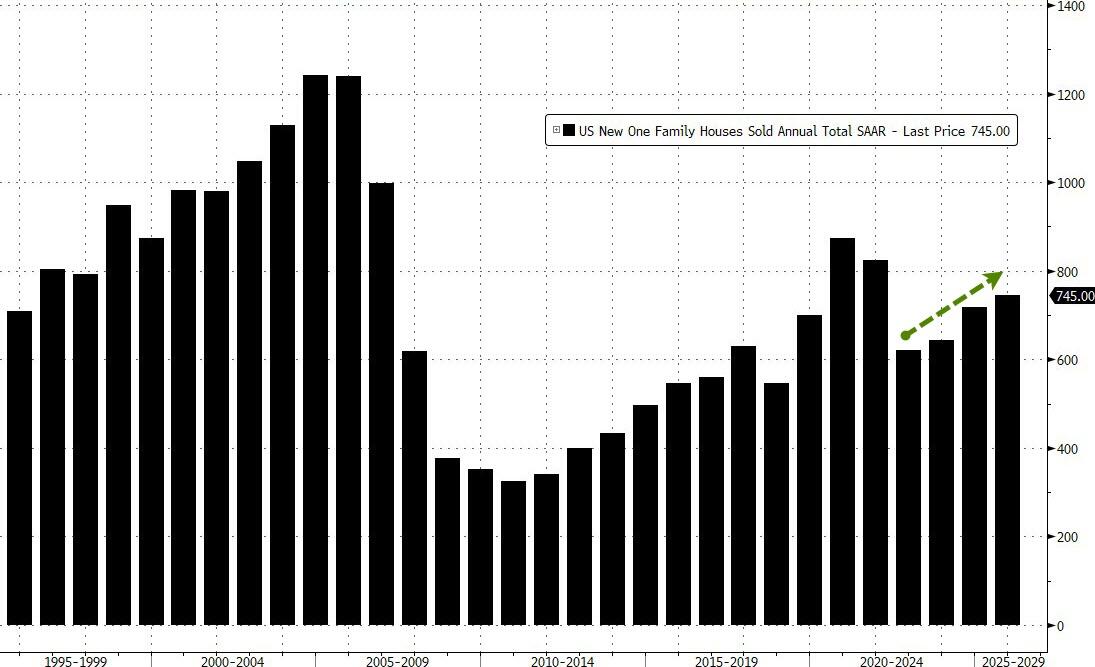
…but ended the year at 745k – the highest SAAR since 2021…
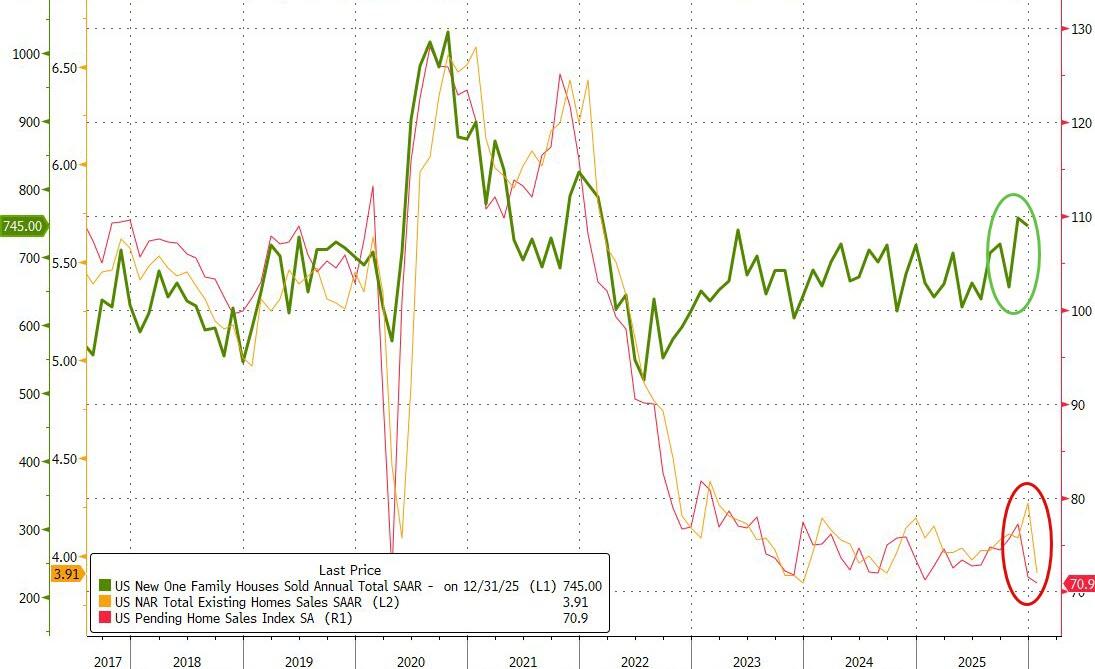
“New” home sales have notably decoupled from “used” home sales in the last few years as homebuilders incentivize buyers (reducing margins) and lower prices (reducing revenues)…
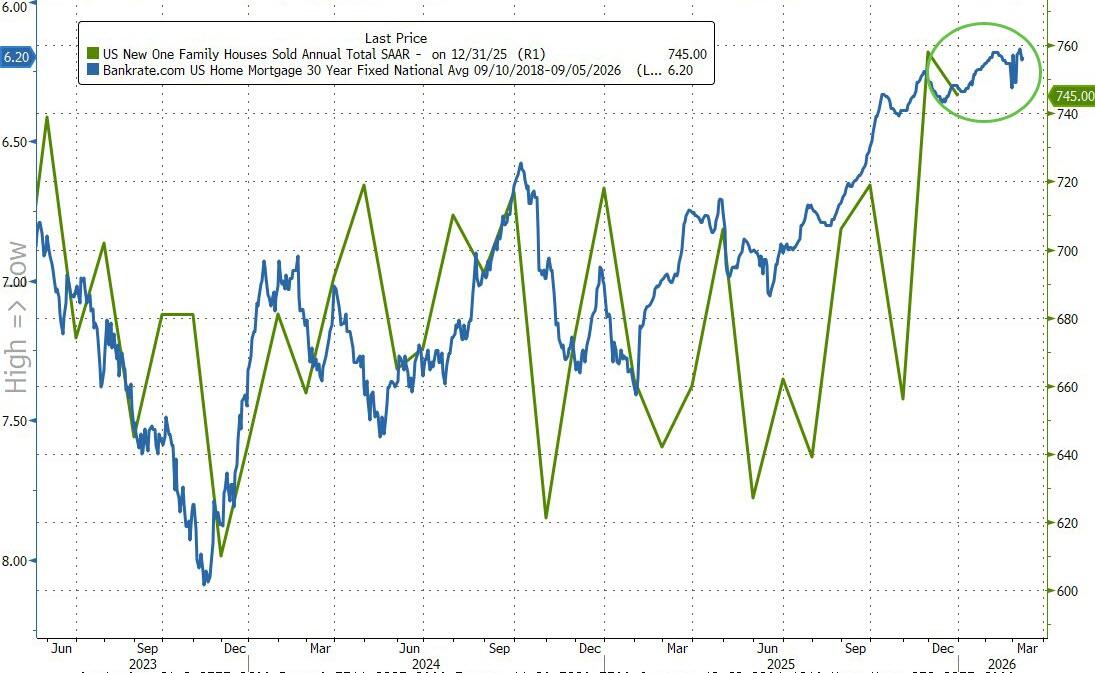
Lower mortgage rates support modest further improvements in sales…
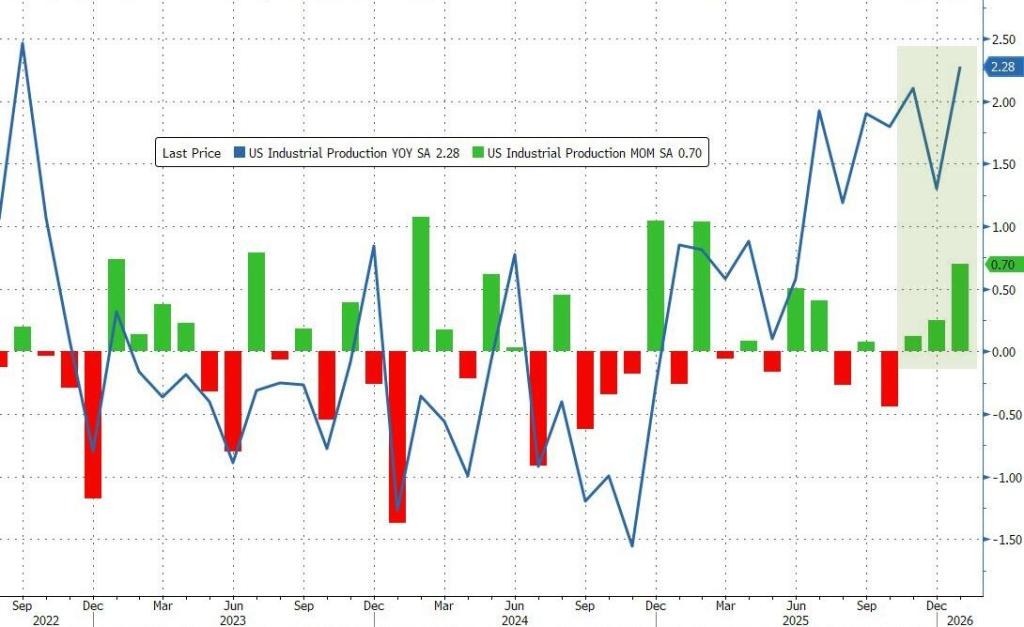
So much for the leftist fearmongers claiming that Trump Tariffs will kill US manufacturing, In January, US industrial production rose 0.7% MoM. And 2.28% YoY.
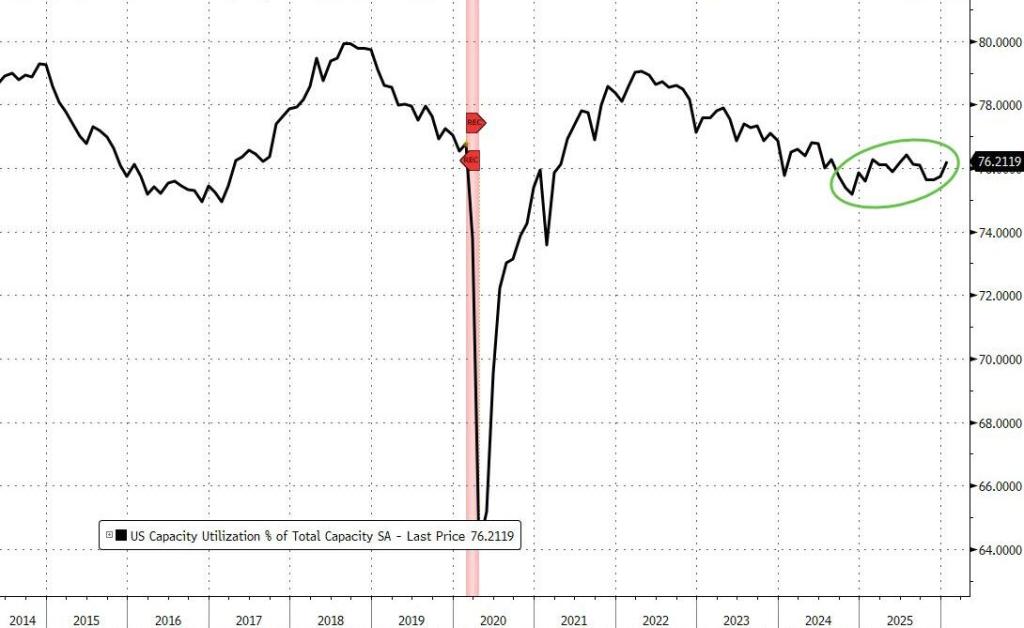
Capacity utililzation rose in January to 76.22%.
Pass the Save Act and don’t listen to leftist propaganda that women won’t be allowed to vote. Then get a passport and show that.
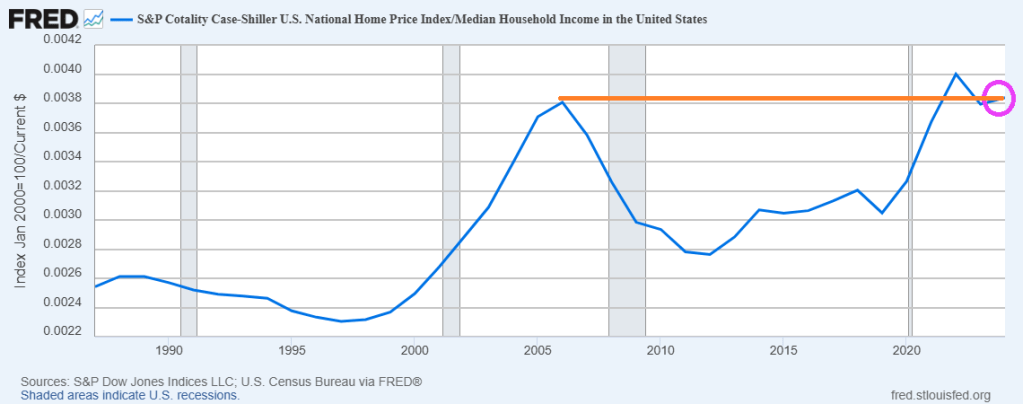
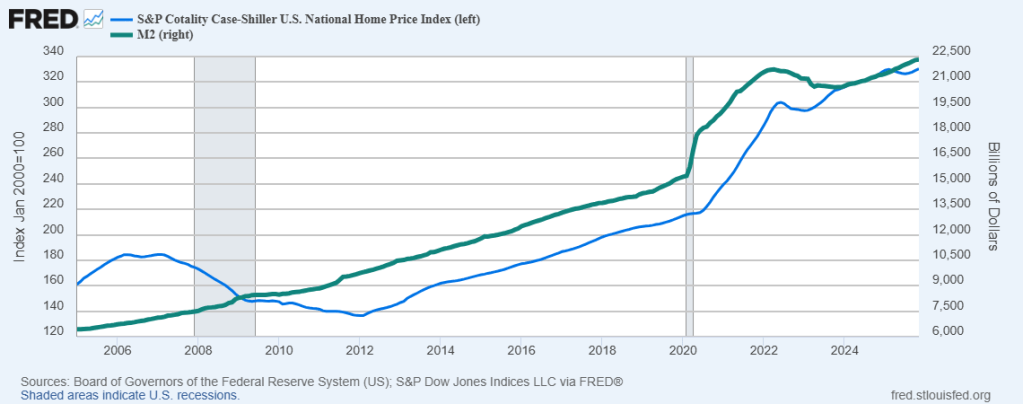
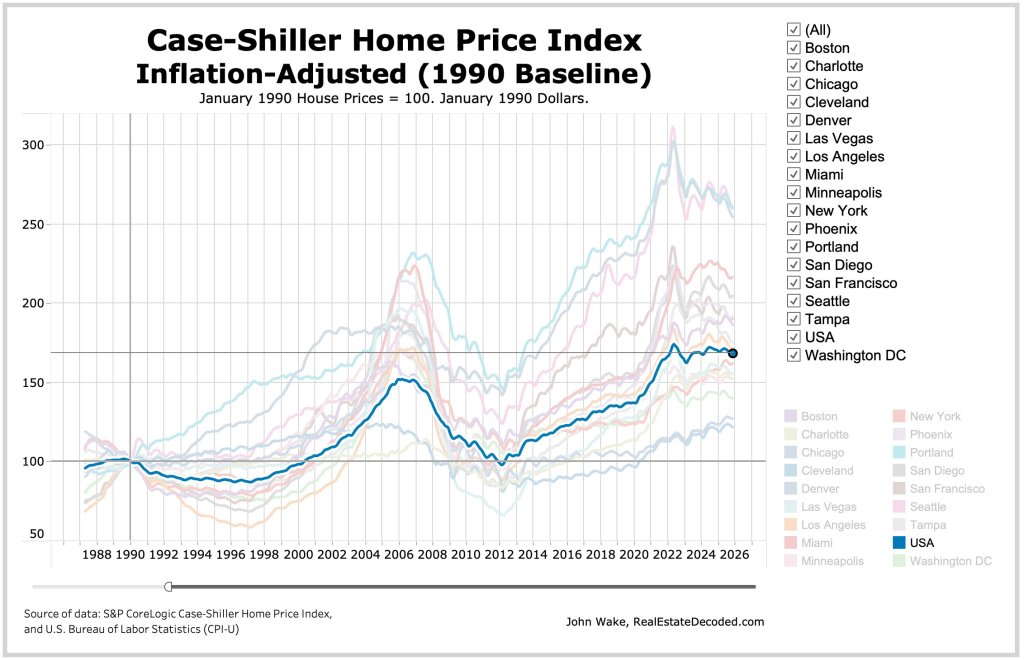
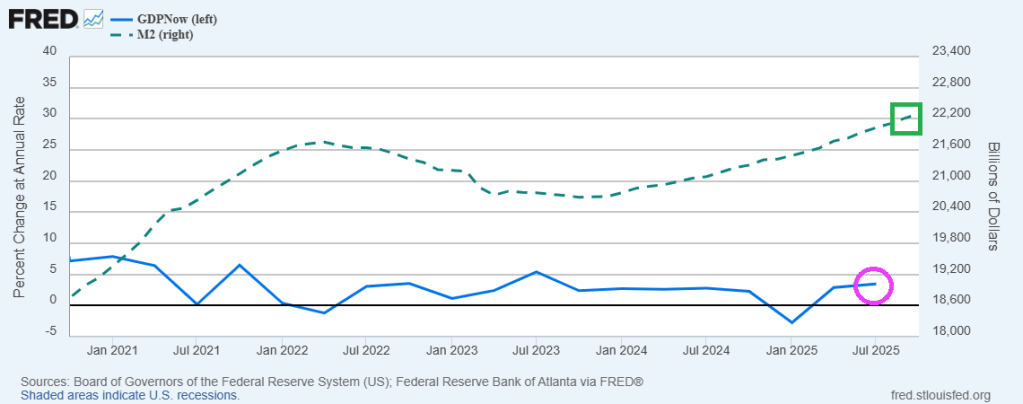
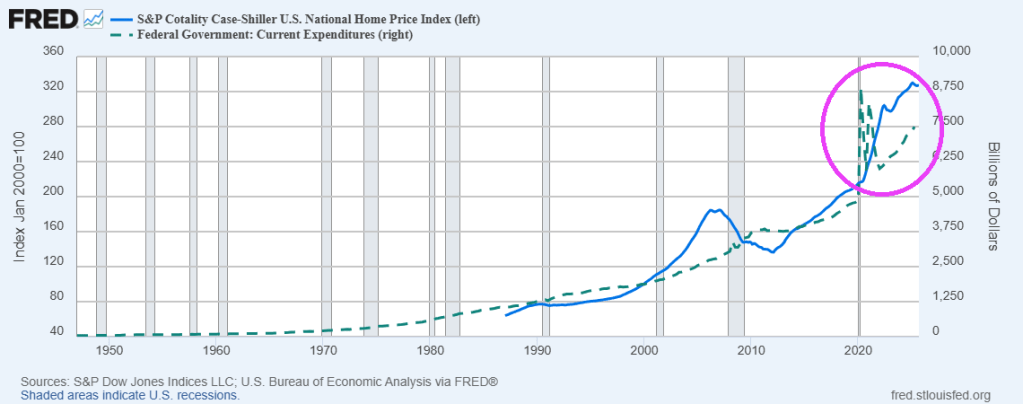
Keep on printing money. It seems that home price growth requires The Fed to keep printing money.
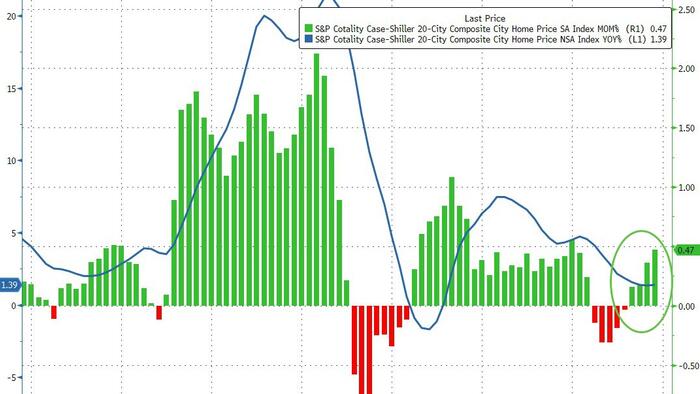
S&P/Case-Shiller released the monthly Home Price Indices for November (“November” is a 3-month average of September, October and November closing prices). September closing prices include some contracts signed in July, so there is a significant lag to this data. Here is a graph of the month-over-month (MoM) change in the Case-Shiller National Index Seasonally Adjusted (SA).
The S&P Cotality Case-Shiller U.S. National Home Price NSA Index posted a 1.4% annual gain for November, in line with the previous month.
Real home values declined as consumer inflation (2.7%) outpaced the National Index gain (1.4%) by 1.3 percentage points.
Regional divergence persisted: Midwestern and Northeastern markets led by Chicago (+5.7%) and New York (+5.0%) posted gains, while Sun Belt cities including Tampa (–3.9%), Phoenix (–1.4%), Dallas (–1.4%), and Miami (–1.0%) saw declines. … “Regional patterns continue to illustrate a stark divergence. Chicago leads all cities for a second consecutive month with a 5.7% year-over-year price increase, followed by New York at 5.0% and Cleveland at 3.4%. These historically steady Midwestern and Northeastern markets have maintained respectable gains even as overall conditions cool. By contrast, Tampa home prices are 3.9% lower than a year ago – the steepest decline among the 20 cities, extending that market’s 13-month streak of annual drops. Other Sun Belt boomtowns remain under pressure as well: Phoenix (-1.4%), Dallas (-1.4%), and Miami (-1.0%) each continue to see year-over-year declines, a dramatic turnaround from their pandemic-era strength.
“Monthly price changes were mixed but leaned negative in November, underscoring persistent softness. On a non-seasonally adjusted basis, 15 of the 20 major metro areas saw prices decline from October (versus 16 declines in the previous month). Only a handful of markets – including Los Angeles, San Diego, Miami, New York, and Phoenix – eked out slight gains before seasonal adjustment. After accounting for typical seasonal slowing, the National Index inched up just 0.4% for the month, indicating that price momentum remains muted. … The S&P Cotality Case-Shiller U.S. National Home Price NSA Index, covering all nine U.S. census divisions, reported a 1.4% annual gain for November. The 10-City Composite showed an annual increase of 2.0%, up from a 1.9% increase in the previous month. The 20-City Composite posted a year-over-year increase of 1.4%, up from a 1.3% increase in the previous month. … The pre-seasonally adjusted U.S. National Index saw a drop of 0.1% and the 20-City Composite Index fell 0.03%, while the 10-City Composite Index increased 0.1%.
After seasonal adjustment, the U.S. National Index reported a monthly increase of 0.4%, and both the 10-City Composite and 20-City Composite Indices posted month-over-month gains of 0.5%.
The littany of horror stories about government attempts to make housing more “affordabl;e” at enmdless.
New York mayor Zoran Mandami appointed Cea Weaver as New York City’s housing Tsar allegedly to make housing more affordable. Her proposal? People should pay 30% of their income for housing. if you have no income, you pay zero. Then she decreed that you must offer your multifamilty property to the city first before you sell it in the open market. Allegedly for the “greater good.” Which means a small number of elites will make a fortune (Mandami donors?).
But harken back to the Clinton Administration where they issue a proclamation to make housing more affordable, the national homeownership strategy. This strategy helped usher in an era of lowering credit standards and higher LTV lending. Leading to the mortgage crisis of 2008. Thanks a lot Bill and Hill!
And then we have The Federal Reserve, the master manipulators of interest rates. While mortgage rates have fallen recently to around 6%, they are up 134% from Biden’s Maladministration. So while The Fed contributed to the housing bubble that blew up and nearly destroyed the banking industry.
Government and especially Cea Weaver. A child of privelege.
Nobody wastes money like government, particularly around events like Covid where Federal spending led to housing prices spiking after Covid outbreak in 2020. This made housing unaffordable for most households. This in turn helped kill the mortgage market.
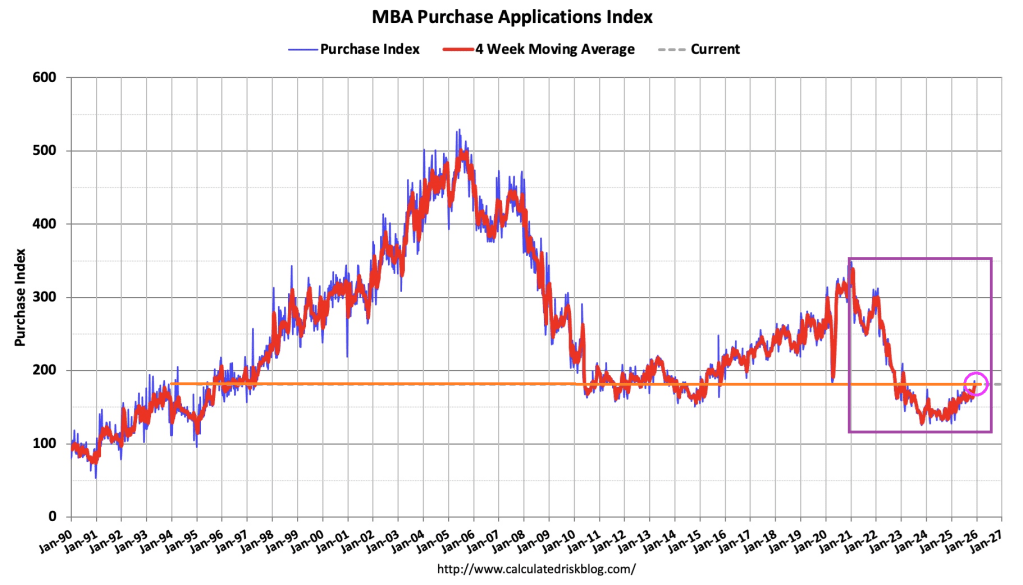
The Market Composite Index, a measure of mortgage loan application volume, decreased 3.8 percent on a seasonally adjusted basis from one week earlier. On an unadjusted basis, the Index decreased 5 percent compared with the previous week. The seasonally adjusted Purchase Index decreased 3 percent from one week earlier. The unadjusted Purchase Index decreased 7 percent compared with the previous week and was 13 percent higher than the same week one year ago.
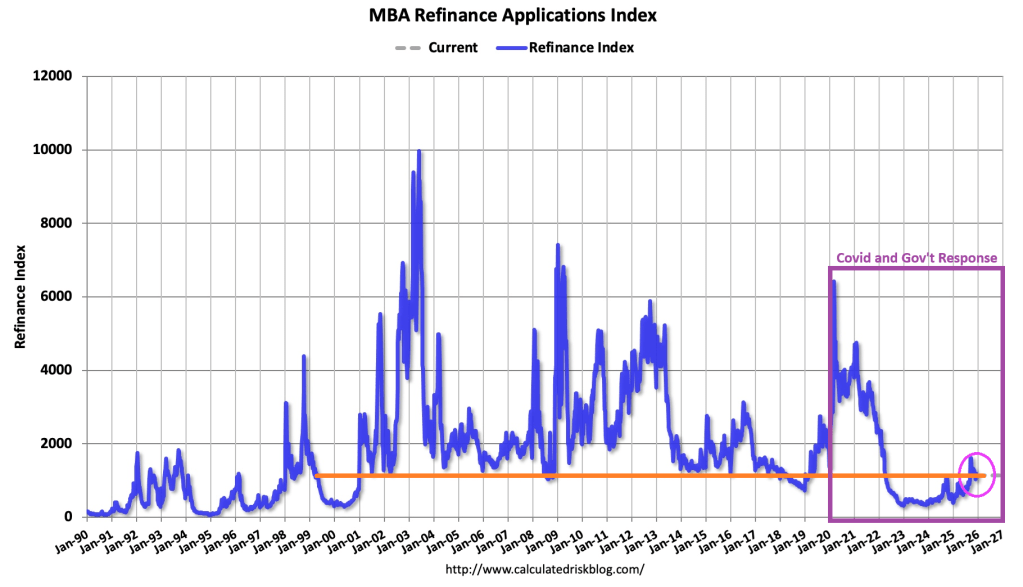
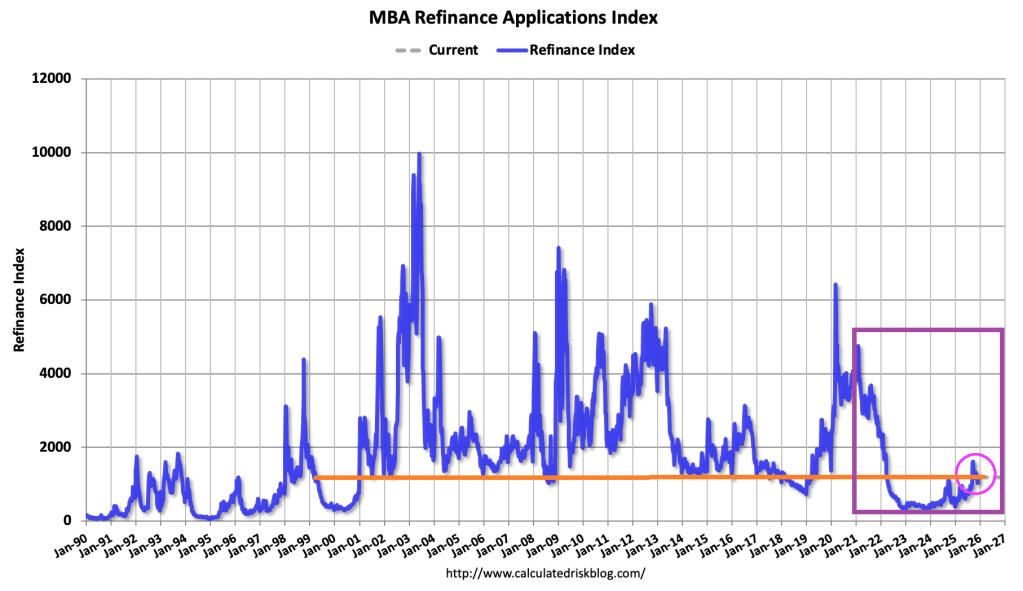
The Refinance Index decreased 4 percent from the previous week and was 86 percent higher than the same week one year ago.
Once again, the government response to the Wuhan Covid virus of 2020 helped drive up housing prices killing off mortgage demand.
Hallelujah, I love this economy so! Of course, former First Lady Jill Biden is on the national tour trashing the economy saying it was “perfect” under Joe Biden.
The Market Composite Index, a measure of mortgage loan application volume, increased 4.8 percent on a seasonally adjusted basis from one week earlier. On an unadjusted basis, the Index increased 49 percent compared with the previous week. The seasonally adjusted Purchase Index decreased 2 percent from one week earlier. The unadjusted Purchase Index increased 32 percent compared with the previous week and was 19 percent higher than the same week one year ago.
The Refinance Index increased 14 percent from the previous week and was 88 percent higher than the same week one year ago.
Compared to the prior week’s data, which included an adjustment for the Thanksgiving holiday, mortgage application activity increased last week, driven by an uptick in refinance applications,” said Joel Kan, MBA’s Vice President and Deputy Chief Economist. “Conventional refinance applications were up almost 8 percent and government refinances were up 24 percent as the FHA rate dipped to its lowest level since September 2024. Conventional purchase applications were down for the week, but there was a 5 percent increase in FHA purchase applications as prospective homebuyers continue to seek lower downpayment loans. Overall purchase applications continued to run ahead of 2024’s pace as broader housing inventory and affordability conditions improve gradually.
The average contract interest rate for 30-year fixed-rate mortgages with conforming loan balances ($806,500 or less) increased to 6.33 percent from 6.32 percent, with points increasing to 0.60 from 0.58 (including the origination fee) for 80 percent loan-to-value ratio (LTV) loans.


You must be logged in to post a comment.