The Federal government is still shut down, so we have to rely on ADP for jobs numbers.
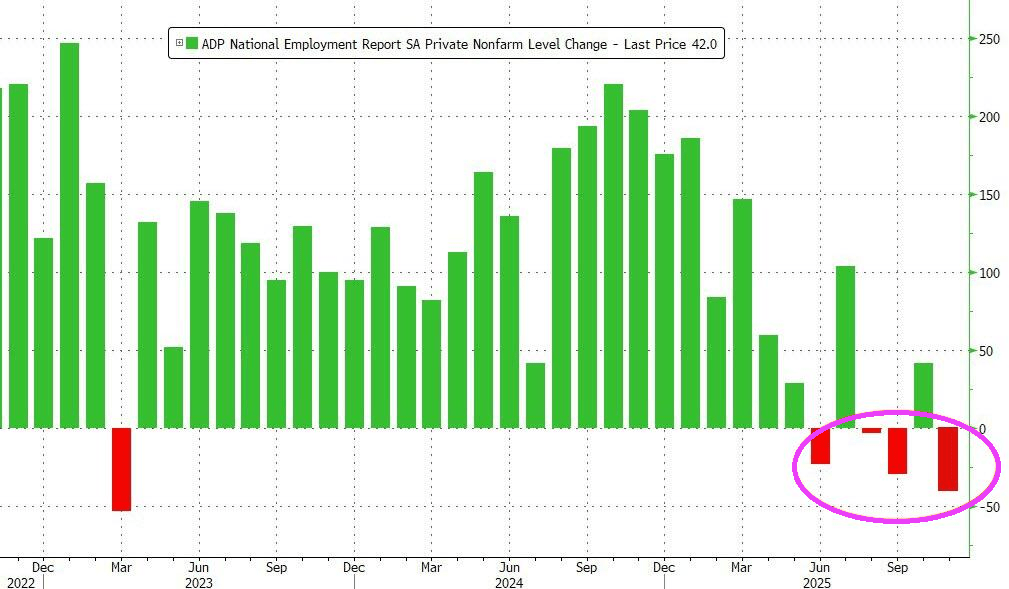
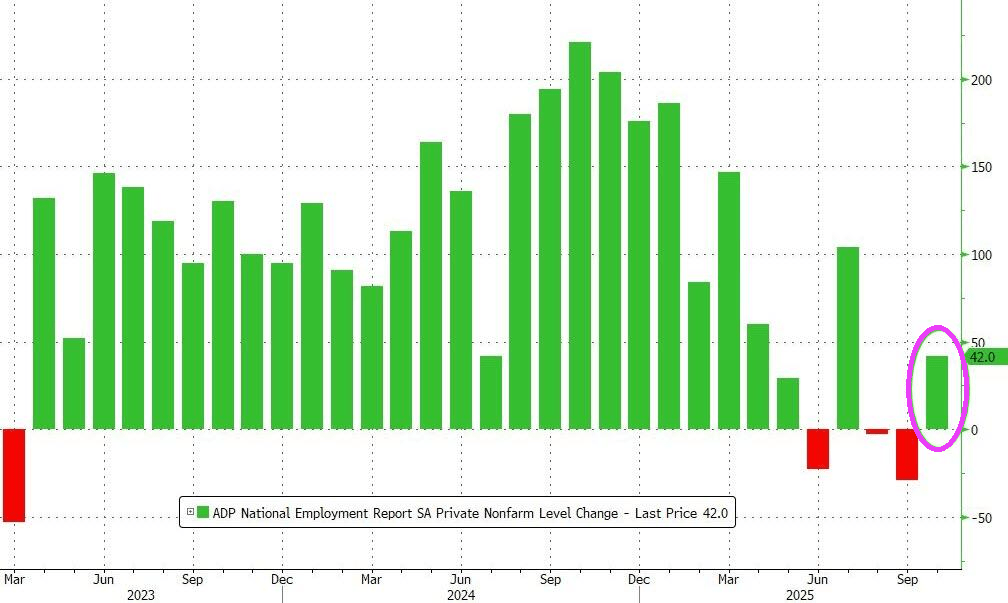
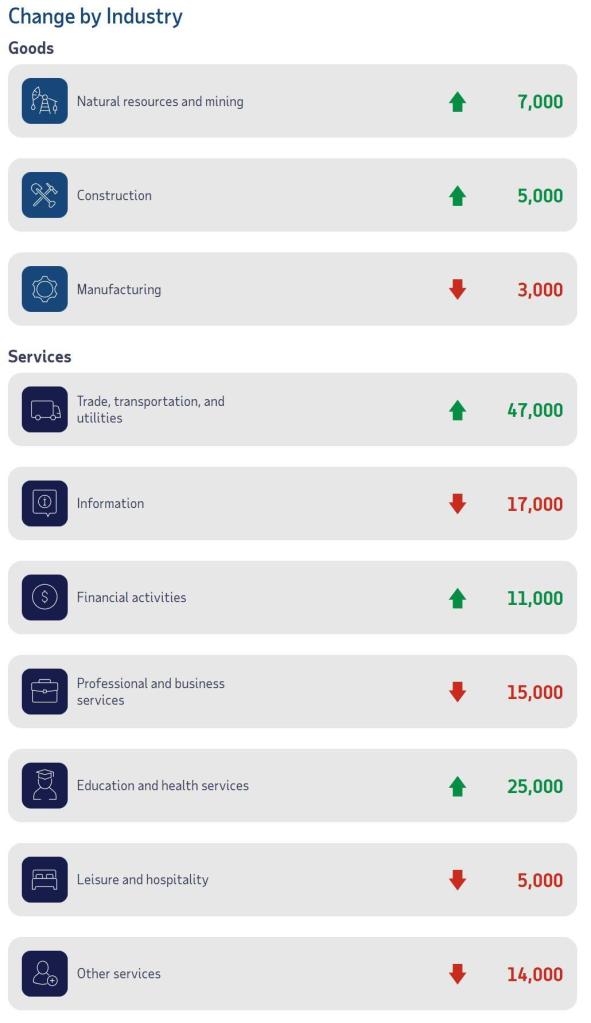
The ADP weekly jobless report pointed to a deterioration in US labor momentum, stating that “for the four weeks ending Oct. 25, 2025, private employers shed an average of 11,250 jobs a week, suggesting that the labor market struggled to produce jobs consistently during the second half of the month.”
Added together that is 45,000 job losses in the month (not including government workers), which would be the largest monthly drop in jobs since March 2023.
A sustained increase in layoffs would be particularly concerning now because the hiring rate is low and it is harder than usual for unemployed workers to find jobs.
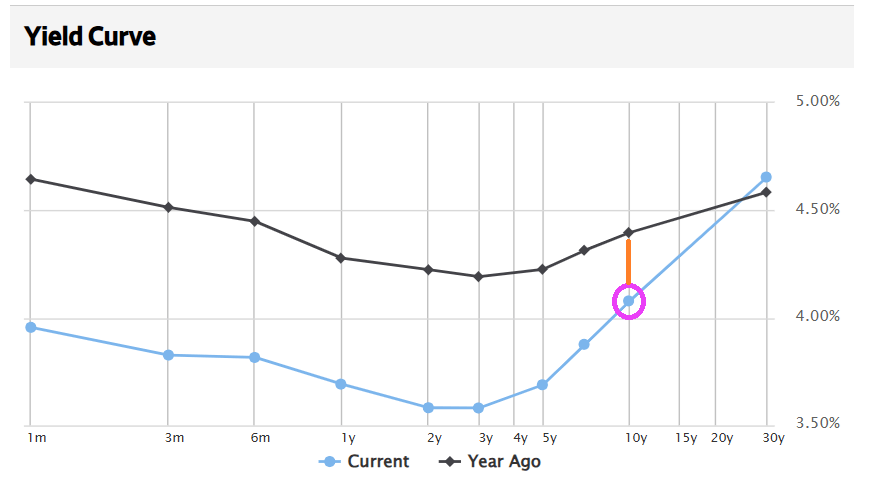
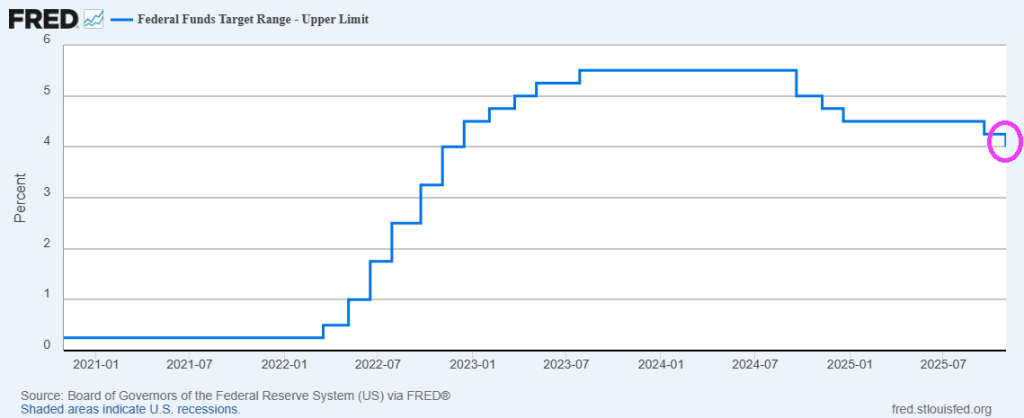
It is likely that The Fed will cut rates to compensate. Rate cuts around the corner!


You must be logged in to post a comment.