Consumer Sentiment For Home Buying Crashes To Lowest Level Since 1982 As Bear Sentiment Takes Hold In Stock Market

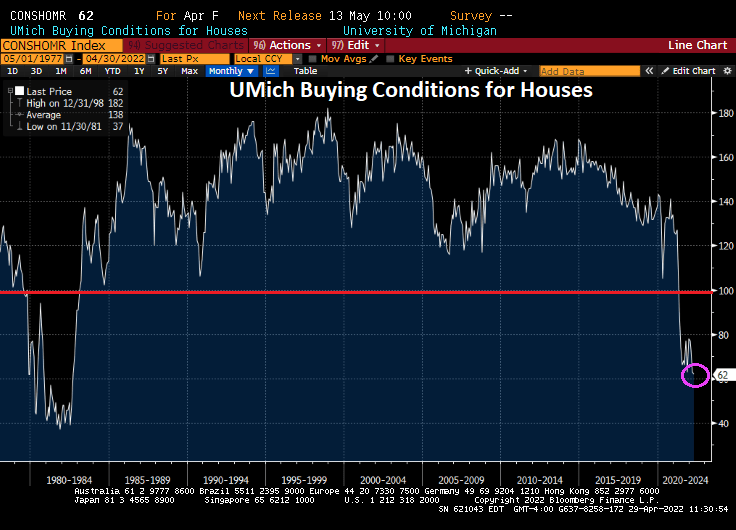
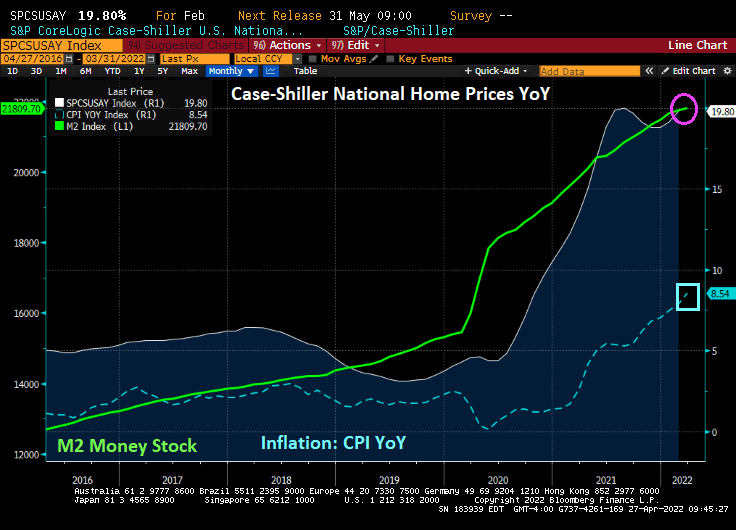
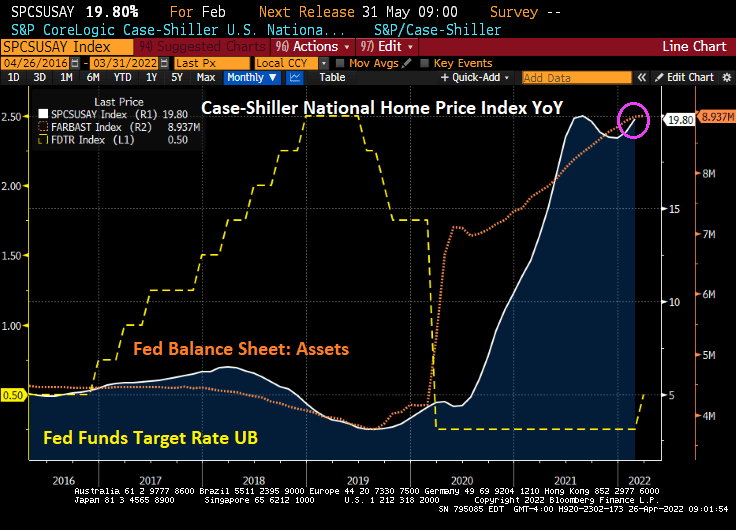
Rising home prices and The Fed signaling an end to the perpetual punch bowl have resulted in the University of Michigan buying conditions for houses to hit the lowest level since 1982.

While bearish sentiment in markets highest since 2009 in the stock market.

I don’t get why Biden created a “Disinformation Control Board” led by Nina Jankowicz – a disinformation spewer. We already have disinformation media outlets like CNN, MSNBC, ABC, CBS, NBC, New York Times, Washington Post, etc., so why create a Federal control board? All in time for the midyear elections!!

If this move by Biden doesn’t terrify you, then you didn’t study history.

Q1 US Employment Costs Skyrocket Most In History Helping To Increase Already Soaring Inflation (PCE YoY Rises To 40-year High of 6.60% YoY)

Not only has The Federal Reserve driven M2 Money Velocity to near historic lows, but now we find out that the Employment Cost Index just rose to a historic high.

Of course, a variety of minimum wage laws have helped drive up employments costs. Don’t tell lawmakers that minimum wage laws lead to higher inflation since they typically deny responsibility for anything. But I can almost picture the 4 Horsemen of the Inflation Apocalypse (Powell, Biden, Pelosi, Schumer) sitting around asking “What we can do to make inflation worse?”

We did see the PCE Deflator YoY rise to 6.6%, the highest since 1982, the highest in 40 years.

Personal spending increased to 1.1% in March, probably panicking buying over further inflation.

A PCE Deflator of 6.60% leads to a Taylor Rule estimate of 9.05% for The Fed Funds Target Rate.

The Federal government and Federal Reserve trying to solve inflation reminds me of Parks and Recreation’s Jerry Gergich trying to celebrate his retirement.

Terminal (Money) Velocity? M2 Money Velocity Crashes To Near All-time Low As Fed Continues To Print Money At 9% YoY Clip (Mortgage Rates Keep Rising)

M2 Money Velocity (GDP/M2 Money) peaked in Q3 1997, but after several bouts of Fed money printing, M2 Money Velocity is near the all-time low at 1.1216 In Q1 2022. And M2 Money stock is still growing at a torrid pace of 9.9% YoY. But the massive overreaction of The Federal Reserve in response to the Covid outbreak has led to near zero money velocity.

Now with The Federal Reserve considering removing the monetary stimulus, what will happen to US GDP left to survive on its own?

An example of how The Fed’s expected tightening of monetary policy can be seen in the meteoric rise in mortgage rates.

So, the US has hit terminal money velocity. I wish The Fed lots of luck going forward.

Is Charlie Sheen the Chairman of The Federal Reserve Board of Governors?? That must be Lael Brainard falling out of the sky with Charlie Sheen (aka, Jerome Powell).

Bidenflation Roars To 25% YoY In March As Real GDP Growth Goes Negative (Clueless Joe)

While headline inflation is growing at 8.6% YoY in March, flexible price inflation grew at a terrifying 25% YoY rate.

Even with headline inflation of “only” 8.56% YoY, today’s Q1 real GDP growth checked in at -1.4% QoQ. Clearly, Bidenflation isn’t help the economy or anyone else.

Diesel prices have skyrocketed under Biden.

Instead of Shoeless Joe, we have Clueless Joe as President.

Spot The Loser! Japan’s Yen, China’s Yuan or Russia’s Ruble (Russian Ruble Bounced Back While Yen And Yuan Have Crashed)

I hope America’s foreign policy wizards (Biden, Harris and Blinken) weren’t relying on the Russian Ruble staying pulverized, because the Ruble (relative to King Dollar) has regained all its losses.

On the other hand, the Japanese Yen and Chinese Yuan have crashed harder than Biden’s popularity.

Actually, The Atlanta Fed’s flexible price inflation rate is 25%, up from 3.90% Pre-Joe.

Perhaps Biden, Harris and Blinken think Putin is a pasta sauce.

US Real GDP Q1 Goes Negative -1.4% QoQ As Price Growth Hits 8% (It’s Official! The Biden Economy Stinks!)

It’s official! The Biden economy stinks!

US real GDP growth for Q1 slipped into negative territory (-1.4% QoQ) while GDP price growth rose to 8%. So, negative real GDP growth is negative coupled with horrid inflation.

Personal consumption expenditures were below expectations at 2.7%.

Now that the Biden Administration has created an old Soviet Union-style Ministry of Disinformation (called the “Disinformation Governance Board”), I hope that I don’t get censored for reporting that the Biden economy officially stinks.

Good luck to The Federal Reserve in withdrawing the monetary stimulus.

Alarm! US Treasury 10-year Yields Rise Over 11 BPS As Treasuries And Agency MBS Continue Downward Price Path (Pension Funds, SSA BEWARE!!)

Alarm!

Particularly if you are a pension fund and hold US Treasuries and Agency Mortgage Backed Securities.

The bad news is that the 10-year US Treasury Note declined in price, sending the yield up over 10 bps today.

As The Fed is projected to raise its target rate over 10 times by February 2023, 10-year Treasury Note prices and agency MBS 3.5% prices continue to decline.

Here is a video of The Biden Administration and The Federal Reserve attacking pension funds and Social Security.

Heartaches In Heartaches! US Q2 Real-time GDP Stumbles To 0.446% As Fed Continues Monetary Stimulypto (What Will Happen When The Fed Pulls The Plug??) March Pending Home Sales Decline -8.90% YoY

Heartaches in heartaches. US GDP growth for Q2 has stumbled to 0.446% as The Fed is launching quantitative tightening (QT) to fight the inflation that they caused in the first place.

According to the Atlanta Fed’s GDPNow real-time GDP tracker, US GDP growth has stumbled to a meager 0.446%. Despite the massive stimulus from The Federal Reserve and Washington DC’s massive fiscal stimulus.

Biden, Powell and Congress are driving me crazy with inflation/price changes.

No corporate economists, inflation is NOT a good thing.

Pending home sales decline 8.9% in March, another heartache for Americans.

Will The Fed say good bye to its Snake Juice??

Going Down! MBA Mortgage Applications Dive 8.6% WoW, Purchase Apps Decline 7%, Refi Apps Decline 9% As Mortgage Rates Skyrocket (ARM Share Rose 9.4% WoW)

Thanks to The Federal Reserve helping to raise mortgage rates through the roof, mortgage applications are going down.

From the MBA: Mortgage Applications Decrease in Latest MBA Weekly Survey. Mortgage applications decreased 8.3 percent from one week earlier, according to data from the Mortgage Bankers Association’s (MBA) Weekly Mortgage Applications Survey for the week ending April 22, 2022.

The Refinance Index decreased 9 percent from the previous week and was 71 percent lower than the same week one year ago.

The seasonally adjusted Purchase Index decreased 8 percent from one week earlier. The unadjusted Purchase Index decreased 7 percent compared with the previous week and was 17 percent lower than the same week one year ago.

The percentage of adjustable-rate mortgages (ARMs) increase 9.4% from previous week.

Yes, the 30-year mortgage rate is rising extremely fast.

You’re Going Down” by Jerome Powell and The Constitution Avenue band. President Joe Biden conducting.

The Fed’s Reverse Limbo Rock! Case-Shiller National Home Price Growth Accelerates In February To 19.80% YoY As Fed Keeps Foot On Accelerator

Making homes affordable is NOT one of the mottos for The Federal Reserve. But making homes outrageously unaffordable for the masses should be their motto.

The February Case-Shiller home price indices are out for February and the national home price index rose to 19.80% YoY.

Instead of the limbo rock, The Fed is apparently trying to see “How HIGH can we go?”

Once again, Phoenix is the fastest growing city in term of home prices at a sizzling 32.86% YoY. The slowest? Washington DC at 11.94% YoY. That’s right! 12 of the top 20 metro areas had price growth of over 20% in February!