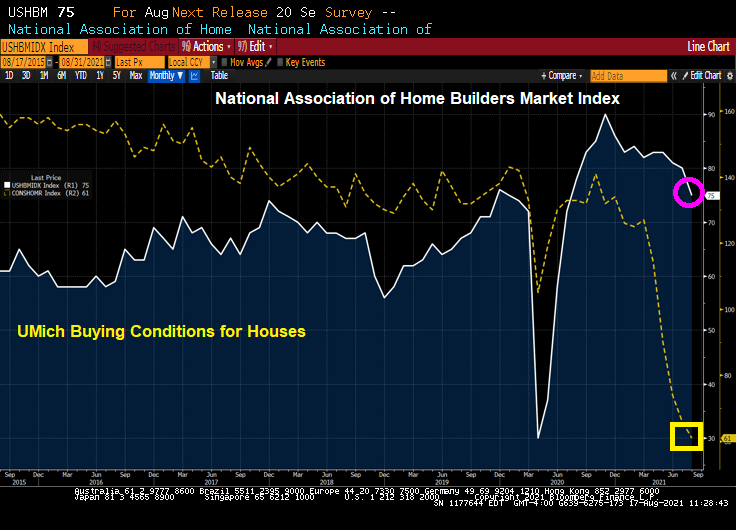
Of course, then we have the University of Michigan conditions for buying a home crashing as well.
Rising home prices and rising construction material costs? Yikes.
Of course, the NAHB had this to say:
“Our expectation is that production bottlenecks should ease over the coming months and the market should return to more normal conditions,” NAHB Chief Economist Robert Dietz said in a statement.
Perhaps, but The Fed needs to slow down its money printing as well.
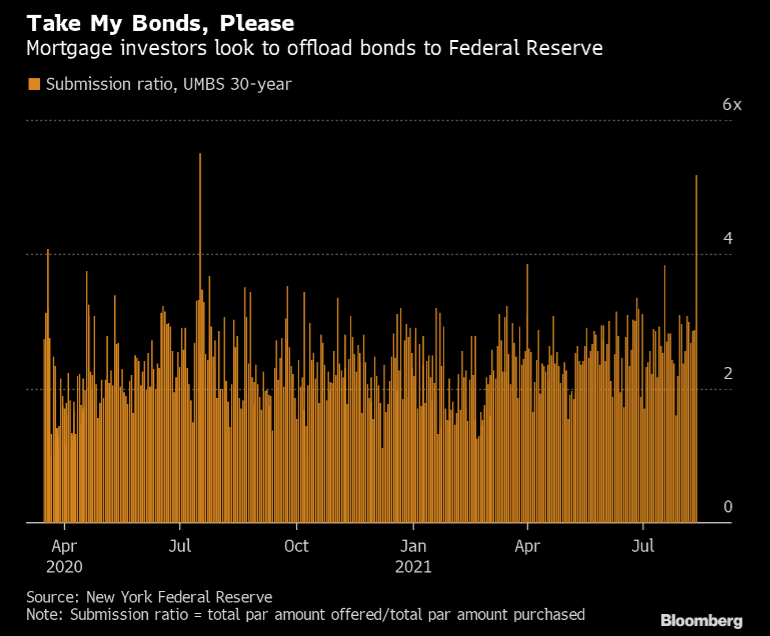
(Bloomberg) — Last week was notable for the tsunami of agency mortgage bonds offered to the Federal Reserve during its routine purchase operations on Friday.
The central bank’s quantitative easing schedule called for it to buy $2.9 billion of 30-year uniform mortgage bonds Friday, and that was nothing outside of its usual pattern. However, mortgage investors flooded the Fed with $15.06 billion of bonds for sale, the largest daily amount offered during a single operation since April 1, 2020.
In terms of how that compares to the total amount purchased, investors offered 5.2 times as much as were eventually taken down by the central bank. That is well above the 2.3 times average for 30-year uniform mortgage bond operations seen during all of this round of quantitative easing, and the second-highest overall. The highest submission ratio was the 5.5 times seen on July 16, 2020.
There are a number of reasons this could have happened. Investors may have wished to lighten their positions before the summer doldrums of late August, when many desks are lightly staffed due to vacations. Also, tight sector valuations or concerns about a sooner-than-expected taper may have played a part.
While this may simply be a one-off event and no reason for concern, it is certainly something to keep an eye on in case it heralds a change in investor sentiment.
In related news, the Treasury’s overnight reverse repos purchases remain about $1 trillion.
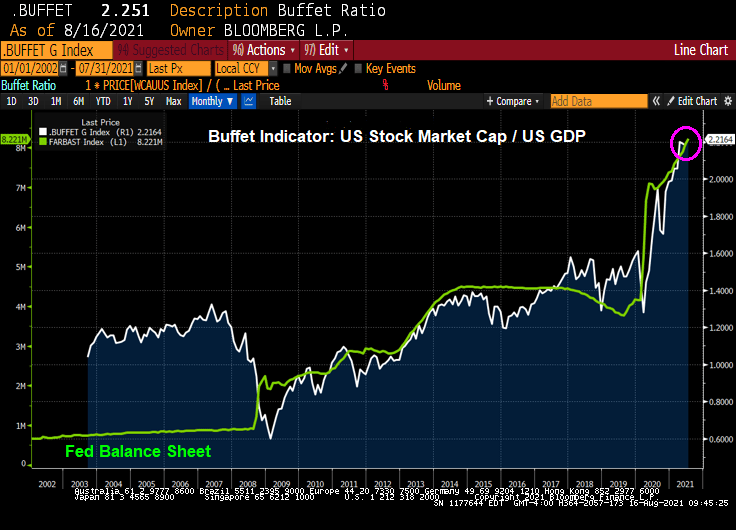
There are a variety of measures of an asset bubble. And each one points to an unsustainable bubble in the stock market.
Let’s start with the Buffett Indicator. The ratio of Total Market Capitalization of all US stocks (WCAUUS ) to total nominal GDP of the United States (GDP CUR$ ).
There is also the GLOBAL Buffett ratio produced by Holger Zschäpitz. Global market cap now equal to 139% of global GDP, way above Buffett’s 100% bubble threshold.
Shiller’s Cyclically-adjusted Price-earnings ratio? Still climbing and resembles the Dot.com bubble of 2000.
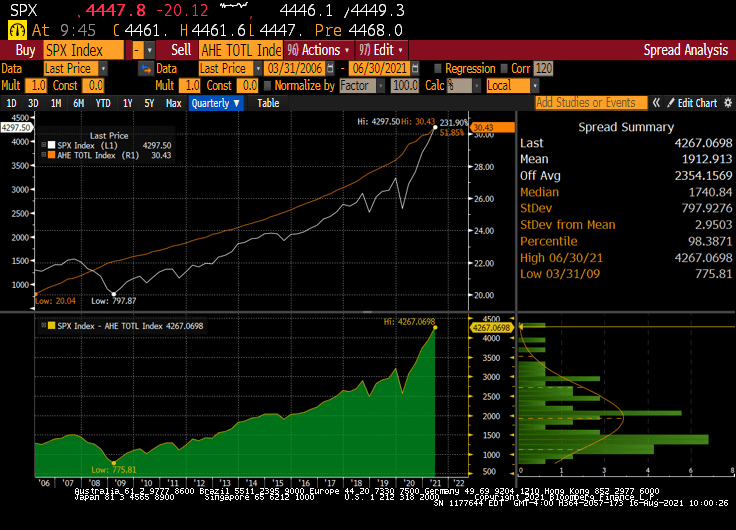
How about gold to Average Hourly Earnings (similar to the Bichler and Nitzan “Power” measure. The spread (bottom chart) sees the S&P 500 index soaring away from average hourly earnings.
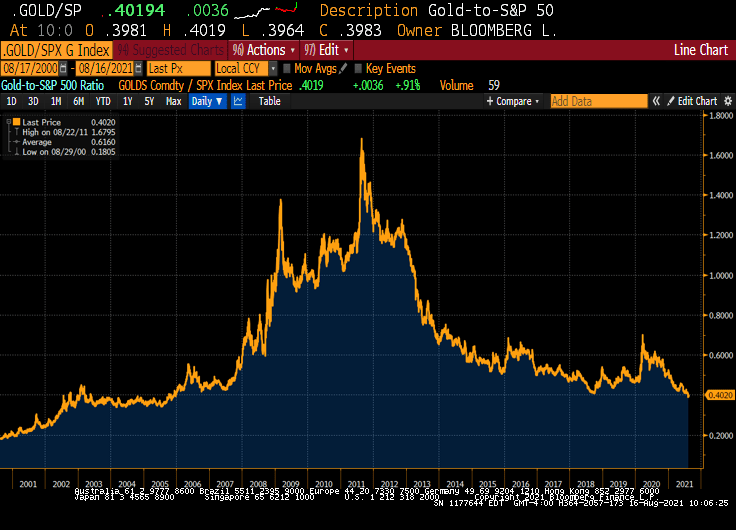
We also have the Gold to SPX ratio that is now back to pre-financial crisis levels.
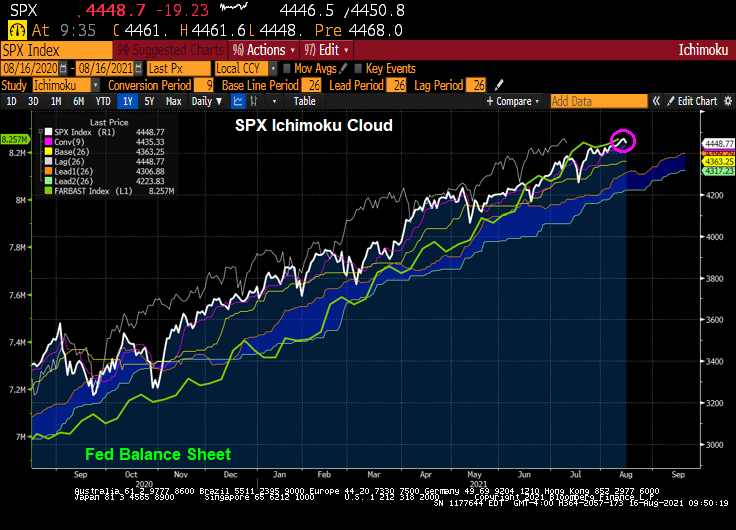
How about the Ichimoku cloud, where the SPX is currently ABOVE the cloud?
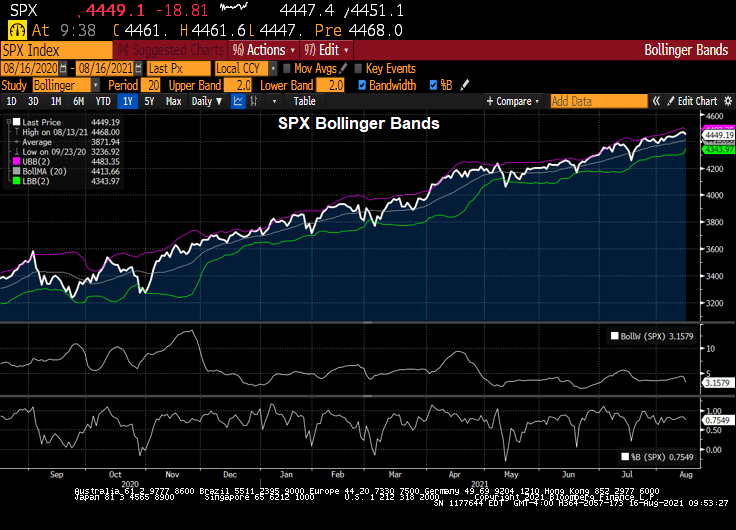
SPX and Bollinger Bands? The SPX index is close to the upper band.
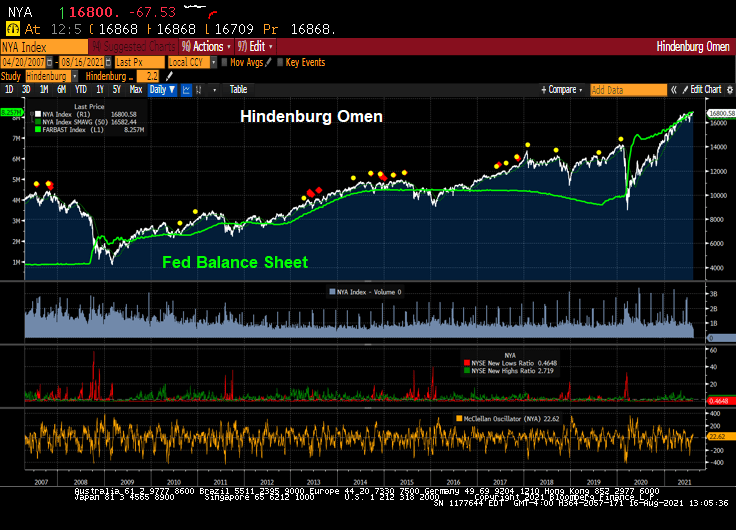
How about The Hindenburg Omen, a technical indicator that was designed to signal the increased probability of a stock market crash. It compares the percentage of new 52-week highs and new 52-week lows in stock prices to a predetermined reference percentage that is supposed to predict the increasing likelihood of a market crash.
So it looks like a have a bubble in the stock market.
Fed Chair Jerome Powell sees the ghost of the Dot.com bubble.
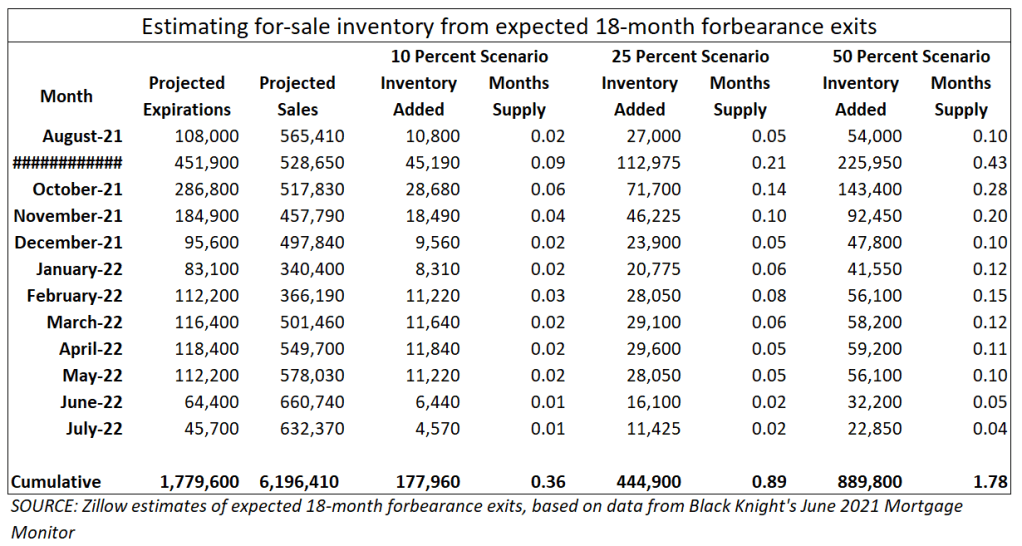
There will be more housing inventory hitting the market soon. As home prices are up and most are no longer in negative equity situations, some will decide to sell into this hot market. Obviously not paying your mortgage for 12, 14, 16, or even 18 months is a nice bonus that party is coming to an end.
Zillow’s research found that most are not going to bring their mortgage current. Assume someone took a forbearance and their monthly mortgage cost was $2,000 per month, some may be behind by up to $36,000 when the forbearance period ends. Okay, well what if you can’t make it current? You can defer the payments to the end of the mortgage but you still owe that and many got used to not even paying the regular monthly payment. So a sizable portion will be selling
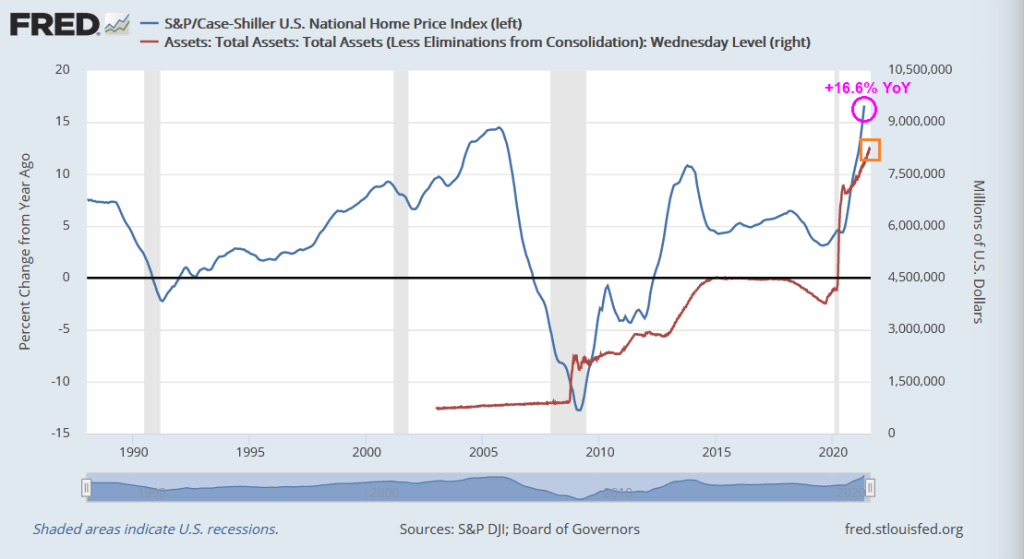
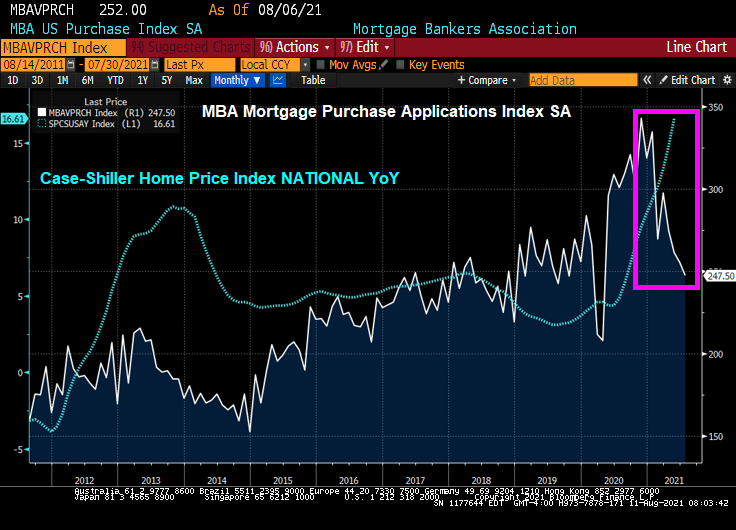
Could this be the end of the 16.6% YoY growth rate in home prices? Or will Congress and/or The Biden Administration extend the forbearance? Or will The Fed expand their balance sheet even further??
The purchasing power of the US Dollar has been virtually erased since the creation of The Federal Reserve in 1913 when $1,000 in 1913 is now worth $36.36. And M2 Money Velocity (GDP/M2 Money) has crashed and burned to the lowest level in history.
Inflation? Home price growth YoY is the highest in modern US history. And CPI growth YoY is the highest since the Financial Crisis and July 2008.
Bear in mind that before the creation of The Federal Reserve System in 1913, there were numerous incidents of inflation and bank failures leading banks to want protection of a national banking system that controlled the currency. Well, the banks got what they wanted.
The Fed is predicted to ease its foot off the printing press in the latter half of 2022.
Today’s import and export numbers for the USA show a disturbing trend. US export prices rose +17.2% YoY in July. That is the third consecutive month of +16.9% and above export prices growth.
That begs the question: Is The Federal Reserve exporting inflation to US trading partners through its financial repression?
The University of Michigan survey of consumers is out and their buying conditions for housing (good) was a disasters. Only 32% on consumers view buying conditions for a house as good. That means that 68% think buying conditions are not good. Why? With the Case-Shiller National Home Price Index growing at a scorching 16.6% YoY making housing simply unaffordable for many Americans.
On a different note, The Fed’s overnight reverse repo facility (aka, the slosh” just breached the $1 trillion mark.
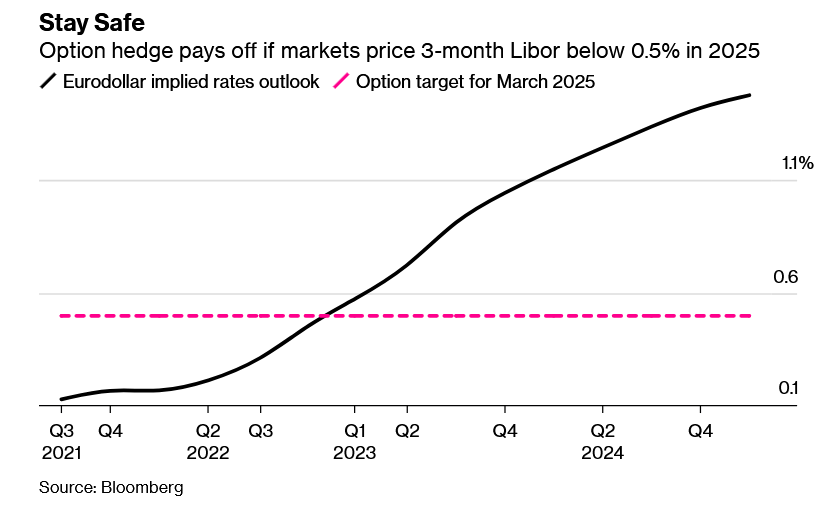
Treasury yields are rising amid optimism over the global recovery but there has been a run on Eurodollar options betting the Federal Reserve will opt not to raise interest rates at all.
Traders this week have been busy snapping up Eurodollar call options on underlying March 2025 futures that target three-month Libor to fix below 0.5%. These pay off if markets price the Fed keeping its benchmark at its lower bound until then. Futures markets are currently anticipating Libor will rise to about 1.47% by the first quarter of 2025.
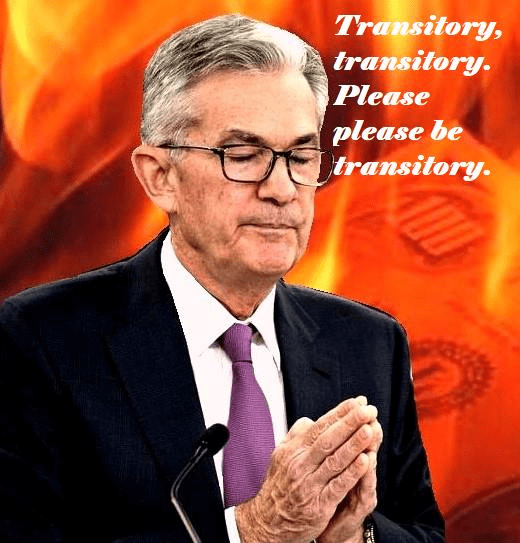
So, it looks like The Fed (aka, Greenman) may not be going anywhere.
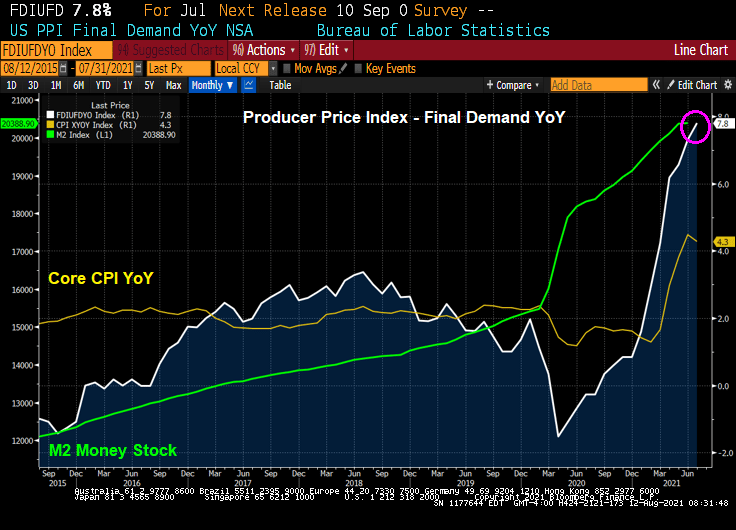
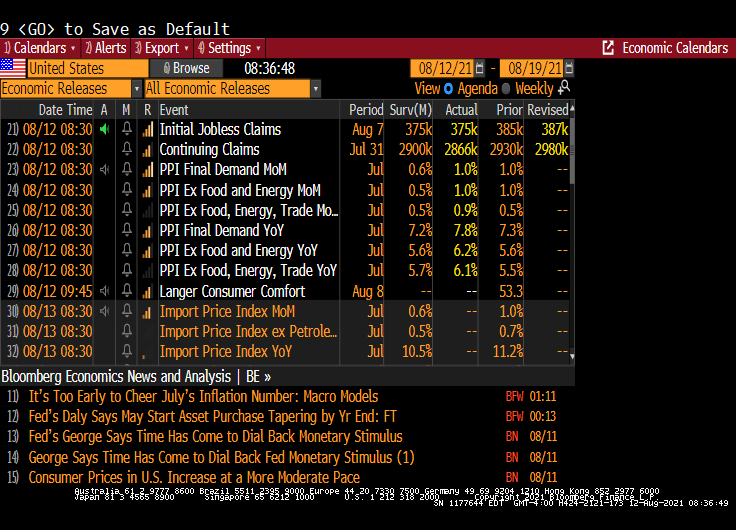
Well, economists were expecting a 7.2% YoY print of the Producer Price Index – Final Demand. But July’s print came in hot … at +7.8% YoY. Compare that with the Core Consumer Price Index YoY of +4.3%.
The month-over-month PPI Final Demand is showing a run rate of 12%! (1% in July x 12 months).
The Covid Delta Variant seems to be picking up steam, we are seeing “flight to safety” assets other than Treasuries rising.
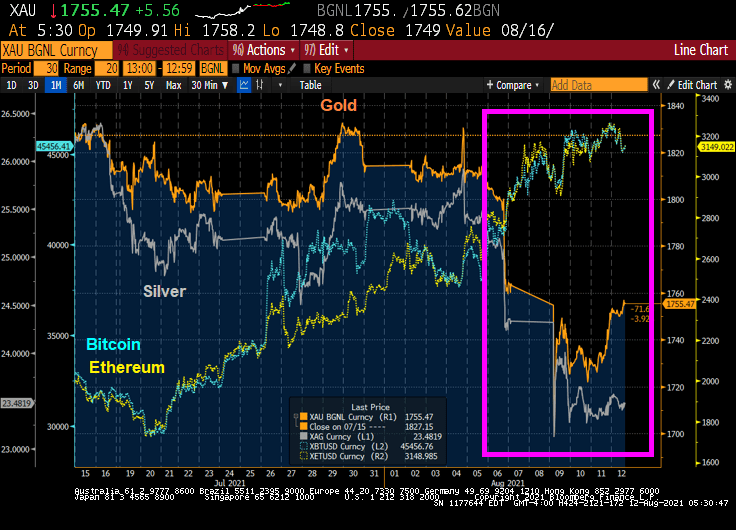
Gold and Silver experienced some serious corrections last week, perhaps because things were looking up. Then we saw Anthony Fauci scaring everyone about Covid … again. So, there is enormous uncertainty about how this will play out. In other words, ALARM!
Bitcoin and Ethereum have been climbing since Gold and Silver corrected last week. But both are up this week, particularly Gold.
The US Dollar is down slightly since the same time last year and M2 Money Stock growth has slowed.
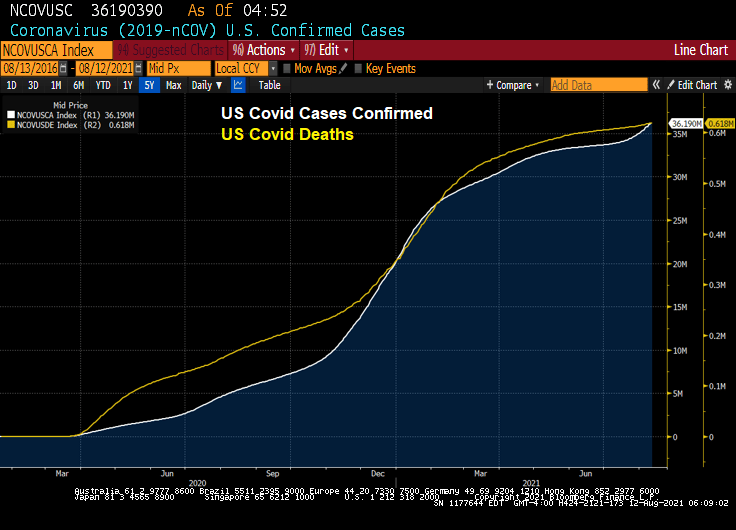
Here is a chart showing another fear factor: the rise of the Covid Delta Variant. Deaths are only 1.7% of confirmed cases (if we believe the actual cause of death).
Mortgage applications increased 2.8 percent from one week earlier, according to data from the Mortgage Bankers Association’s (MBA) Weekly Mortgage Applications Survey for the week ending August 6, 2021.
The Refinance Index increased 3 percent from the previous week and was 8 percent lower than the same week one year ago. But recent declines in mortgage rates have produced a mini-refi wave (pink box).
The seasonally adjusted Purchase Index increased 2 percent from one week earlier. The unadjusted Purchase Index increased 1 percent compared with the previous week and was 18 percent lower than the same week one year ago. But rapidly rising home prices have cooled mortgage purchase applications since the beginning of 2021.
Here is the data from the MBA showing a rise in mortgage applications from the previous week of 2.79%.




















You must be logged in to post a comment.