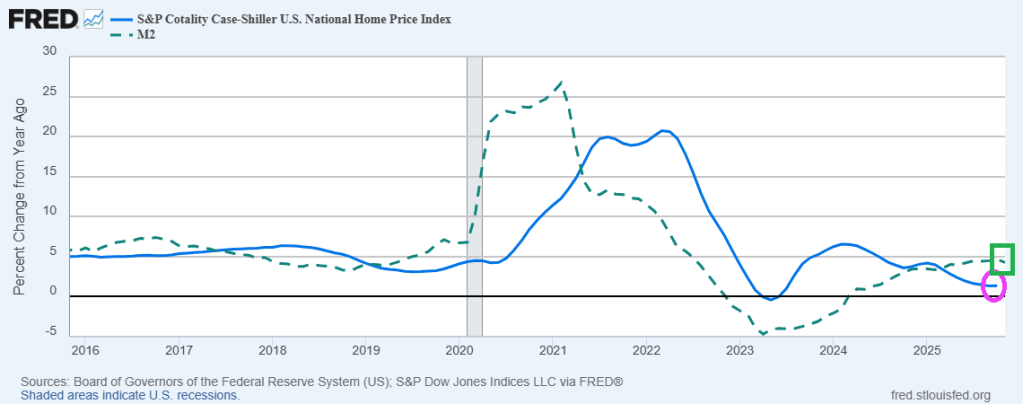
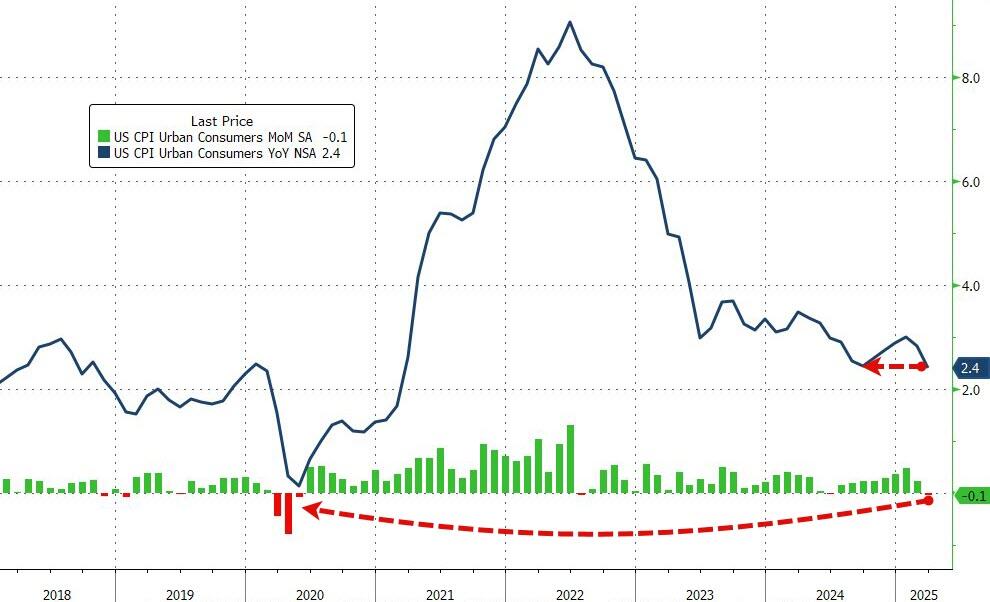
While its not the 2009, we do have a house price bubble that is deflating as The Fed slows M2 Money growth. However, we are witnessing rising foreclosure rates.
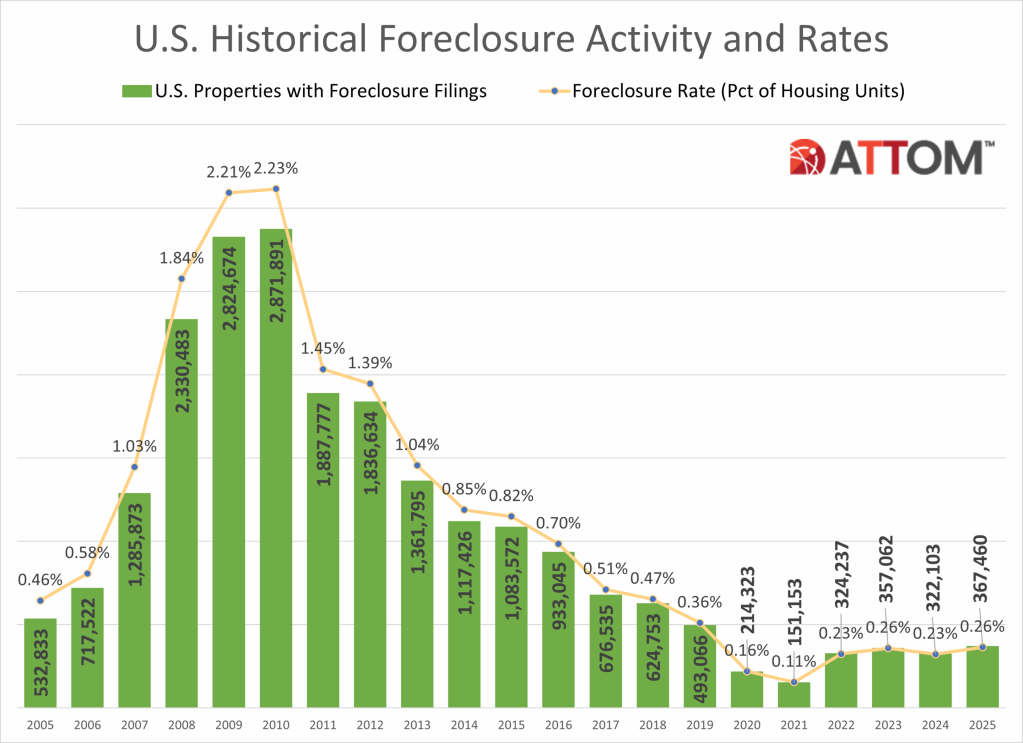
Foreclosure activity increased in 2025, reflecting a continued normalization of the housing market following several years of historically low levels,” said Rob Barber, CEO at ATTOM. “While filings, starts, and repossessions all rose compared to 2024, foreclosure activity remains well below pre-pandemic norms and a fraction of what we saw during the last housing crisis. The data suggests that today’s uptick is being driven more by market recalibration than widespread homeowner distress, with strong equity positions and more disciplined lending continuing to limit risk.
Foreclosure starts on the rise nationwide
Lenders started the foreclosure process on 289,441 U.S. properties in 2025, up 14 percent from 2024, up 213 percent from the pandemic-era low in 2021, but down 14 percent form 2019 and down 86 percent from a peak of 2,139,005 in 2009.
States that saw the greatest number of foreclosure starts in 2025 included Texas (37,215 foreclosure starts); Florida (34,336 foreclosure starts); California (29,777 foreclosure starts); Illinois (15,010 foreclosure starts); and New York (13,664 foreclosure starts).
Those metropolitan statistical areas with a population greater than 1 million that saw the greatest number of foreclosure starts in 2025 included New York, NY (14,189 foreclosure starts); Chicago, IL (13,312 foreclosure starts); Houston, TX (13,009 foreclosure starts); Miami, FL (8,936 foreclosure starts); and Los Angeles, CA (8,503 foreclosure starts).
Bank repossessions increase year over year
Lenders repossessed 46,439 properties through foreclosures (REO) in 2025, up 27 percent from 2024 but down 68 percent from 143,955 in 2019, the last full year before pandemic-related declines, and down 96 percent from a peak of 1,050,500 in 2010.
States that saw the greatest number of REOs in 2025 included Texas (5,147 REOs); California (4,030 REOs); Pennsylvania (2,975 REOs); Florida (2,869 REOs); and Illinois (2,768 REOs).
Those metropolitan statistical areas with a population greater than 1 million that saw the greatest number of REOs in 2025 included Chicago, IL (2,033 REOs); New York, NY (1,462 REOs); Houston, TX (1,381 REOs); Detroit, MI (1,105 REOs); and Philadelphia, PA (1,100 REOs).
Florida, Delaware, and South Carolina record the worst foreclosure rates in 2025
States with the worst foreclosure rates in 2025 were Florida (1 in every 230 housing units with a foreclosure filing); Delaware (1 in every 240 housing units); South Carolina (1 in every 242 housing units); Illinois (1 in every 248 housing units); and Nevada (1 in every 248 housing units).
Rounding out the top 10 states with the worst foreclosure rates in 2025, were New Jersey (1 in every 273 housing units); Indiana (1 in every 302 housing units); Ohio (1 in every 307 housing units); Texas (1 in every 319 housing units); and Maryland (1 in every 326 housing units).
Lakeland, Columbia, and Cleveland post the worst metro foreclosure rates in 2025
Among 225 metropolitan statistical areas with a population of at least 200,000, those with the worst foreclosure rates in 2025 were Lakeland, FL (1 in every 145 housing units with a foreclosure filing); Columbia, SC (1 in every 165 housing units); Cleveland, OH (1 in every 187 housing units); Cape Coral, FL (1 in every 189 housing units); and Atlantic City, NJ (1 in every 192 housing units).
Metro areas with a population greater than 1 million, including Cleveland that had the worst foreclosure rates in 2025 were: Jacksonville, FL (1 in every 200 housing units); Las Vegas, NV (1 in every 210 housing units); Chicago, IL (1 in every 214 housing units); and Orlando, FL (1 in every 217 housing units).
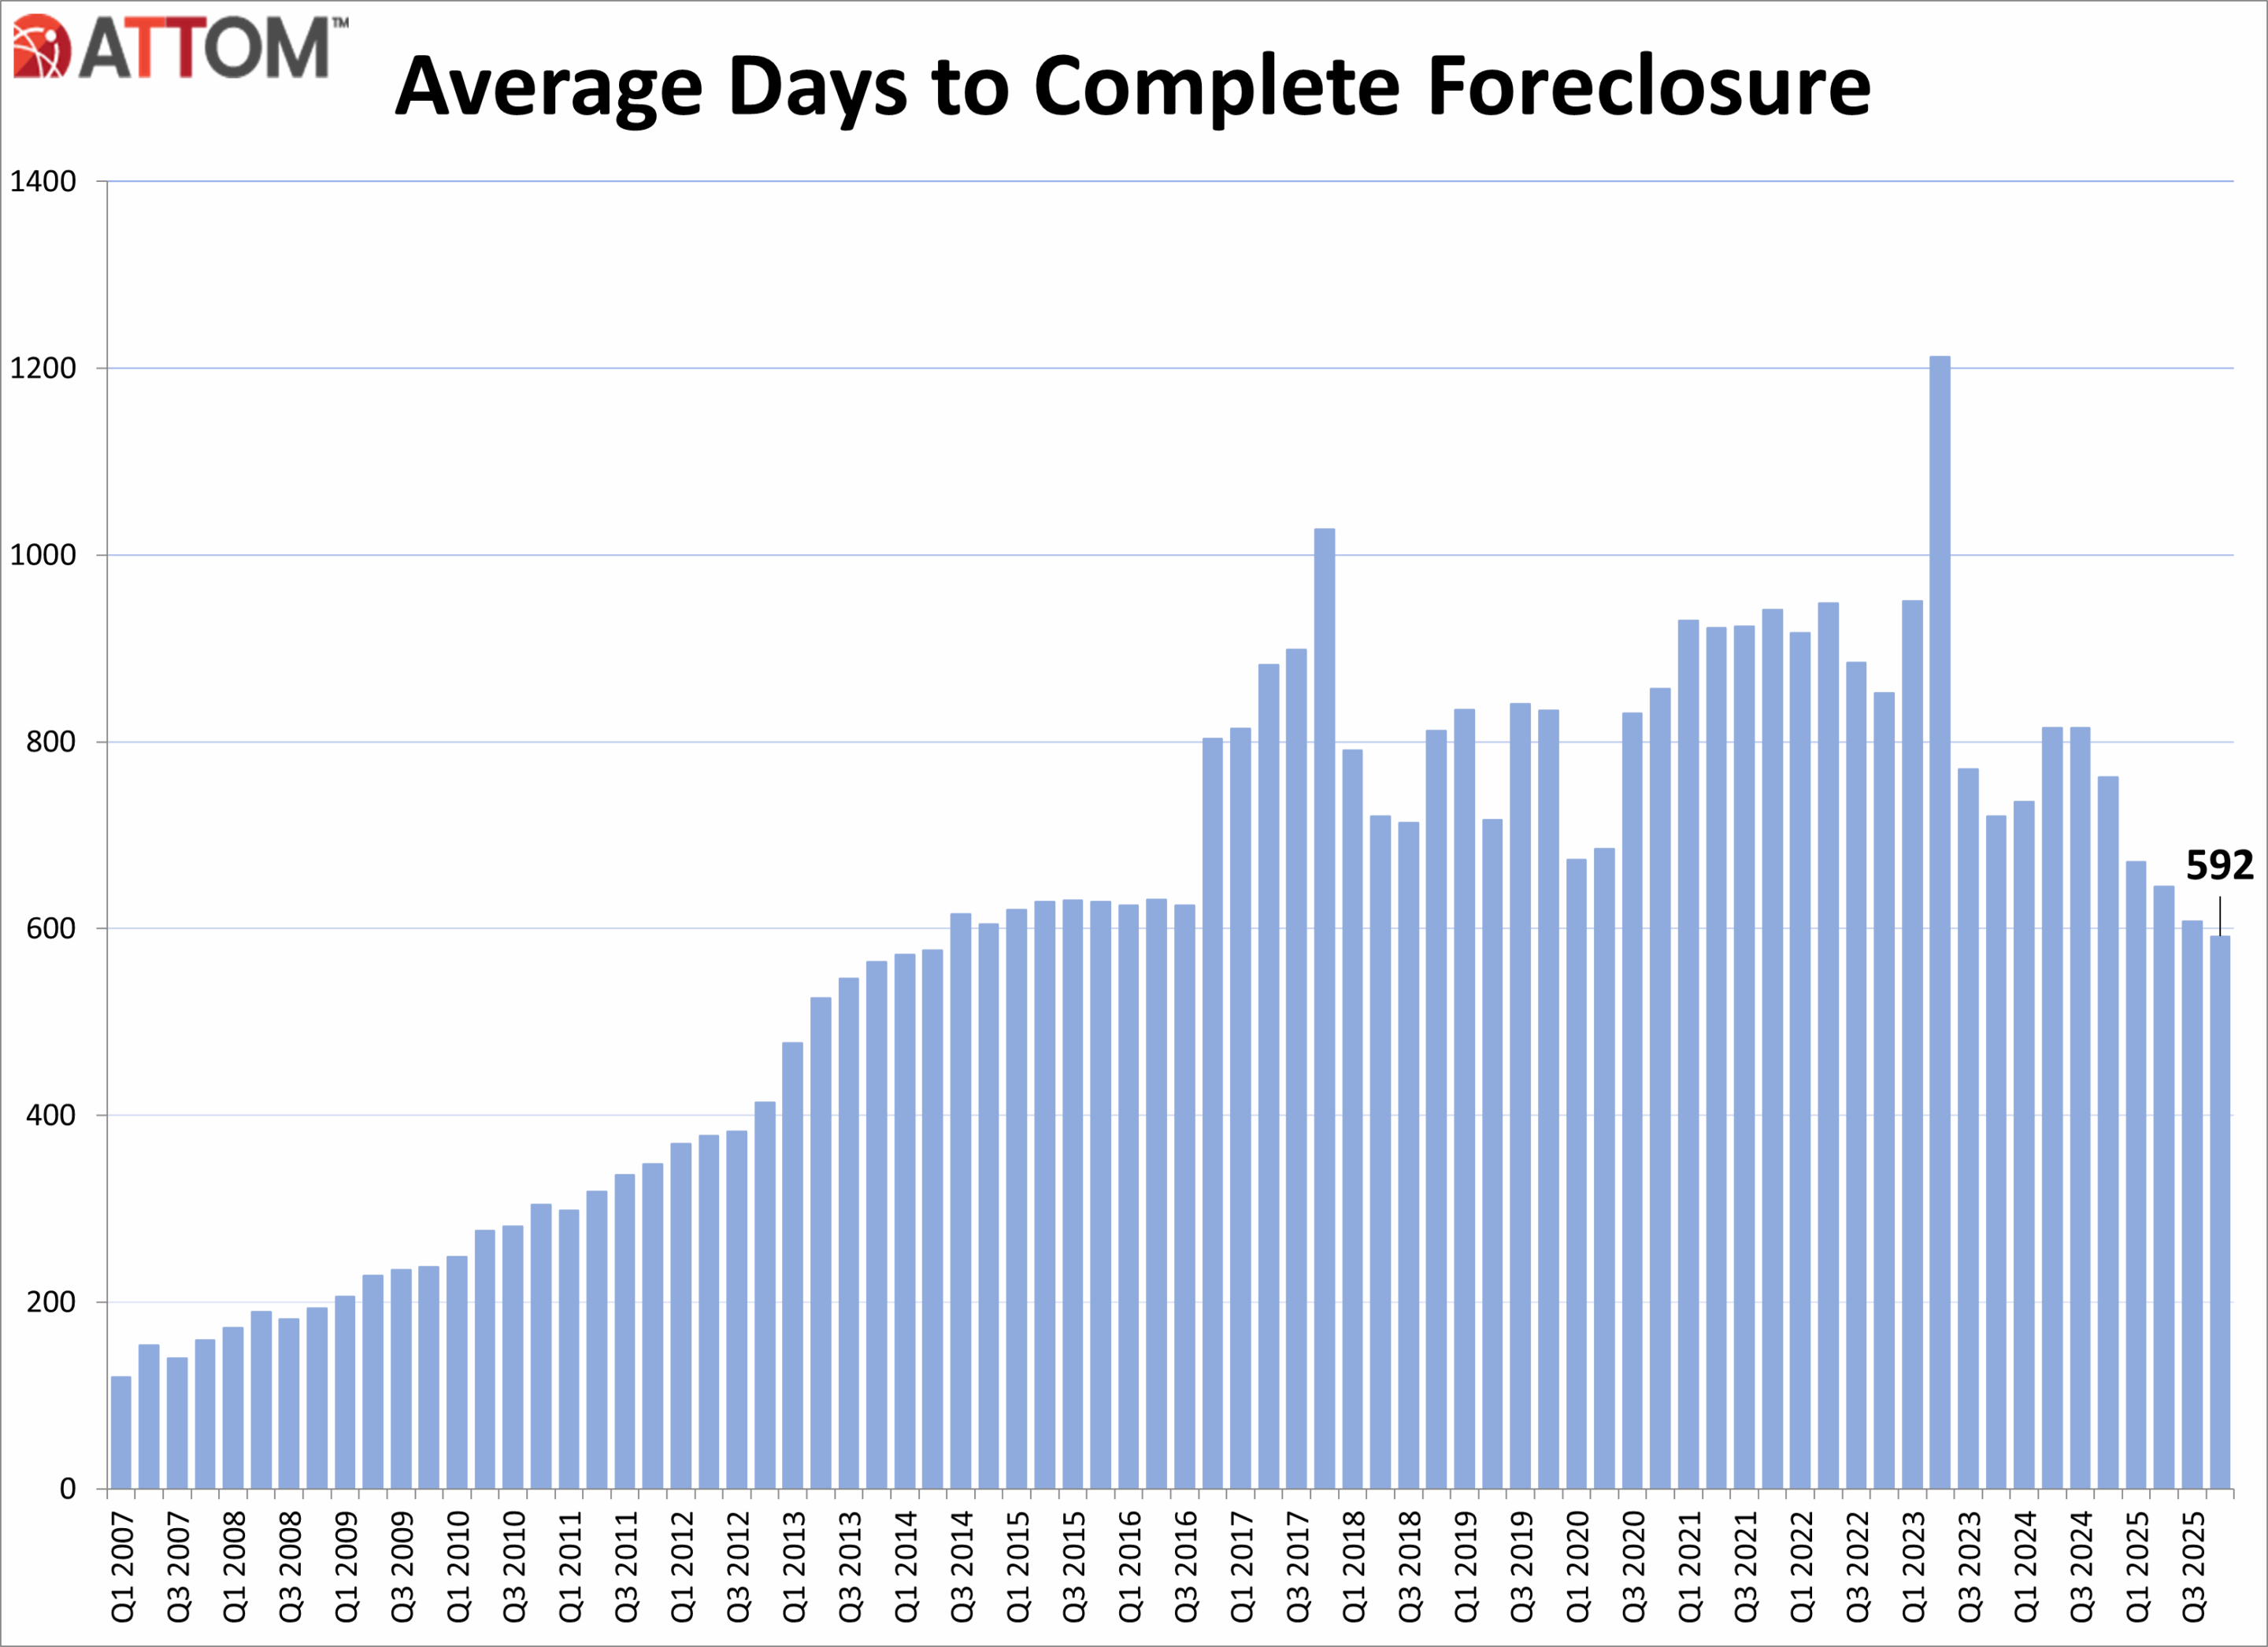
Average time to foreclose decreases
U.S. properties foreclosed in the fourth quarter of 2025 had been in the foreclosure process an average of 592 days, a 3 percent decrease from the previous quarter and a 22 percent decrease from a year ago.
States with the longest average time to foreclose in Q4 2025 were Louisiana (3,461 days); New York (1,998 days); Hawaii (1,760 days); Connecticut (1,600 days); and Kansas (1,594 days).
Powering Real Estate Businesses with Property Data and AnalyticsSolutions For Every Industry
Q4 2025 Foreclosure Activity Key Takeaways
- There was a total of 111,692 U.S. properties with foreclosure filings in Q4 2025, up 10 percent from the previous quarter and up 32 percent from a year ago.
- Nationwide in Q4 2025, one in every 1,274 properties had a foreclosure filing.
December 2025 Foreclosure Activity Key Takeaways
- Nationwide in December 2025, one in every 3,163 properties had a foreclosure filing.
- States with the worst foreclosure rates in December 2025 were New Jersey (one in every 1,734 housing units with a foreclosure filing); South Carolina (one in every 1,917 housing units); Maryland (one in every 1,961 housing units); Delaware (one in every 2,044 housing units); and Florida (one in every 2,119 housing units).
- 28,269 U.S. properties started the foreclosure process in December 2025, up 19 percent from the previous month and up 46 percent from a year ago.
- Lenders completed the foreclosure process on 5,953 U.S. properties in December 2025, up 53 percent from the previous month and up 101 percent from a year ago.
Conclusion
ATTOM’s Year-End 2025 Foreclosure Market Report shows that U.S. foreclosure activity increased in 2025, with foreclosure filings, starts, and bank repossessions all rising compared to 2024, signaling a continued shift toward more normalized market conditions. Despite the annual increases, foreclosure activity remains significantly below pre-pandemic levels and far below peaks seen during the last housing crisis. December 2025 and Q4 2025 data also showed increased foreclosure activity on both a monthly and annual basis.
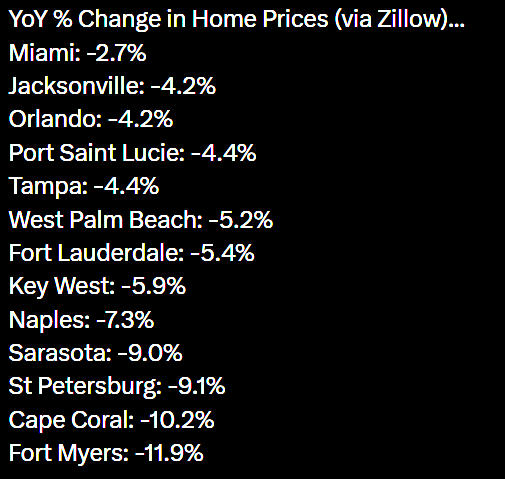
Florida home prices are tanking with Fort Myers leading the collapse at -11.9% YoY.


You must be logged in to post a comment.