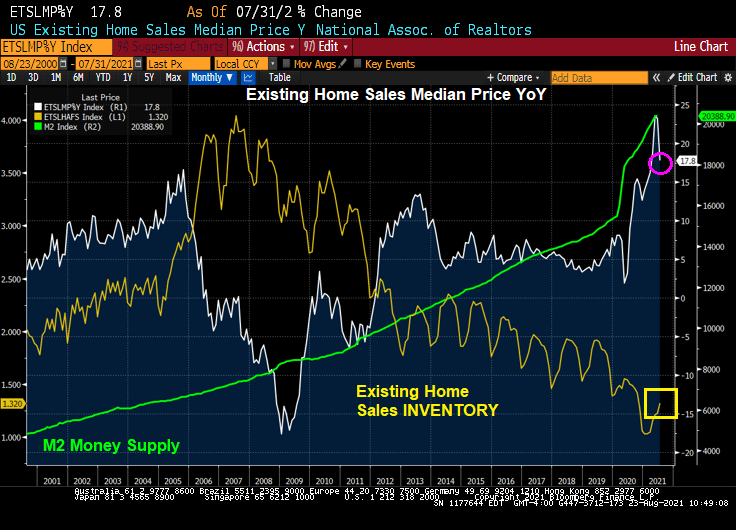
US existing home sales in July rose to 5.99 million SAAR, beating expectations. But the inventory of home available for sale remains low by historic standards.
The median price of existing homes declined to 17.8% YoY with The Federal Reserve pumping money into the system like there is no tomorrow.
Bloomberg had the following headline: “Sales of Existing Homes in U.S. Rise as Inventory Picks Up.” While that is a true statement, existing home sales inventory is still down 12% YoY.
I wonder if the attendees at the Jackson Hole Fed conference will be discussing the gut-wrenching home price growth? Rumor has it that Fed Chair Powell will use J-Hole as a platform to suggest paring back on the monetary stimulus.
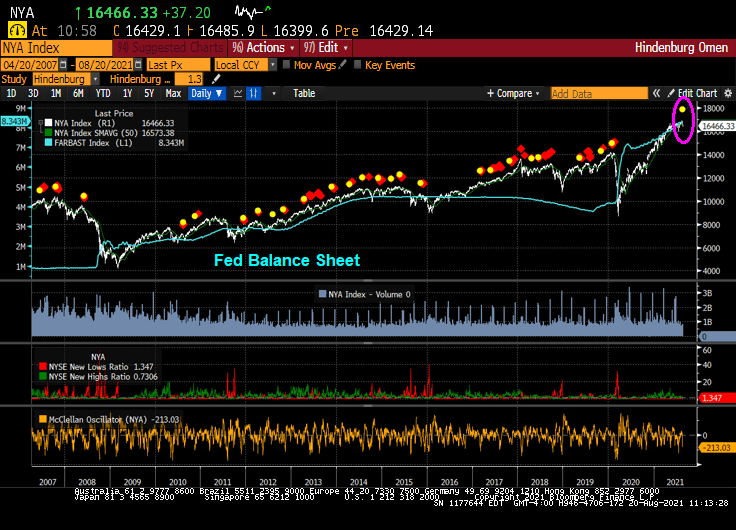
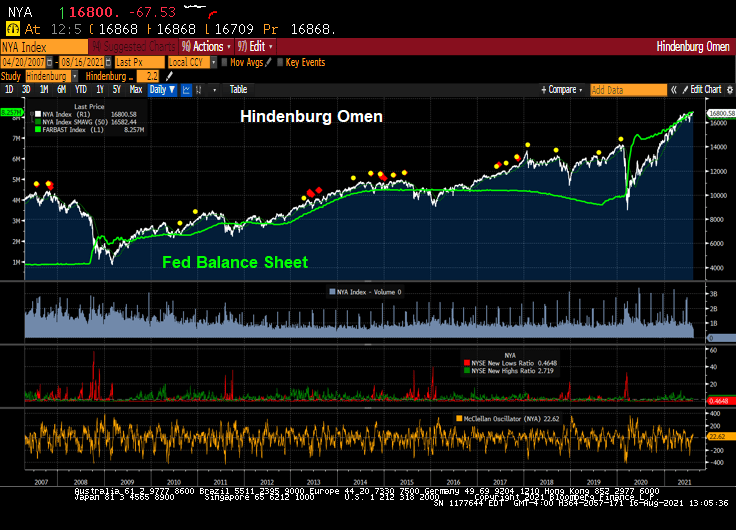
The famous Hindenburg Omen, the technical indicator that predicted the 2008 correction in the stock market, has just flashed “ALARM” again.
To be sure, there hasn’t been a major correction in the stock market since the financial crisis, primarily because The Federal Reserve has constantly goosed the markets since late 2008.
Just as the Shiller CAPE ratio is signalling ALARM!
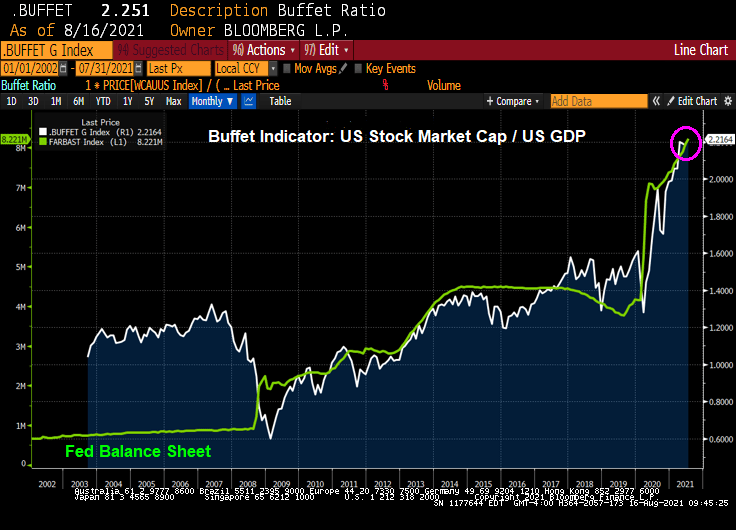
As is the Buffet Indicator.
I have no doubts that the Fed will withdraw its monstrous stimulus from the market after the Jackson Hole Fed conference. … NOT!!!!
Maverick Capital posted this nugget today showing The Buffet Indicator (US equity market cap/GDP) and US Corporate Profits / GDP. All I can say is “simply unsustainable.”
Headline! “Fed’s Kaplan says delta variant could cause him to rethink his tapering view”
Face it, the Federal Reserve may alter its growth path on asset purchases of Treasuries and Agency Mortgage-backed Securities, but it is doubtful that they will pare back their balance sheet. Call it “A Never-ending balance sheet for you” world.
Why? Seemingly never-ending Covid crisis, etc.
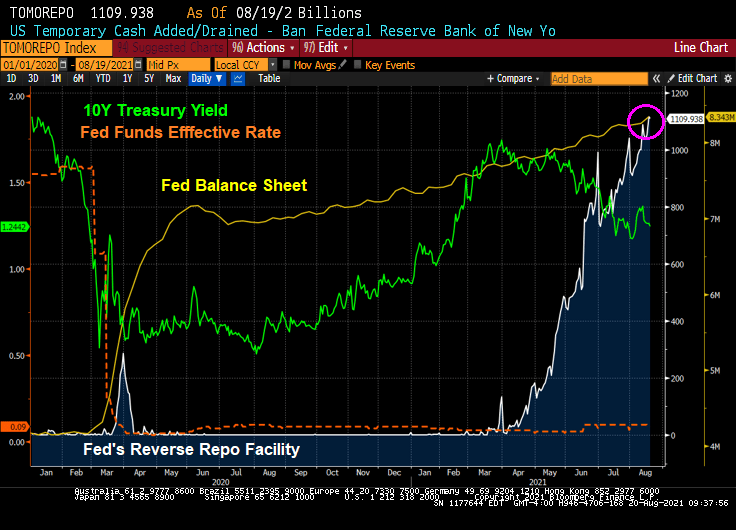
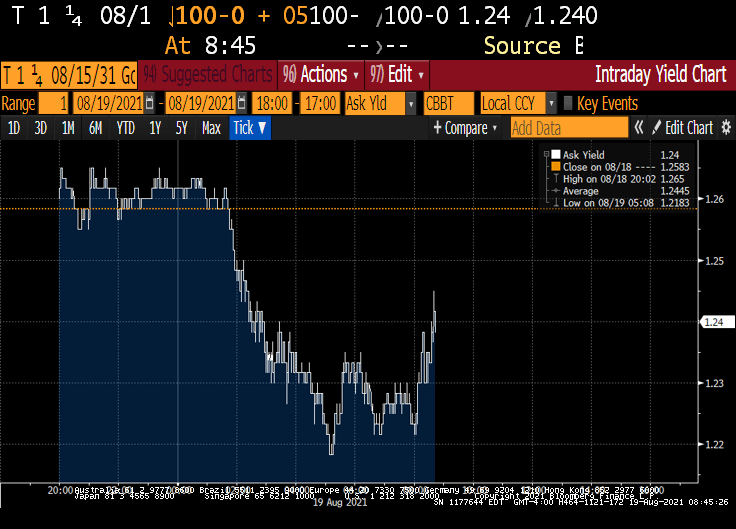
Let’s look at US Treasury yields today. The 10-year Treasury yield is up slightly to 1.25% as of 10am EST.
Here is a chart of the 10-year Treasury yield, Fed Funds effective rate, Fed Balance sheet and reverse repos since the Covid outbreak and Fed massive intervention. Bottom line, the have repressed the short-term interest rates and put downward pressure on the 10-year Treasury yield.
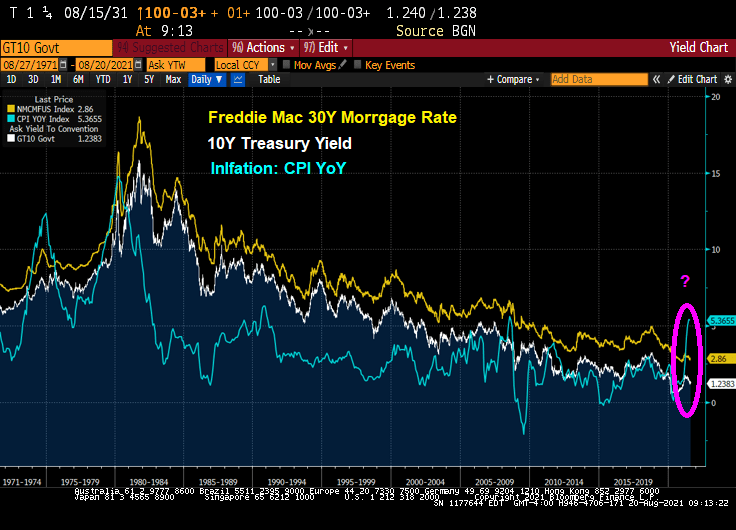
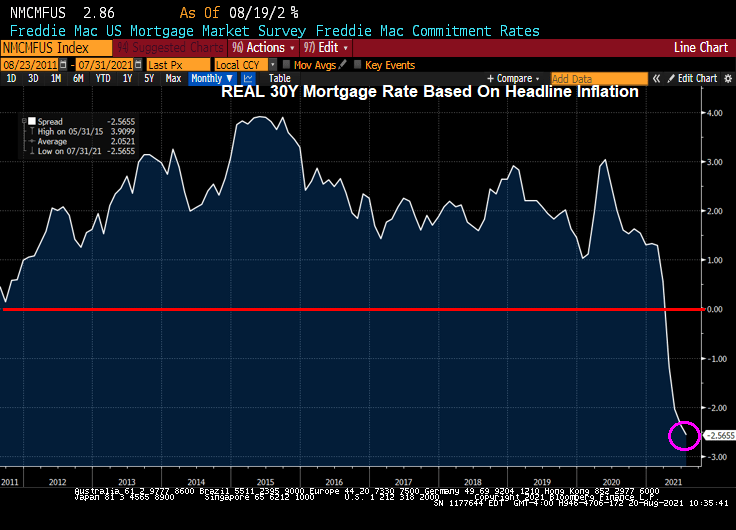
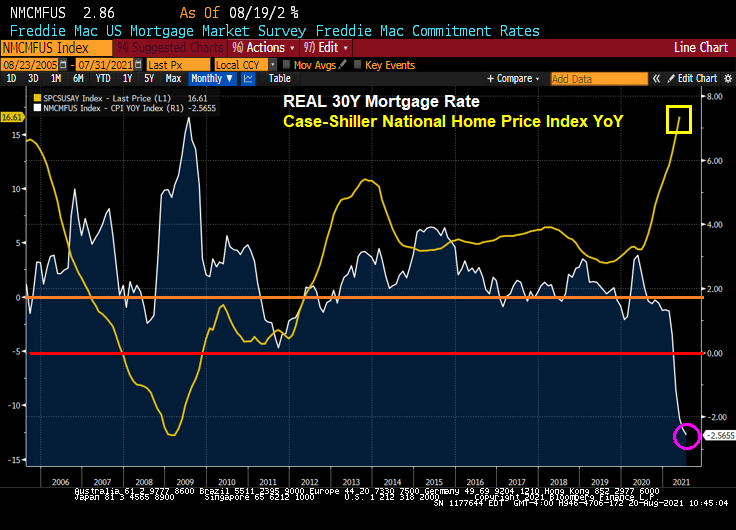
As the 10-year Treasury yield remains repressed DESPITE HIGHEST INFLATION RATE SINCE 2008, the Freddie Mac 30-year mortgage rate remains repressed as well. Yes, that mean NEGATIVE REAL MORTGAGE RATES.
This produces a REAL mortgage rate of -2.56%.
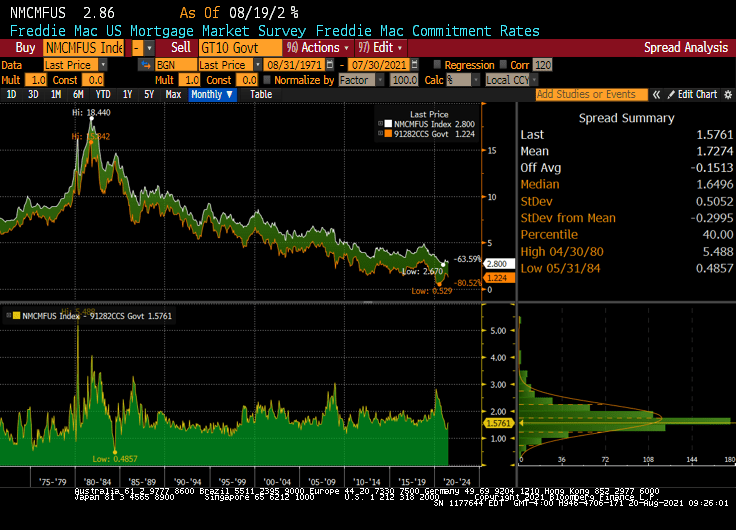
The spread of mortgage rates over the 10-year Treasury yield is about 173 basis point since 1971.
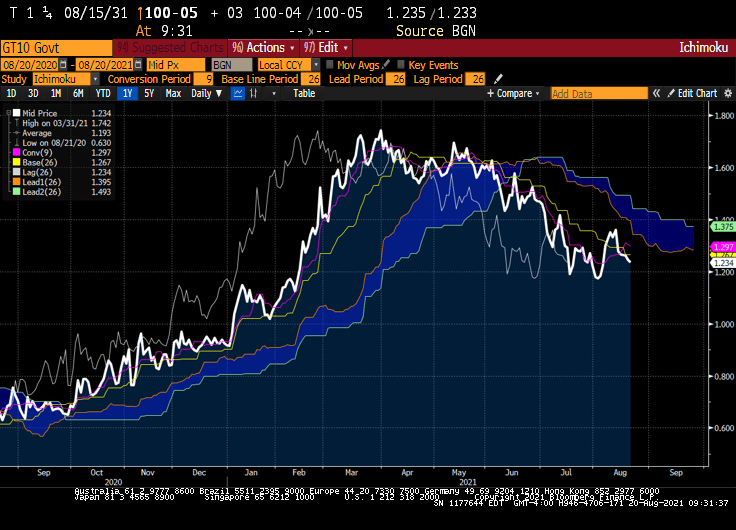
Where will Treasury yields go from hear? If we believe technical analysis like the Ichimoku Cloud, the 10-year Treasury rate will likely rise.
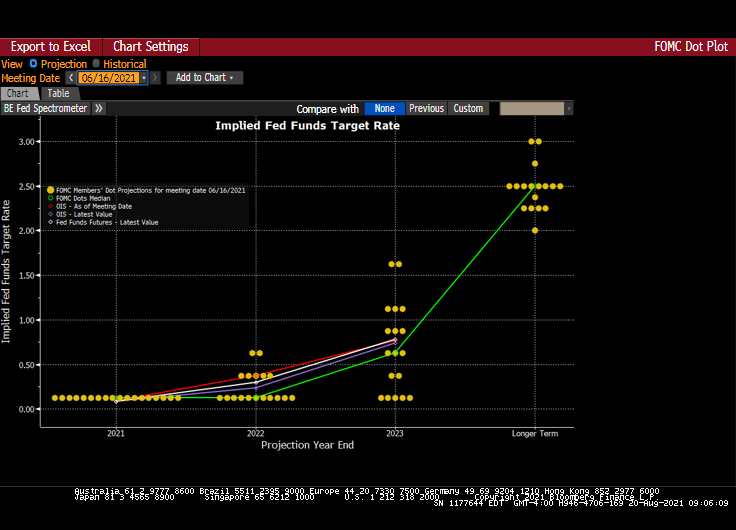
And The Fed’s Dots project also see rates rising (at least on the short-end.
Negative real mortgage rates and blistering home price growth?
Will the attendees at the KC Fed Jackson Hole conference discuss these matters? Or will it just be a Federal Reserve Soul Shake (dance)?
The minutes of the July Fed meeting suggest officials may signal an impending start to asset purchase tapering at the September gathering — provided jobs numbers remain on track in the interim — and make an announcement in November.
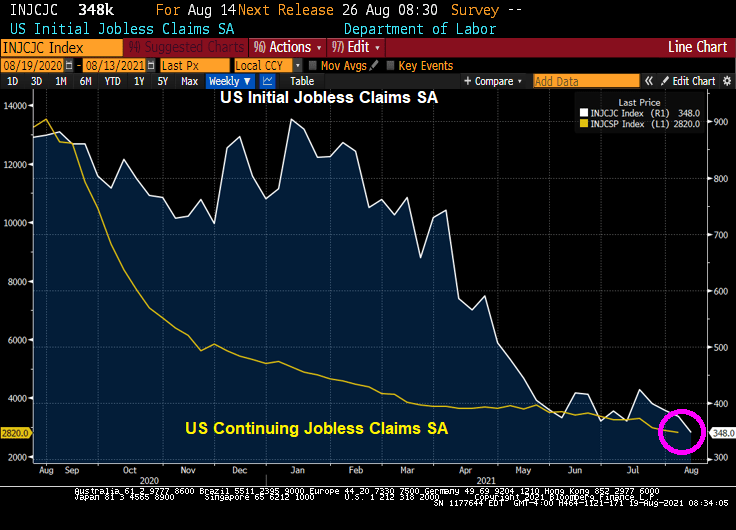
Rising infections counts have not spurred an uptick in new jobless claims. High-frequency data show some customers are shying away from eating out, but the overall impact on restaurant reservations is limited. The bigger challenge for many companies is retaining and hiring enough workers to meet strong demand, evident in low layoff counts and persistent mention of labor shortages.
In other words, IFF Covid doesn’t cause further economic damage (or governments don’t shut down economies), then The Fed will consider a mild taper of their balance sheet.
But as of this morning, The Fed’s reverse repo facility keeps on rising along with The Fed’s balance sheet. At least M2 Money Supply growth has leveled off.
That should result in an increase in Treasury yields and mortgage rates, all things being equal. And assuming the Biden Administration and governors don’t panic and go into economic lockdown … again.
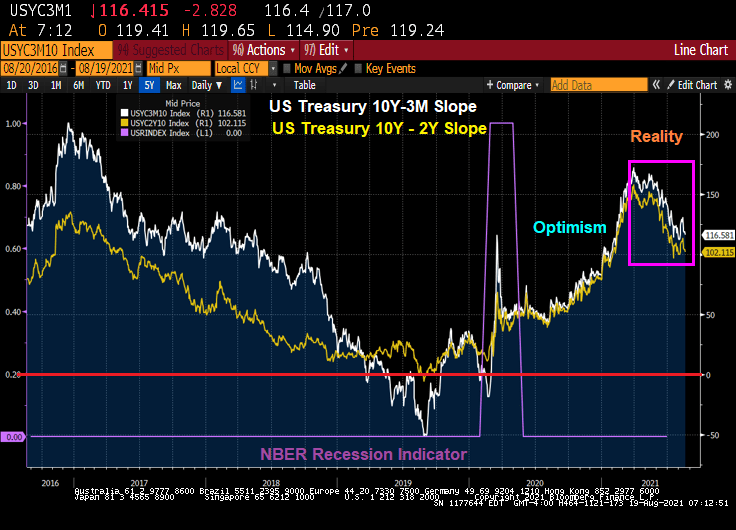
The US Treasury curves since the Covid recession of 2020 have shown optimism in recovery … then reality dawned.
Well, it looks like The Fed will start tapering after all.
Initial jobless claims fell again to 348K and continuing jobless claims fell to 2,820K.
Unless Biden’s disastrous Afghanistan withdrawal sends shock waves through the global economy (or Covid Delta/Lamba variant strains get worse and hurt the economy), we should see The Fed start tapering their balance sheet.
The 10Y Treasury yield rose slightly on the jobs report.
The Tapir, the symbolic mascot of The Fed’s tapering programs.
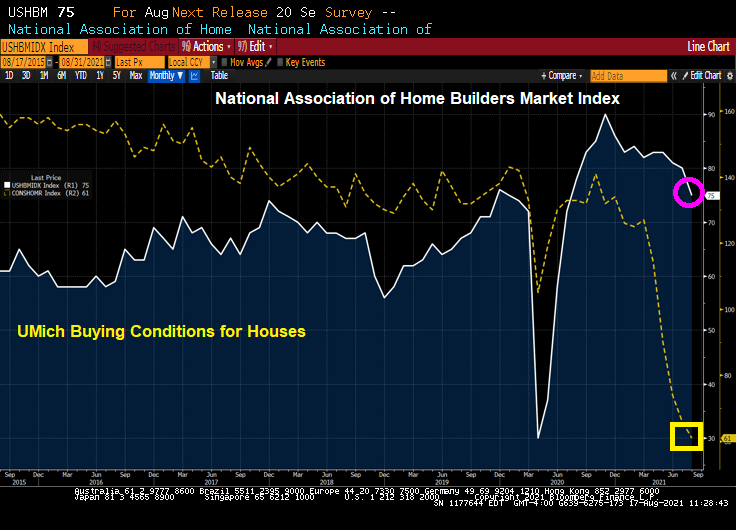
Of course, then we have the University of Michigan conditions for buying a home crashing as well.
Rising home prices and rising construction material costs? Yikes.
Of course, the NAHB had this to say:
“Our expectation is that production bottlenecks should ease over the coming months and the market should return to more normal conditions,” NAHB Chief Economist Robert Dietz said in a statement.
Perhaps, but The Fed needs to slow down its money printing as well.
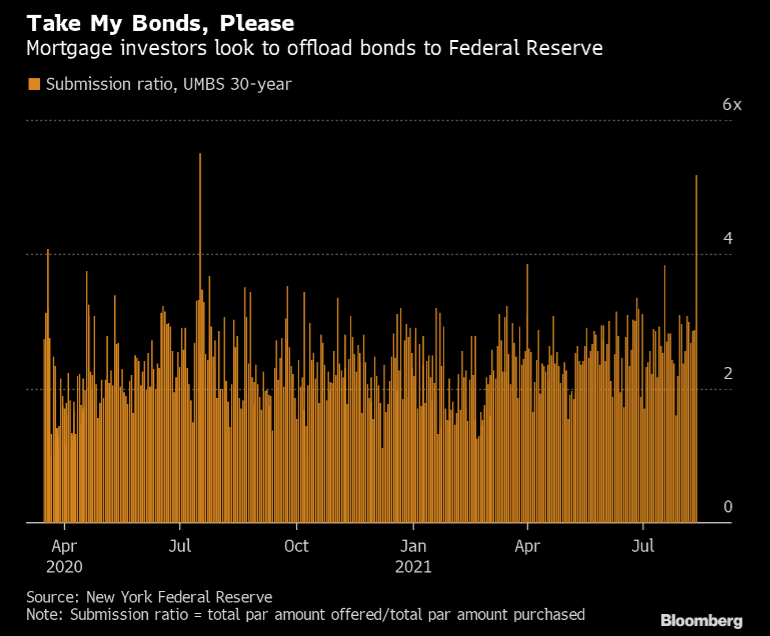
(Bloomberg) — Last week was notable for the tsunami of agency mortgage bonds offered to the Federal Reserve during its routine purchase operations on Friday.
The central bank’s quantitative easing schedule called for it to buy $2.9 billion of 30-year uniform mortgage bonds Friday, and that was nothing outside of its usual pattern. However, mortgage investors flooded the Fed with $15.06 billion of bonds for sale, the largest daily amount offered during a single operation since April 1, 2020.
In terms of how that compares to the total amount purchased, investors offered 5.2 times as much as were eventually taken down by the central bank. That is well above the 2.3 times average for 30-year uniform mortgage bond operations seen during all of this round of quantitative easing, and the second-highest overall. The highest submission ratio was the 5.5 times seen on July 16, 2020.
There are a number of reasons this could have happened. Investors may have wished to lighten their positions before the summer doldrums of late August, when many desks are lightly staffed due to vacations. Also, tight sector valuations or concerns about a sooner-than-expected taper may have played a part.
While this may simply be a one-off event and no reason for concern, it is certainly something to keep an eye on in case it heralds a change in investor sentiment.
In related news, the Treasury’s overnight reverse repos purchases remain about $1 trillion.
There are a variety of measures of an asset bubble. And each one points to an unsustainable bubble in the stock market.
Let’s start with the Buffett Indicator. The ratio of Total Market Capitalization of all US stocks (WCAUUS ) to total nominal GDP of the United States (GDP CUR$ ).
There is also the GLOBAL Buffett ratio produced by Holger Zschäpitz. Global market cap now equal to 139% of global GDP, way above Buffett’s 100% bubble threshold.
Shiller’s Cyclically-adjusted Price-earnings ratio? Still climbing and resembles the Dot.com bubble of 2000.
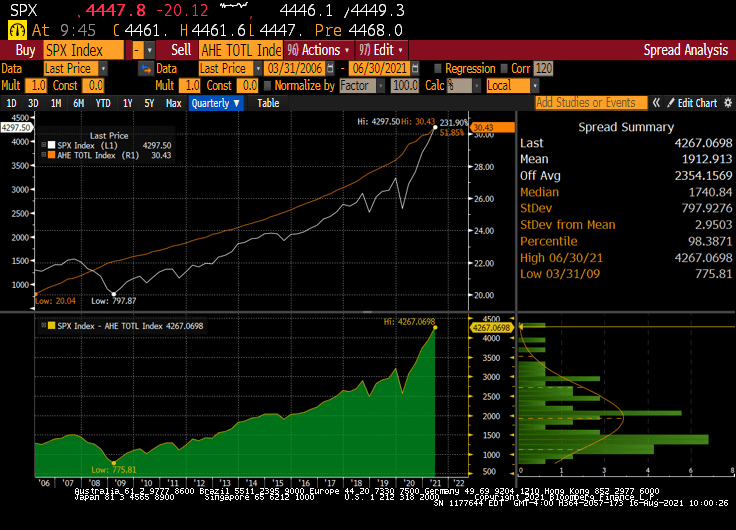
How about gold to Average Hourly Earnings (similar to the Bichler and Nitzan “Power” measure. The spread (bottom chart) sees the S&P 500 index soaring away from average hourly earnings.
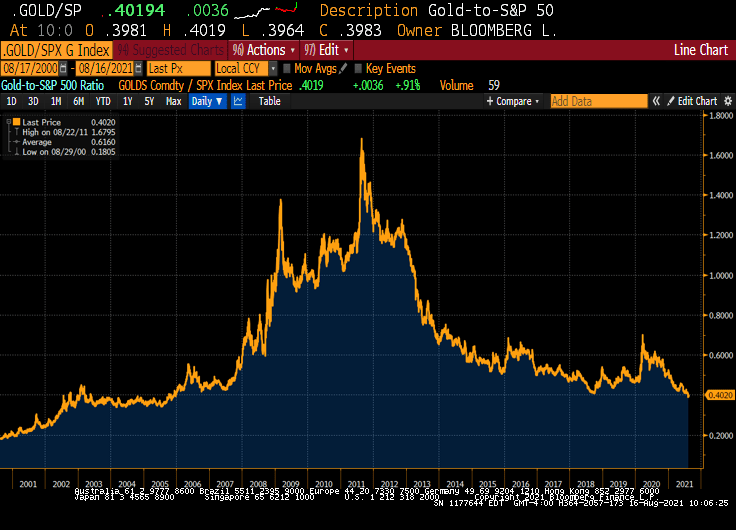
We also have the Gold to SPX ratio that is now back to pre-financial crisis levels.
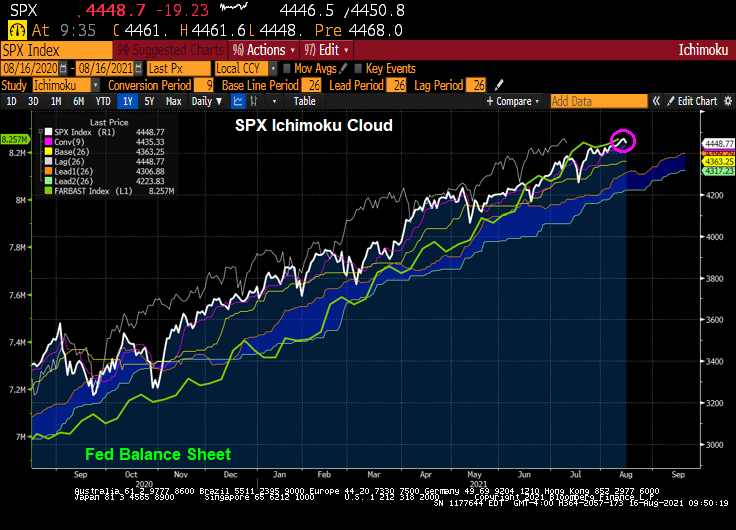
How about the Ichimoku cloud, where the SPX is currently ABOVE the cloud?
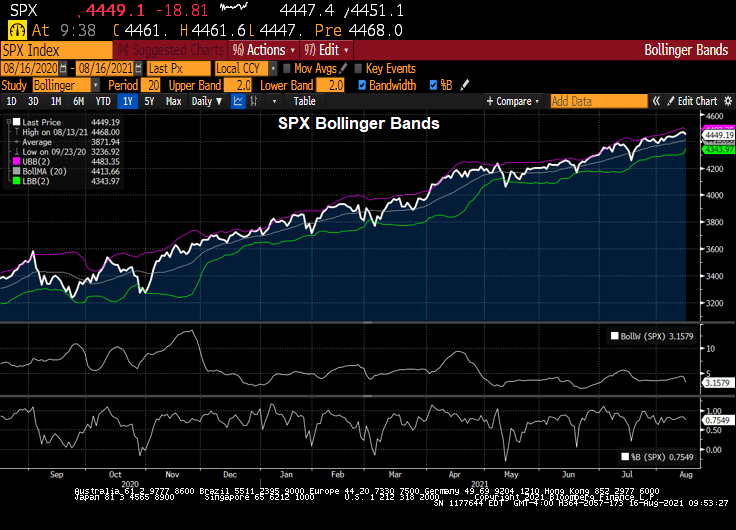
SPX and Bollinger Bands? The SPX index is close to the upper band.
How about The Hindenburg Omen, a technical indicator that was designed to signal the increased probability of a stock market crash. It compares the percentage of new 52-week highs and new 52-week lows in stock prices to a predetermined reference percentage that is supposed to predict the increasing likelihood of a market crash.
So it looks like a have a bubble in the stock market.
Fed Chair Jerome Powell sees the ghost of the Dot.com bubble.
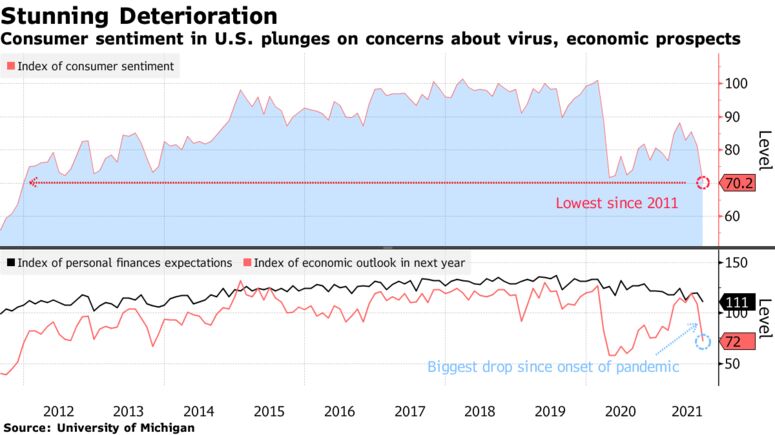
U.S. consumer sentiment fell in early August to the lowest level in nearly a decade as Americans grew more concerned about the economy’s prospects, inflation and the recent surge in coronavirus cases.
The University of Michigan’s preliminary sentiment index fell by 11 points to 70.2, the lowest since December 2011, data released Friday showed. The figure fell well short of all estimates in a Bloomberg survey of economists.
The slump in confidence risks a more pronounced slowing in economic growth in coming months should consumers rein in spending. The recent deterioration in sentiment highlights how rising prices and concerns about the delta variant’s potential impact on the economy are weighing on Americans.
“Consumers have correctly reasoned that the economy’s performance will be diminished over the next several months, but the extraordinary surge in negative economic assessments also reflects an emotional response, mainly from dashed hopes that the pandemic would soon end,” Richard Curtin, director of the survey, said in the report.
The expectations gauge plummeted almost 14 points to 65.2, the lowest since October 2013. A measure of consumers’ outlook for the economy over the coming year soured, falling the most since the onset of the pandemic in March 2020.
Only 36% of respondents expect a decline in the jobless rate, down from 52% the prior month, despite record job openings. Consumers also became decidedly downbeat about their income prospects. The gauge of expected personal finances fell to a seven-year low.
Rising prices are having a clear impact on Americans’ budgets, particularly among those with lower or fixed incomes. Nearly a third of those aged 65 or older complained that inflation had lowered their living standards, as did about a fourth of those with incomes in the bottom third or with a high school education or less.
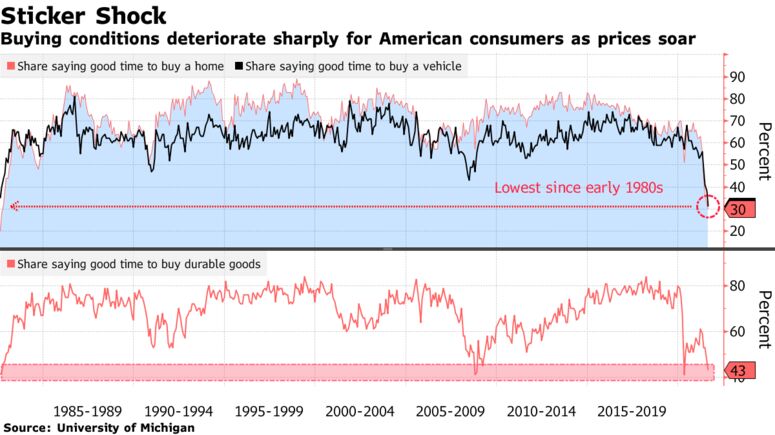
The Michigan report showed buying conditions deteriorated to the lowest since April of last year.
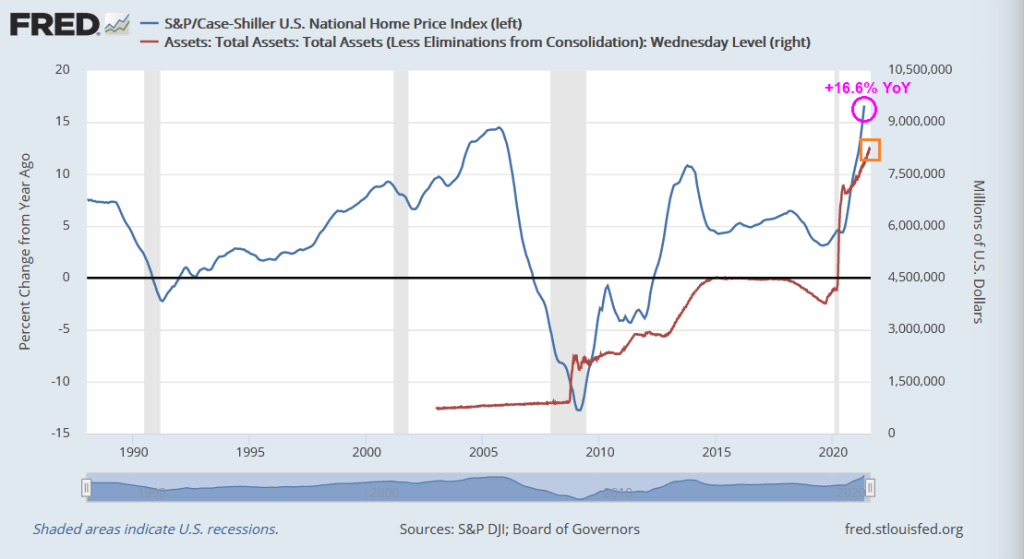
Yes, only 30% of respondents felt that it was a good time to buy a home. Particularly since home prices are rising at a 16.6% YoY pace, faster even than the peak of the infamous home price bubble of 2005. But this time, The Fed is blowing the bubble, not easy mortgage credit like in 2005.
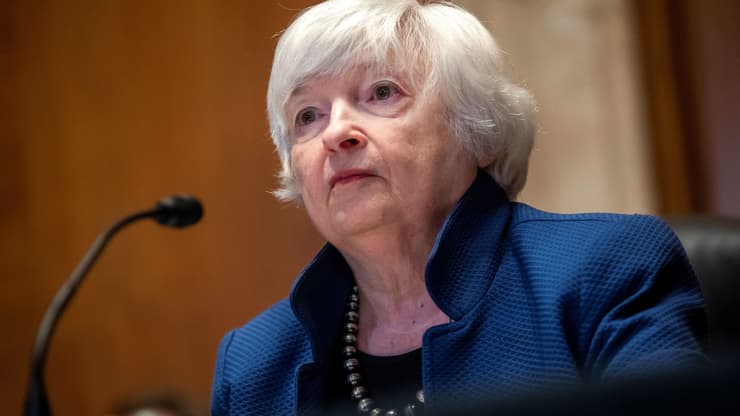
Apparently, Treasury Secretary Janet Yellen does not inspire confidence in consumers.


You must be logged in to post a comment.