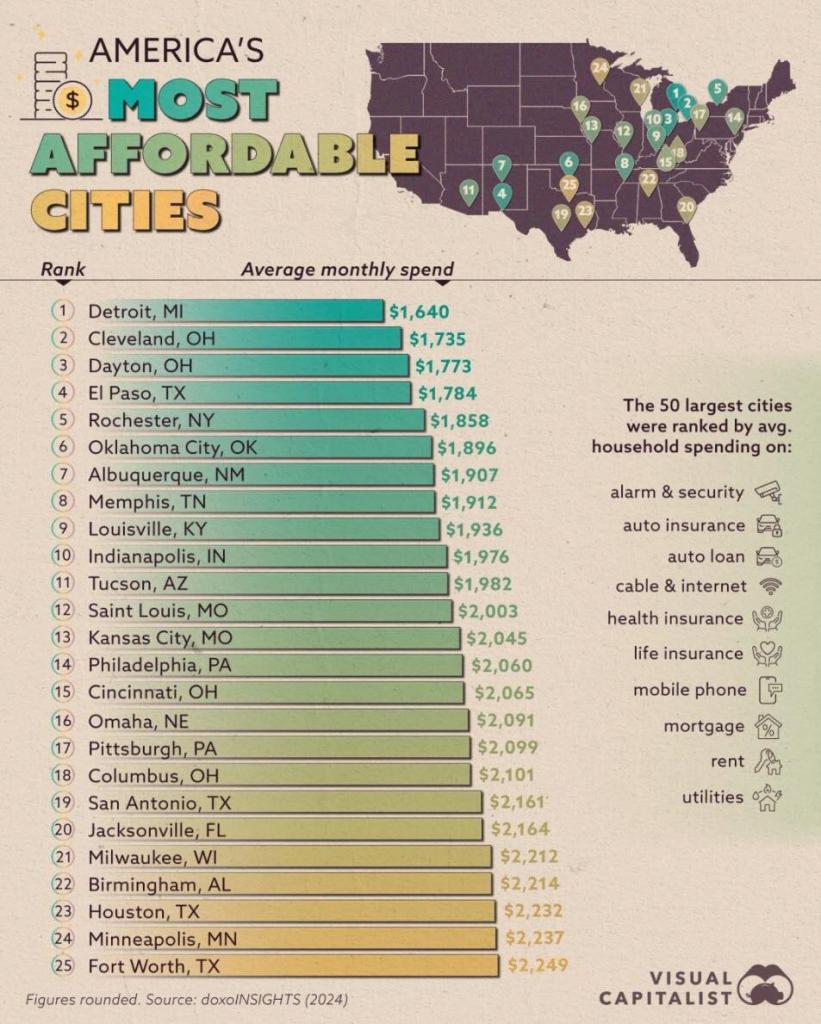
The Visual Capitalist calls most unaffordable cities as least affordable. San Jose California and New York City are the two most unaffordable cities in the USA. According to household spending.
Fortunately, I live in Columbus Ohio. the 18th most affordable city in the USA.
Much of the difference amongst cities is land use and construction restraints. And booming/dying local economies.
As a sad reminder about the last four years, Pete Buttigieg will leave his post as Transportation Secretary having spent $7.5 BILLION to build 8 EV charging stations.
The US taxpayer has suffered a double whammy under The Federal government. First, thanks to the Federal Reserve, the purchasing power of the US Dollar has fallen 97% since the creation of The Federal Reserve in 1913 (under Woody Wilson).
The second leg of the double whammy is the staggering $36 TRILLION is public debt, up from $321 million in 1966. That is a remarkable increase, most of it happening under Obama/Biden then Biden/Harris or 188% since Biden/Harris. Yes, Trump is sanwiched in between Obama and Biden for a scant 4 years.
While we love to blame Presidents, it is really the fault of Congress since The House controls the budget. And The Federal Reserve.
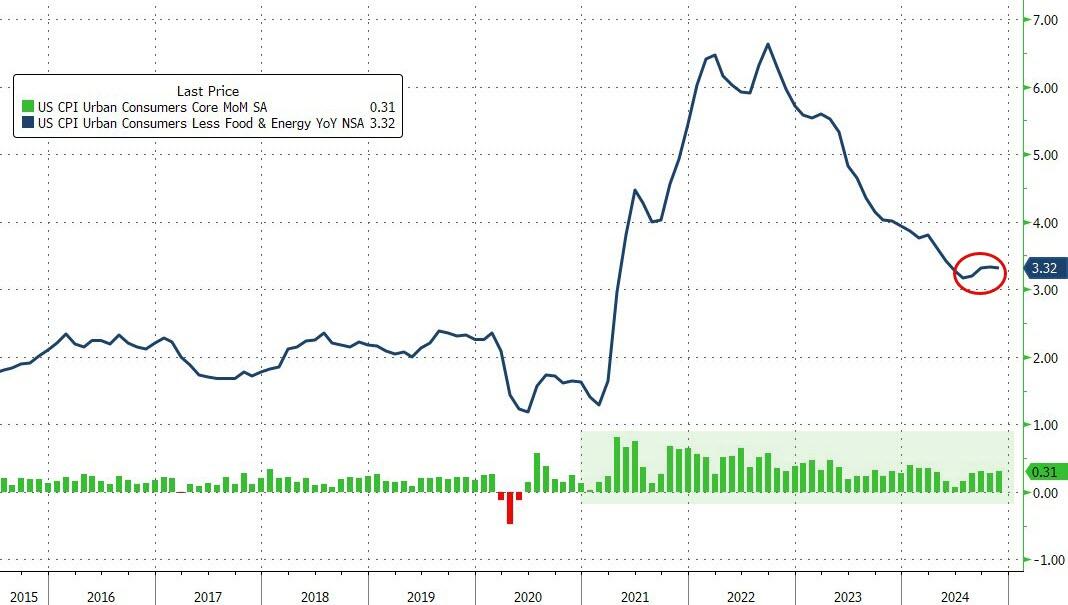
October STICKY core inflation is still up 4% YoY (year-over-year)
Core CPI rose 0.3% MoM (as expected) which pushed it up 3.3% YoY (not even close to the 2% mandate)…
Source: Bloomberg
There has not been a single monthly decrease in core consumer prices since Biden too office.
dddd
Between The Fed’s insane monetary policy and Biden/Harris insane fiscal policies, we are living in a world where Ray Bradbury’s novel Fahrenheit 451 becomes a reality. Instead of books burning, it is the US Dollar burning.
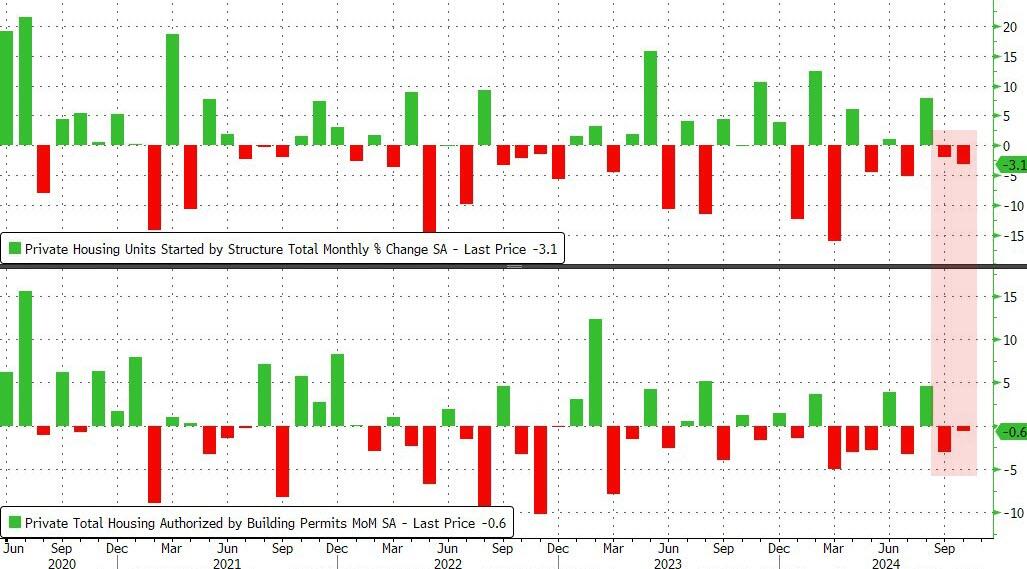
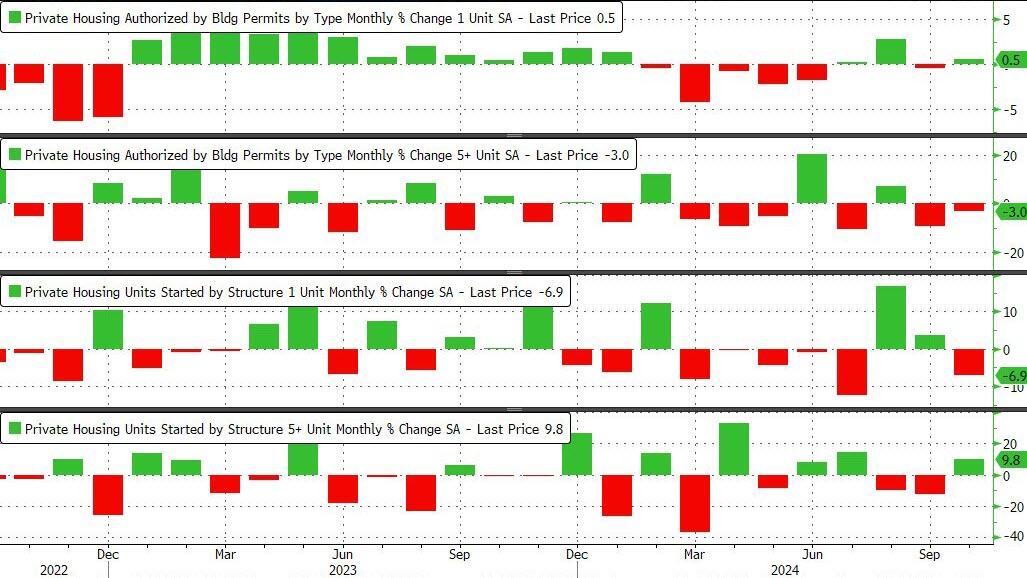
As Biden/Harris approve of Ukraine launching missiles against Russia risking nuclear war, we are witnessing a slow down in the US economy. This time, housing starts and permits.
US Housing Starts and Building Permits disappointed in October with the former dropping 3.1% MoM (-1.5% exp) and -0.6% MoM (+0.7% exp) respectively. This is the second straight month of declines for both measures of housing activity.
Source: Bloomberg
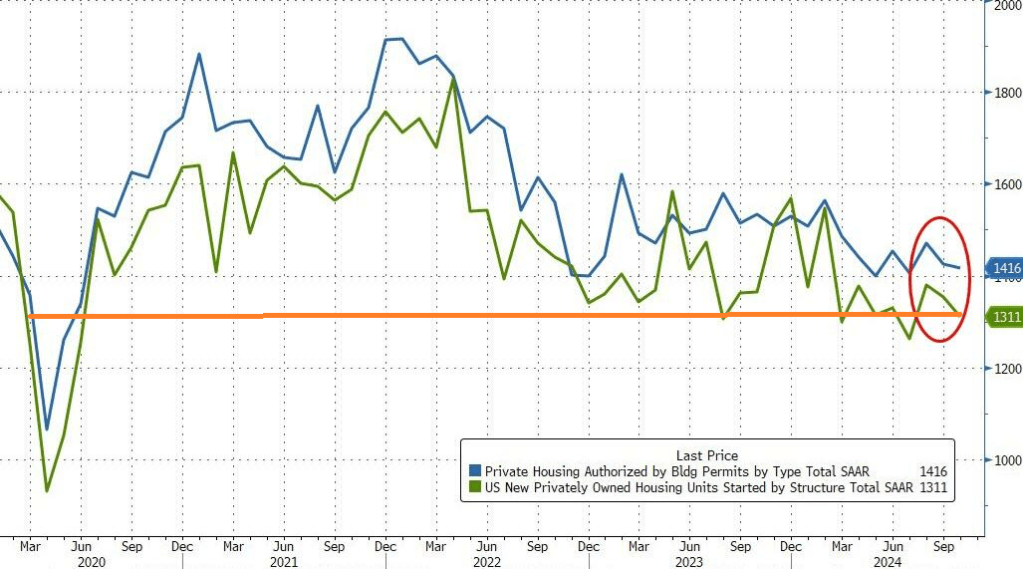
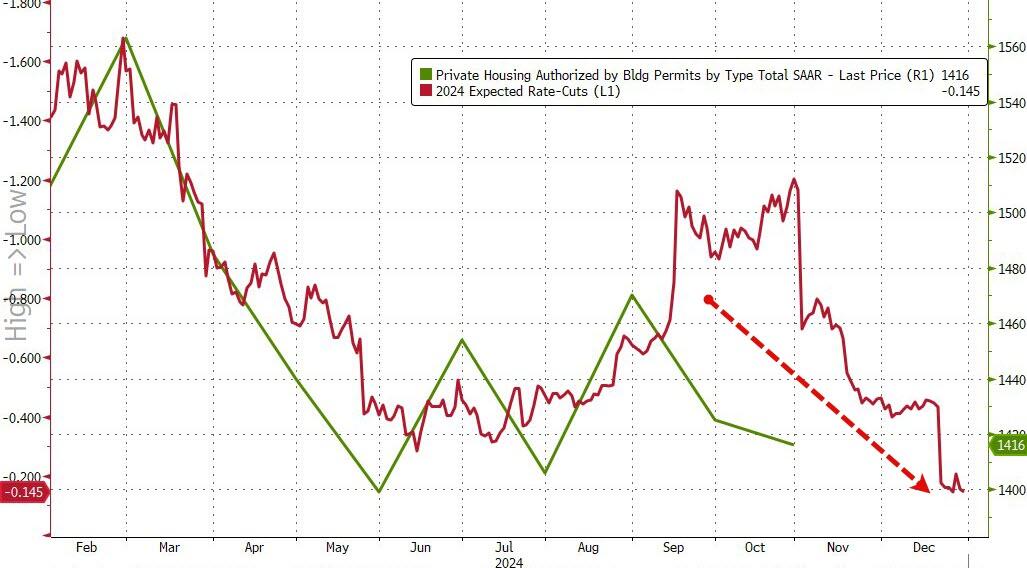
That pulled the SAAR totals down to four month lows – hovering just above COVID lockdown levels…
Source: Bloomberg
Under the hood, it was very mixed with Single-family permits rising and multifamily permits dropped. Single-family Starts plunged while multi-family Starts jumped…
Source: Bloomberg
As rate-cut expectations have fallen, so have homebuilders actions it seems…
Source: Bloomberg
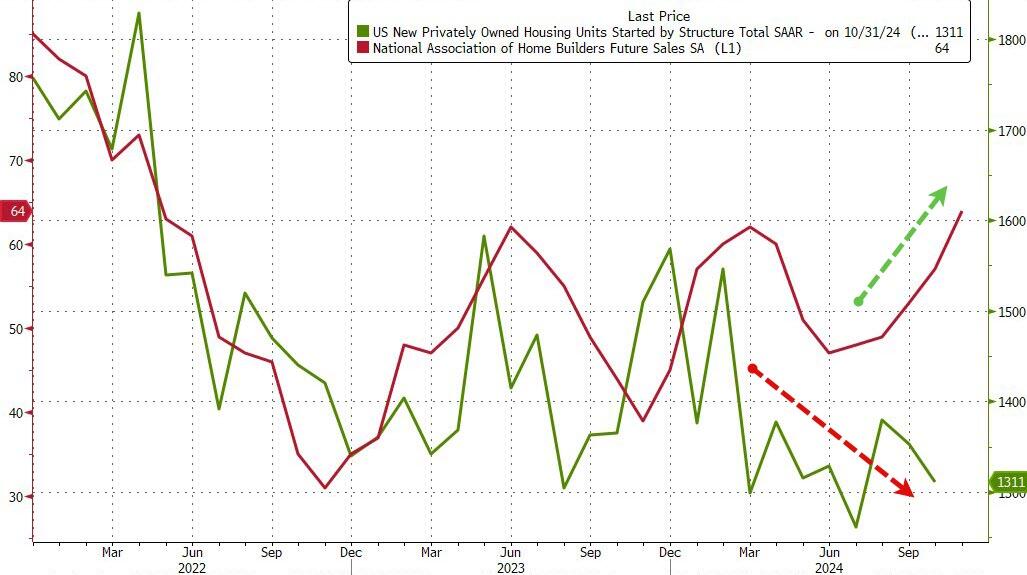
But homebuilder ‘hope’ remains high…
Source: Bloomberg
With Trump back in charge, how much will Powell and his pals really want to cut rates now?
A recent paper by Michael Stegman, Ted Tozer and Richard Green reminds me of The Who’s song “Won’t Get Fooled Again.” Except that apparently Stegman, Tozer and Green did get fooled again.
I remember testifying in the House of Representatives in Washington DC on the financial crisis and housing markets. I pointed out that low down payment mortgages lending to households with low credit scores was very dangerous. I had the data and presented it to the House committee on financial services.
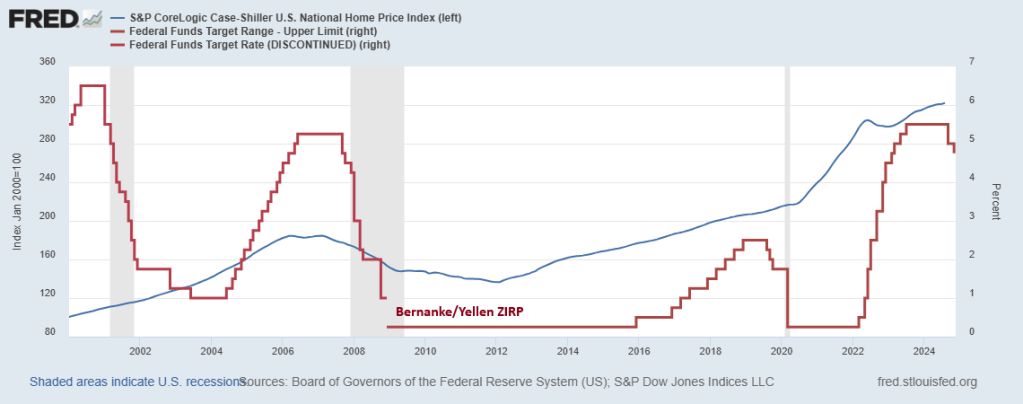
The problem with Stegman et al’s paper is that it ignores The Federal Reserve and Federal spending. After the financial crisis of 2008 when housing prices declined (especially in bubble states like Arizona, Nevada and Florida), Berananke and Yellen adopted a zero interest rate policy that resulted in housing prices rising again. Then we have Powell’s lowering of rates to near-zero following the Covid outbreak and the insane level of Federal spending that ensued helping to drive housing prices to dangerous bubble levels. Making first time homeowner purchases almost impossible.
So, like the 2000s, the pursuit of homeownership will lead to insance policy proposals. If nothing else, the Stegman et al proposal will lead to MORE inflation in housing prices and set the stage for a housing bubble burst of epic proportions.
Apparently, Stegman et al DID get fooled again. Or they just don’t care.
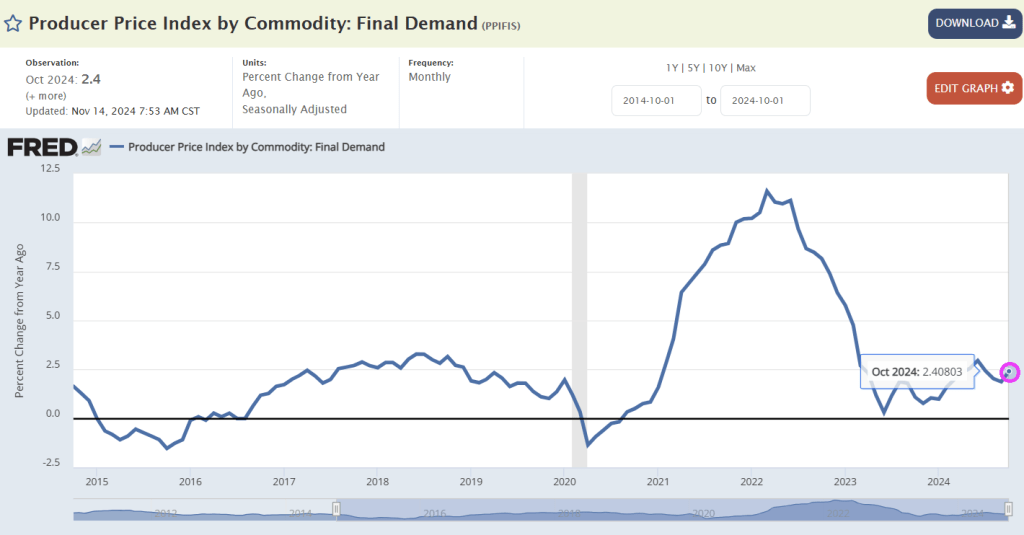
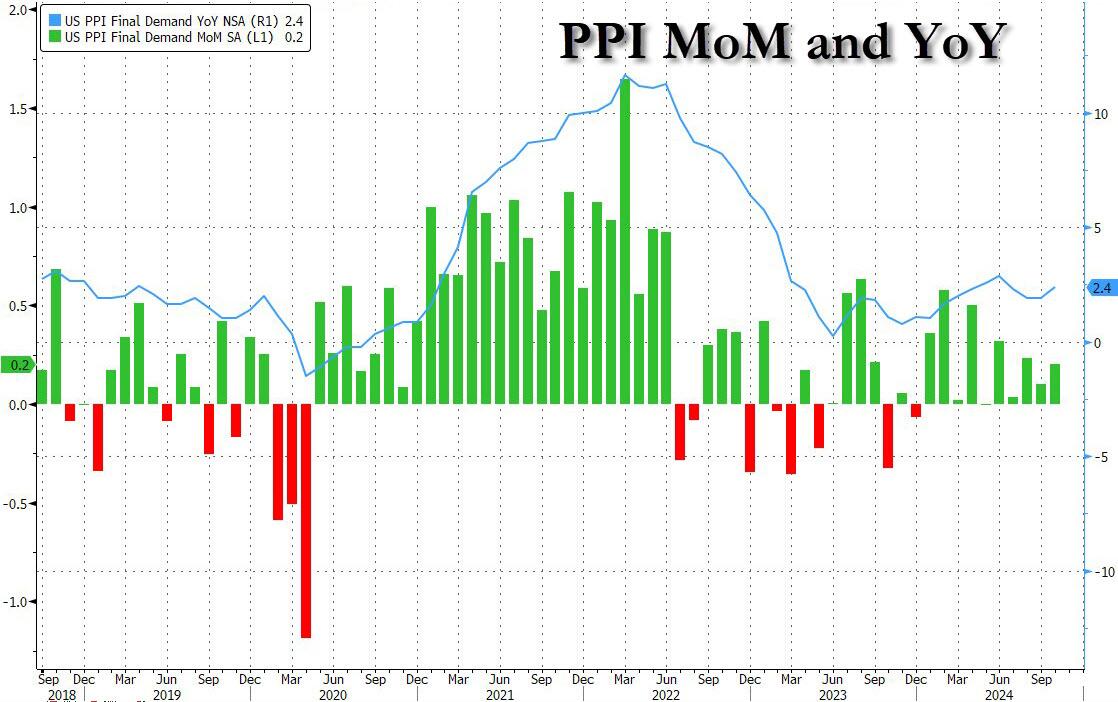
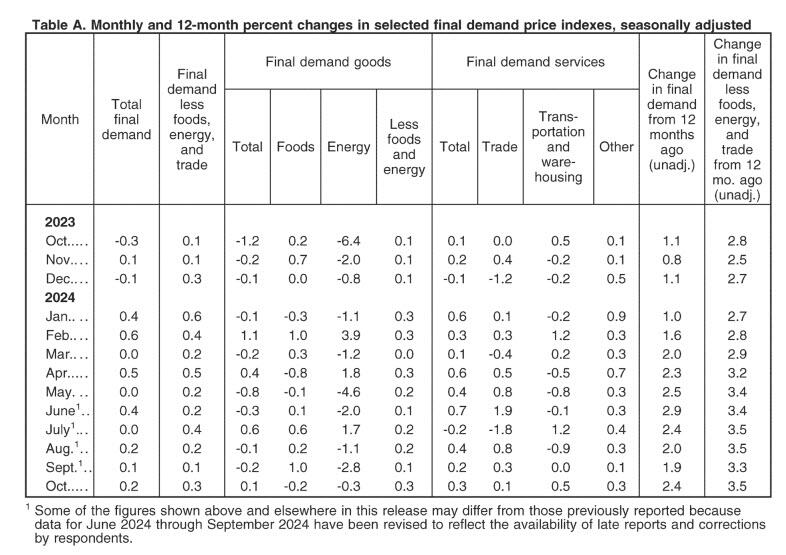
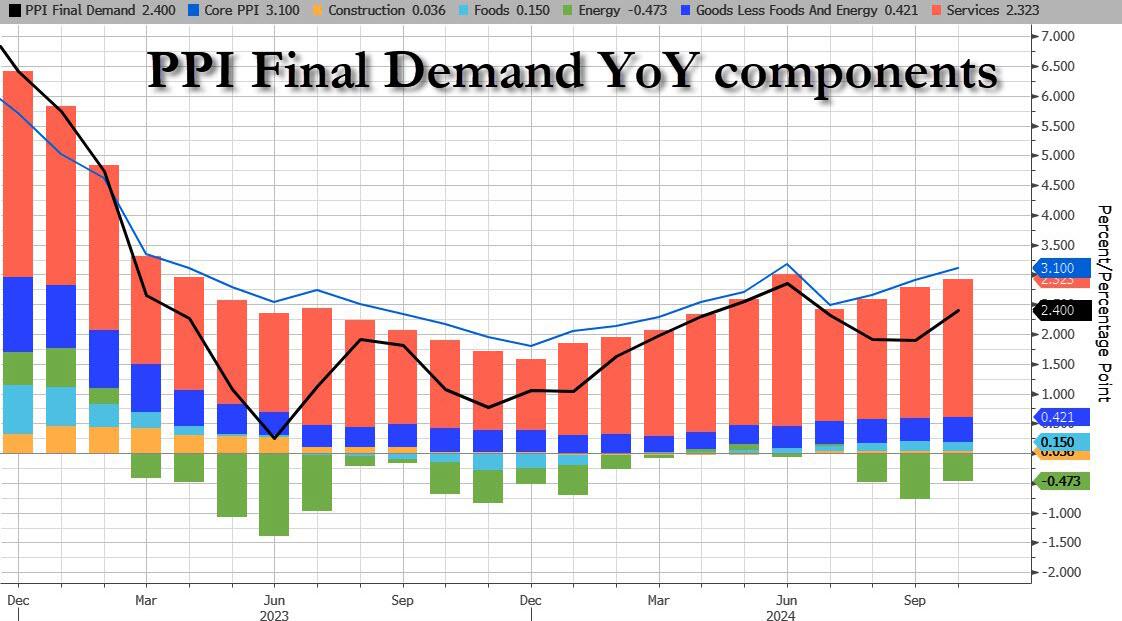
After yesterday’s in line – but really cooler than whispered – CPI which restored hope in a December rate cut, all eyes are on this morning’s PPI print to boost dovish hopes that the Fed’s easing cycle would remain on track. It was not meant to be, however, as the PPI came in hotter than expected across the board on both a monthly and annual basis.
Starting at the top, headline PPI rose 0.2% MoM (in line with the +0.2% expected) but September was revised higher from 0.0% to 0.1%; meanwhile on an annual basis, headline PPI rose 2.4%, higher than the 2.3% expected, with the last month also revised higher from 1.8% to 1.9%.
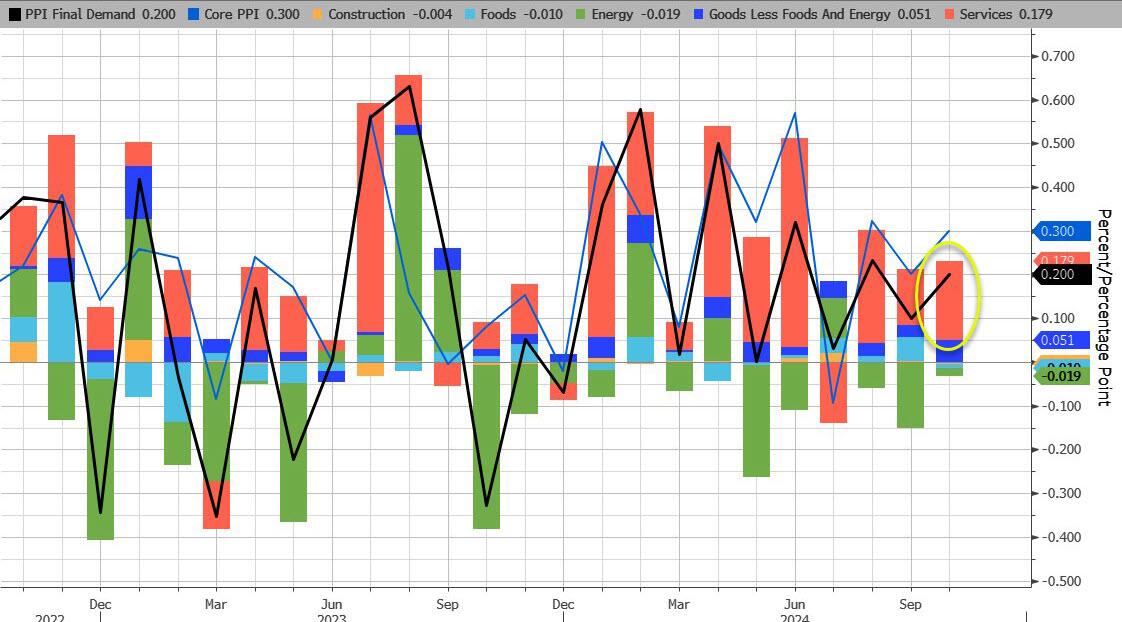
Unlike last month when a drop in energy prices weighed heavily on the headline PPI number, this month energy subtracted just 0.02% from the final print, the lowest detraction since July. Meanwhile, Services added a hefty 0.179% to the bottom line number.
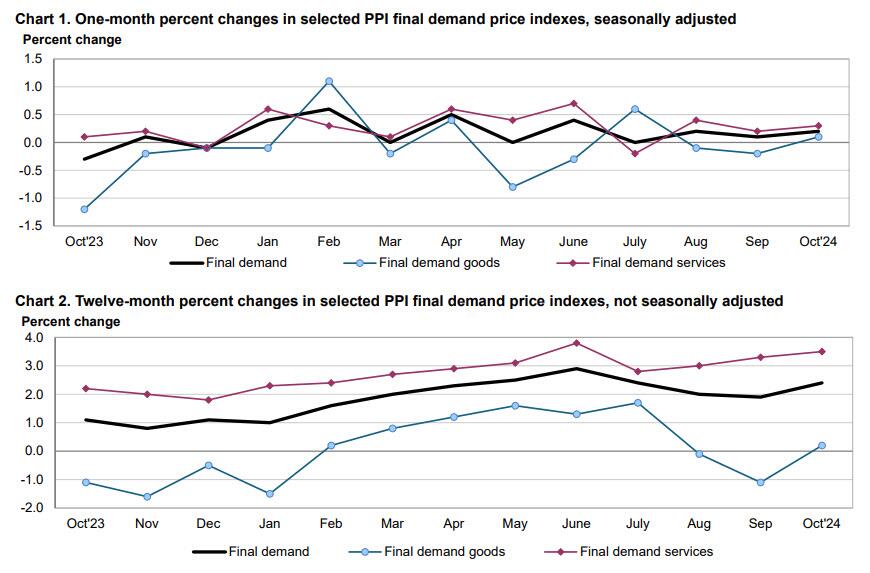
Indeed, according to the BLS, most of the rise in final demand prices can be traced to a 0.% advance in the index for final demand services. Prices for final demand goods inched up 0.1%, the first increase in the index since July.
Taking a closer look at the components:
Final demand services: The index for final demand services increased 0.3 percent in October after rising 0.2 percent in September. Over three-fourths of the broad-based advance in October is attributable to prices for final demand services less trade, transportation, and warehousing, which moved up 0.3 percent. The indexes for final demand transportation and warehousing services and for final demand trade services also increased, 0.5 percent and 0.1 percent, respectively. (Trade indexes measure changes in margins received by wholesalers and retailers.)
Product detail:
Over one-third of the rise in the index for final demand services can be traced to prices for portfolio management, which advanced 3.6 percent. The indexes for machinery and vehicle wholesaling; airline passenger services; computer hardware, software, and supplies retailing; outpatient care (partial); and cable and satellite subscriber services also moved higher.
In contrast, margins for apparel, footwear, and accessories retailing fell 3.7 percent. Prices for securities brokerage, dealing, investment advice, and related services and for truck transportation of freight also declined.
Final demand goods: The index for final demand goods inched up 0.1 percent in October following two consecutive decreases. The advance can be traced to a 0.3-percent rise in prices for final demand goods less foods and energy. Conversely, the indexes for final demand energy and for final demand foods declined 0.3 percent and 0.2 percent, respectively.
Product detail:
An 8.4-percent increase in the index for carbon steel scrap was a major factor in the advance in prices for final demand goods. The indexes for meats, diesel fuel, fresh and dry vegetables, and oilseeds also moved higher.
In contrast, prices for liquefied petroleum gas fell 18.1 percent. The indexes for chicken eggs, processed poultry, and ethanol also decreased.
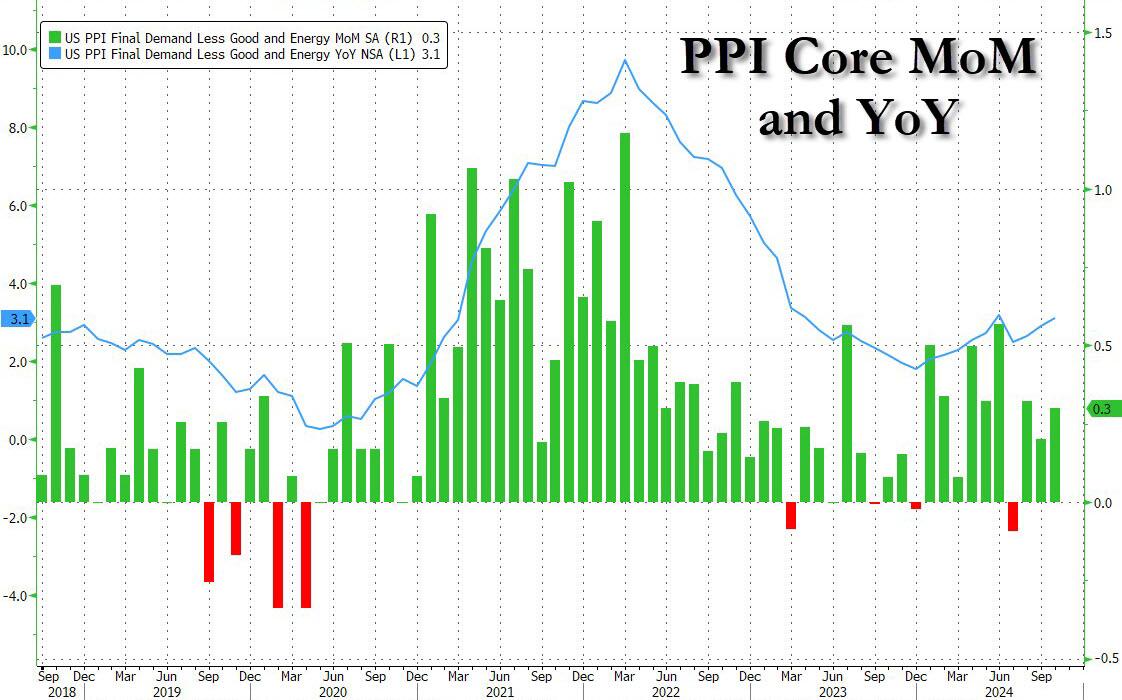
Even more problematic for the doves, however, is that core PPI jumped to +3.1% YoY (hotter than the 3.0% exp) with the prior month revised higher to 2.9% from 2.8%. This was the second hottest print going back to March 2023 with just the June outlier surge hotter than October…
… as sticky Services costs continue to rise.
The hotter than expected PPIs have pushed yields and the dollar higher, even as the market waits to see the details of what impact today’s numbers will have on the Fed’s preferred core PCE metric – according to UBS key PPI components to PCE look hot – although Bloomberg noted a big jump in air passenger services (3.2%), which suggests some upside risks (i.e., 0.3% core PCE).
The most notable takeaway from the data appears to be the increase in final demand for services in October, which is similar to the factors that increased CPI yesterday — shelter, food and energy, which are components the Fed cannot control with interest rates.
Bottom line: this is a long way from the Fed’s mandated 2%, and it’s moving in the wrong direction, something which has not been lost on the market, where Treasury curves are flattening after the data, which suggests traders are wavering over the prospects of a December rate cut. That has yet to be reflected in rates markets — bets have been trimmed but marginally, not enough to really change the swaps market outlook as of now. According to BBG’s Vince Cignarella, sizeable block trades are going through Treasuries, mostly in the five-year tenor and some ten-year tenors, which looks like positioning for higher yields and flatter curves.
There is one way out of the inflation trap. And it’s drill, baby, drill!
For the 53rd straight month, core consumer prices rose on a MoM basis in October with the YoY pace re-accelerating to +3.33%.
The shelter index increased 4.9 percent over the last year, accounting for over 65 percent of the total 12-month increase in the all items less food and energy index.
Thank goodness Harris can’t try to impliment her ridiculous plans to boost housing!
Glad to see Vivek Ramaswamy and Elon Musk (the NEW Two Bobs from Office Space) cleaning up the mess in Washington DC.
Congress went wild spending on Covid relief and related wasteful spending. Notice that the impetus for job openings (spending) occurred before “Angry Joe” Biden and Commie-la Harris were sworn in. So, the job creation claims by Biden/Harris were put into motion before they assumed office.
The lag in job openings growth after the surge in spending is clearly visible in the following chart, as is the BURNOUT in job openings growth after Covid spending burned out.
Harris is promising explosive spending if elected. And she is promising MORE regulations! And the regulatory burden will grow.
SF Woman. That is my name for Kamala Harris, the ultimate political changeling, taking full credit for the economy, then trying to distance herself from Biden. As the US economy continues to contract.
Weakness in factory new orders continued to be a major drag on the US LEI in September as the global manufacturing slump persists. Additionally, the yield curve remained inverted, building permits declined, and consumers’ outlook for future business conditions was tepid. Gains among other LEI components were not significant enough to offset weakness among the four gauges mentioned above. Overall, the LEI continued to signal uncertainty for economic activity ahead.
*Changeling, in European folklore, a deformed or imbecilic offspring of fairies or elves substituted by them surreptitiously for a human infant. According to legend, the abducted human children are given to the devil or used to strengthen fairy stock.


You must be logged in to post a comment.