The Fed Is the Main Inflation Culprit (But Federal Government’s Spending Spree Was The Icing On The Inflation Cake)

There was an interesting op-ed in The Wall Street Journal entitled “The Fed Is the Main Inflation Culprit”.

If price stability is squandered, financial stability is put at risk. If financial stability is lost, the economy is imperiled and the social contract is threatened.

During the past several quarters, U.S. inflation has surged—now running about triple the Federal Reserve’s 2% target. The surge in prices is unlikely to reverse on its own. The longer that prices are unstable, the greater the challenge to the conduct of macroeconomic policy. The last thing the country needs is its third major economic upheaval in a decade and a half.

The consequences of inflation—and the attendant risks—have long been understood. In 1898 economist Knut Wicksell explained: “Changes in the general level of prices have always excited great interest. Obscure in origin, they exert a profound and far-reaching influence on the whole economic and social life of a country.”

I agree with the op-ed, but as Paul Harvey liked to say, “And now for the rest of the story.”

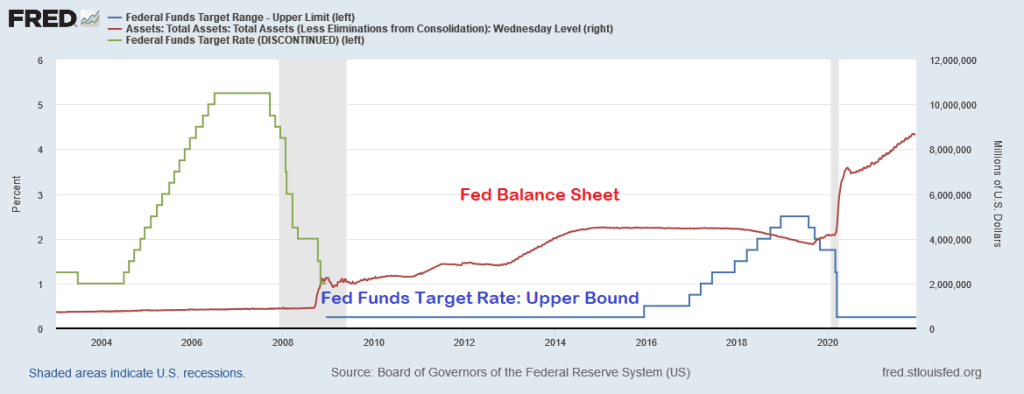
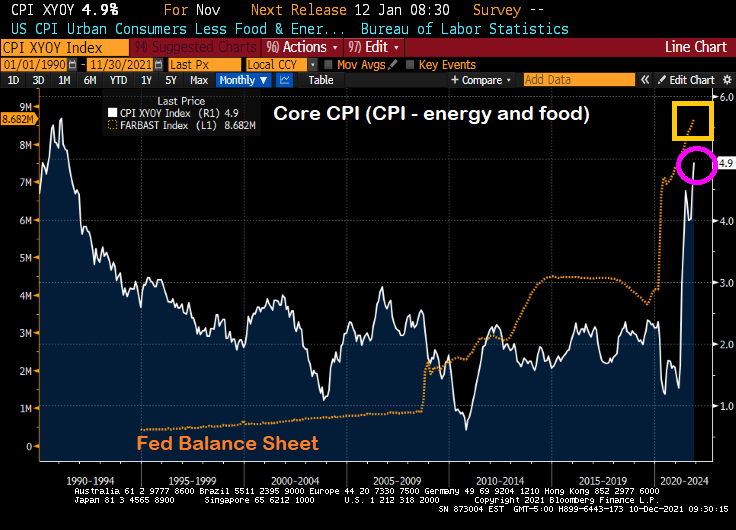
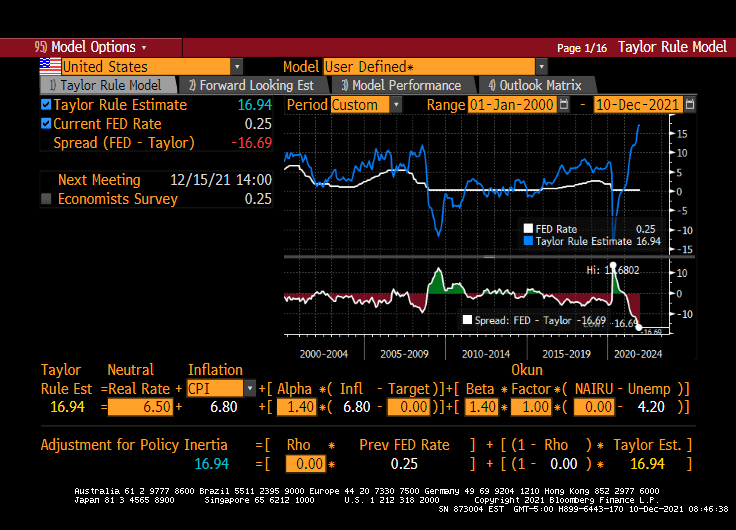
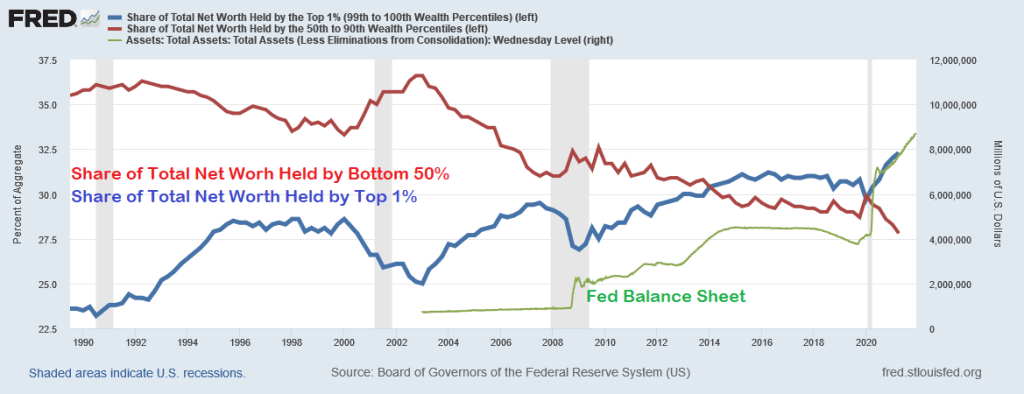
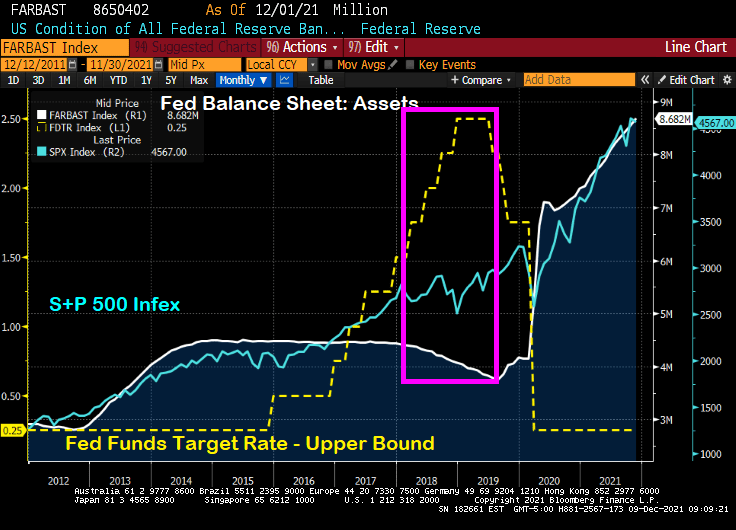
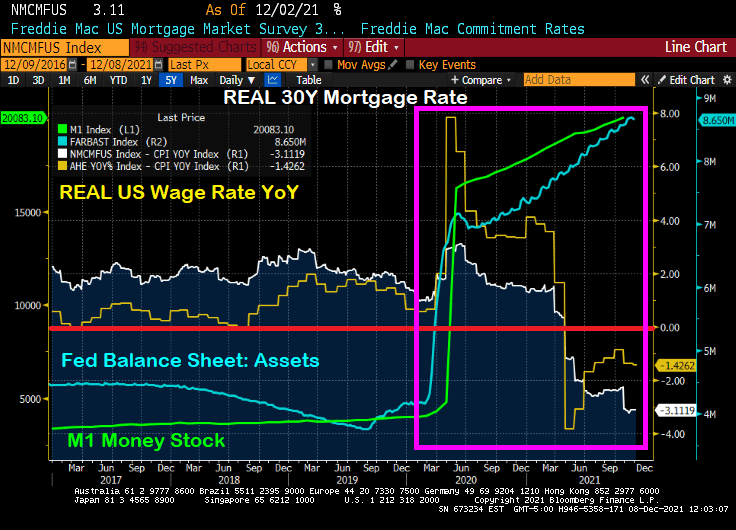
The Federal Reserve is only half of The Federal government “Stimulypto.” Starting in late 2008, The Fed crashed their target rate to 25 basis points and began their quantitative easing (QE) program where The Fed purchased Treasuries and Agency Mortgage-backed Securities (MBS) amongst other assets. Notice in the chart below that QE was adjusted, but never went away and The Fed’s target rate only was increased once before Trump’s election as President, then raised eight times then decreased five times. And no rate increases under Biden. So The Fed scorecard is Obama/Biden: 1 rate increase. Trump: 13 rate changes. And The Fed’s balance sheet has gone bananas since the COVID outbreak.

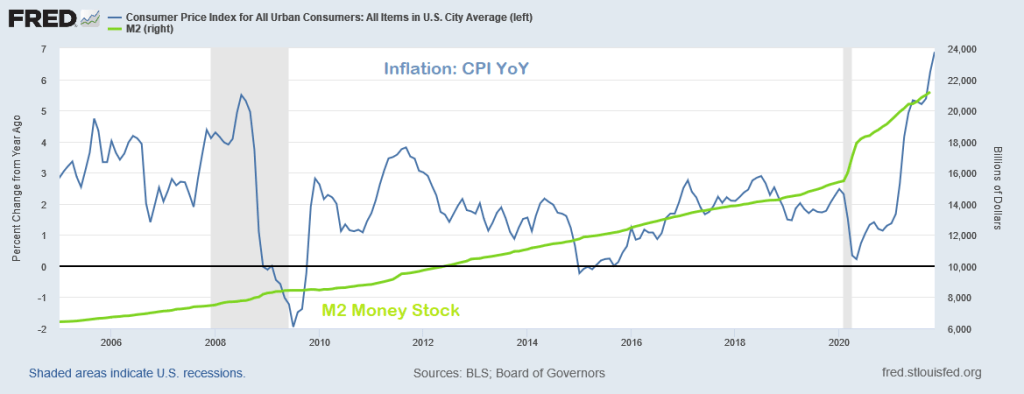
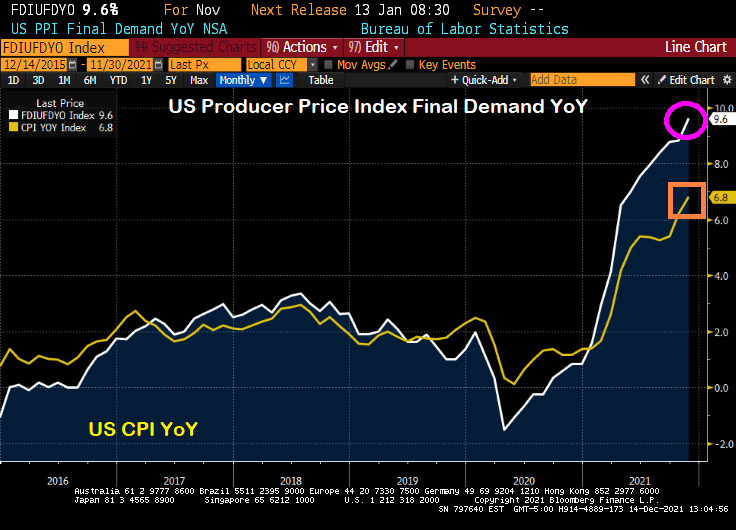
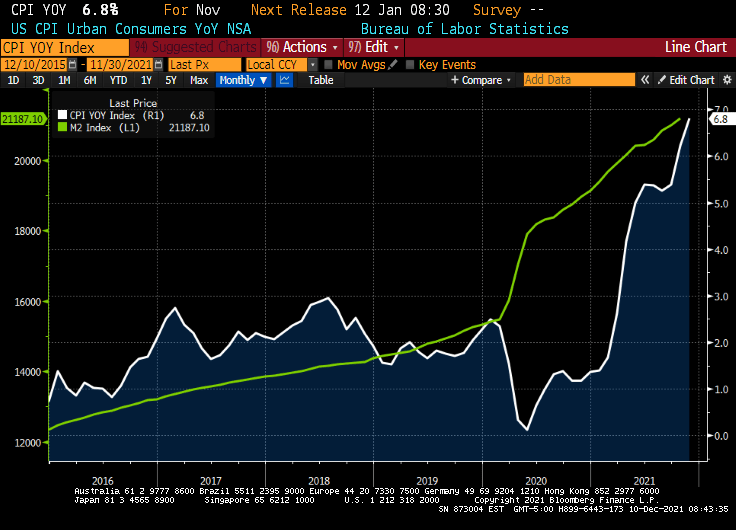
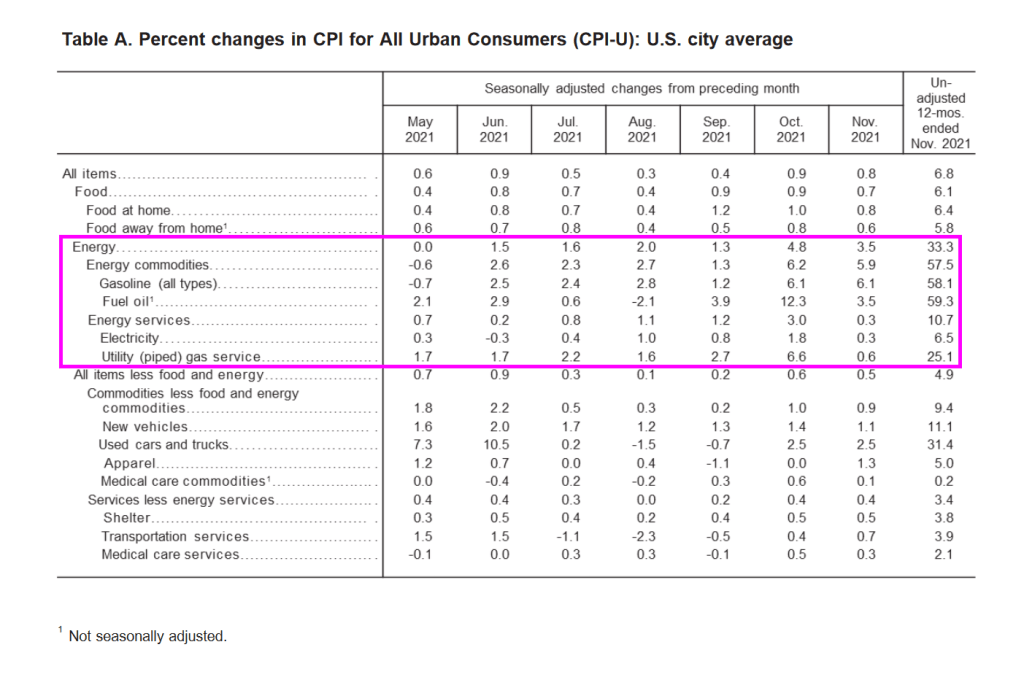
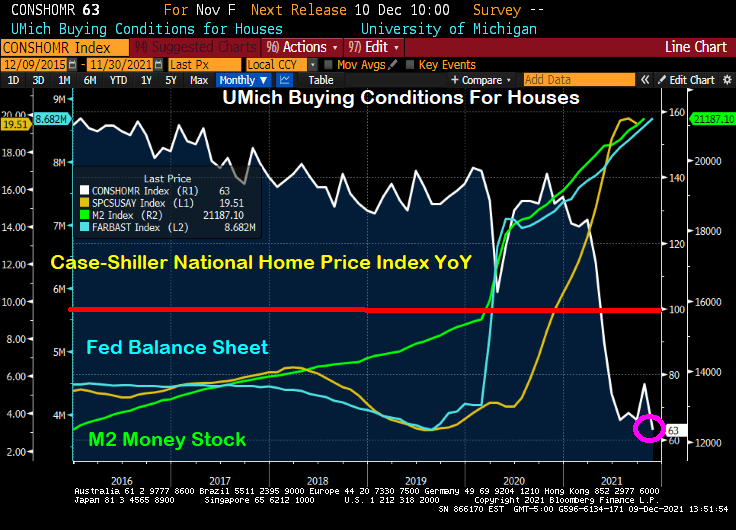
Inflation, as measured by the Consumer Price Index (CPI) didn’t really take-off until March 2021 as a result of STIMULYPTO (excessive monetary stimulus + Federal government spending).

Here is the Federal government spending surge that helped generate the highest inflation in a generation.

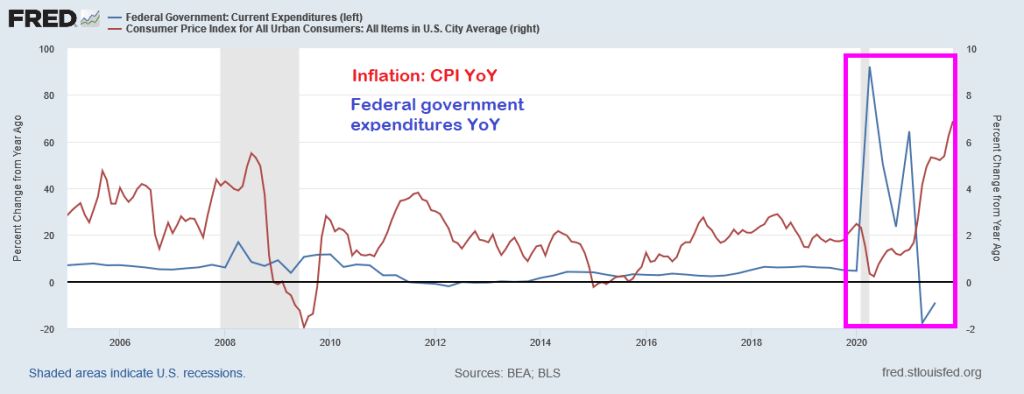
So while the op-ed author blames inflation solely on The Federal Reserve, The Fed was unable to achieve its inflation goal for much of the post-financial crisis period. It was the double whammy of Fed monetary stimulus + Federal government stimulus (spending) that pushed inflation to 6.8%.

Following Paul Harvey’s “The Rest of the Story,” I choose baseball player Whammy Douglas to represent the double whammy of Fed + Fed government stimulus to produce inflation. THAT is the rest of the story.

Throw in the Biden Administration’s war on fossil fuels (driving up energy costs by over 50%) and we have a TRIPLE WHAMMY!!

The WSJ op-ed author was focused only blaming The Fed. Sorry, it was a Double Whammy.

U.S. Producer Prices Jump in Biggest Annual Gain on Record (9.6% YoY Versus CPI Of 6.8%)

Yes, we have trouble in river city with a capital T than rhymes with P and that stands for Producer Prices.

Prices paid to U.S. producers posted a record annual increase of almost 10% in November, a surge that will sustain a pipeline of inflationary pressures well into 2022.

The producer price index for final demand increased 9.6% from a year earlier and 0.8% from the prior month, Labor Department data showed Tuesday. Both advances topped economists’ forecasts.  

Even more interesting (or frightening) is that PPI Final Demand YoY is soaring faster than CPI YoY. If CPI catches up to PPI, then we have serious trouble.

With inflation seemingly growing out of control, Powell and Biden should sing “76 Trillion Dollars” which will be the US national debt after Biden and Congress get done with their spending splurge.

Jerome Powell directing The Inflation Orchestra.

Psst! US Inflation Is REALLY >11% YoY (Not The Stated 6.9% YoY)

Earlier today I wrote about the horrible November Consumer Price Index (CPI) print of 6.9% YoY.

But that 6.9% YoY is very misleading because of the strange way the Bureau of Labor Statistics measures the largest asset in most households’ expenditures: housing.

The BLS measures inflation in housing using the Shelter measurement. Which was only 3.88% YoY. The problem is that the Case-Shiller National Home Price Index was 19.52% in its last reading. That is quite a discrepancy.

So, if we substitute the Case-Shiller National home price index for the CPI Shelter, we get an inflation rate of greater than 11%.

And with the Zillow Rent for all homes index growing at 11.2%, this feels more like we are being hit over the head with. Or like trying to eat raw oyster stew … when the oyster fight back.

Here is a video of The Federal Reserve and the Biden Administration trying to control inflation.

Real Wage Growth Falls To -1.9% As Inflation Rises To 6.8% In November (Taylor Rule Rate Rises To 16.94% While Fed Remains At 0.25%)

Inflation keeps rising and consumers keep getting hurt. No wonder President Biden’s team sent out a media splash asking them to put a smile on that face and hype the economic recovery.

Real wage growth fell to -1.9% YoY in the latest Consumer Price release. As The Fed keeps its massive foot on the monetary gas pedal.

The overall Consumer Price Index (CPI) rose 6.8% YoY.

The biggest gains in Consumer Prices were for energy with gasoline rising 58.1% YoY. But almost nothing was spared the rod of government policies.

Core inflation (CPI – energy – food) rose to 4.9% YoY, the highest since 1991.

The Taylor Rule, what The Fed Funds Target rate SHOULD be, rose to 16.94%. Versus the current rate of 0.25%. Its as if The Fed Open Market Committee is watching Tik-Tok instead of the economic numbers.

Inflation Near 40-Year High Shocks Americans, Spooks Washington (As Largest Wealth Redistribution In US History Occurs … Towards The 1%)

The U.S. is poised to enter Year Three of the pandemic with both a booming economy and a still-mutating virus. But for Washington and Wall Street, one Covid aftershock is starting to eclipse almost everything else.

Already-hot inflation is forecast to climb even further when November data comes out on Friday, to 6.8%. That would be the highest rate since Jimmy Carter was president in the early 1980s — and in the lifetimes of most Americans.

And the CPI change since last year, according to the Federal Reserve of St Louis FRED is a staggering 16.262%.

And with U.S. Jobless Claims plunge to 52-year low, its about time that The Fed begins removing the humongous monetary stimulus.

After all, largely thanks to Federal Reserve policies, we have seen the greatest wealth redistribution in US history … to the top 1%.

And away from the bottom 50%.

Way to go Federal Reserve!

UMich Buying Conditions For Housing PLUNGES To 63 Due To Outrageous Home Price Growth & Lessons From The Yellen Pivot

Just look at this chart of the University of Michigan Buying Conditions For Houses index. It was positive (meaning above 100) until shortly after COVID struck and The Federal Reserve rode to the rescue. National home price growth was already at 4.57% YoY in March 2020, then ballooned to 19.51% YoY at the last reading.

Here is the same chart with the broader M2 Money stock and The Fed’s Balance sheet. Same results, just not as dramatic as M1.

We will soon find out if The Federal Reserve will announce a rate hike or taper news. They are likely to confirm tapering, particularly if they believe that tapering won’t roil markets. After all, then Fed Chair Janet Yellen and the FOMC decided to let the Fed’s balance sheet taper (white line) while, at the same time, increasing the Fed’s target rate (yellow line). The S&P 500 index rose 9.5% over the taper/rate increase period of 12/29/2017 to 8/30/2019.

But since Stimulypto (2/28/2020 to 11/30/2021), the Fed’s balance sheet doubled+ from $4,158,637 to $8,681,771. And The Fed Funds Target Rate (UB) immediately fell from 1.75% in February 2020 to 0.25% in March 2020 … and has stayed there ever since. The S&P 500 index rose 54.6% over this Stimulypto period.

But The Fed’s upcoming decision on December 15, 2021 may be a Yellen-pivot (taper balance sheet, but raise The Fed Funds Target rate). But, then again, maybe not. The Fed is getting really bad about forward guidance and choose instead to surprise us. Hence, this is why an a-political rule is preferred (such as the Taylor Rule).

Unfortunately, the Taylor Rule infers a Fed Funds Target rate of 15.50% (using CPI YoY running at 6.20% YoY. If The Fed raises their target rate by 25-50 basis points at the December 15th meeting, color me surprised.

So, the Powell Pivot may just be the Yellen Pivot after all.

S&P 500 REAL Earnings Yield At -2.33% While REAL Wage Growth At -1.43% (REAL 30Y Mortgage Rate At -3.11%) “Weird, Wacky Stuff!”

As Parks and Recreation’s Martin Housely said, “Weird, wacky stuff.”

We now have the S&P 500 REAL earnings yield at -2.33%.

REAL US average hourly wage growth is at -1.43% and the REAL 30-year mortgage rate is at -3.11%.

The cause of this weird and wacky economic stuff? How about the surge in M1 Money and The Fed Balance Sheet?

I can almost see Fed Chair Jerome Powell imitating Martin Housely and saying “Weird, wacky stuff” in his testimony before Congress.

Fed Talk,Talk! Mortgage Applications SURGE 56% WoW As Treasury Yields Tank (Purchase Apps Spike 28% WoW)

Despite the “Talk, Talk” from The Federal Reserve about balance sheet taper and rate “normalization,” we actually saw the 10-year Treasury yield fall from 1.6651% on 11/23/2021 to 1.343 on 12/3/2021. While the 30-year mortgage rate only fell from 3.31% to 3.3%, it is the SIGNAL that The Fed is sending that people should refinance their mortgages ASAP.

You can see the rise in mortgage refinancing applications of 56% week-over-week (WoW) (white line) with the drop in the 10-year Treasury yield (blue line) despite the relatively small drop in the Mortgage Bankers Association (MBA) tiny drop in their 30-year mortgage rate index.

Ditto for the MBA mortgage purchase application index. The drop in the US Treasury yield (blue line) resulted in a 28% WoW increase in mortgage purchase applications.

Here is the table of MBA data for the week of 12/03.

Please note that the 10-year Treasury yield have jumped since 12/03 indicating that mortgage application activity for the week of 12/10 will be lower.

Here is the MOVE bond volatility index and the US Treasury 10-yield chart. Can you spot the COVID outbreak??

Here is a video of Fed Chair Jay Powell doing “Talk, talk” about tapering.

US Unit Labor Costs SOAR 9.60% QoQ As Labor Productivity DECLINES 5.20% QoQ (Worst Since 1960)

If this what the Biden Administration had in mind? Soaring labor costs at the same time that labor productivity is falling to its lowest level since 1960?

Powell and the Gang’s monetary approach doesn’t seem to be working for the labor market …

But is working extremely well for asset prices.

Wall Street parties while Main Street suffers worst decline in productivity since 1960.

Alarm! Treasury Dealer Short Positions Another Red Flag for Liquidity As Stock Market Surges On Realization The Fed May NOT Taper (And Fausti Oversold Omicron Threat)

Alarm!

(Bloomberg) — The recent drop in primary-dealer holdings of front-end Treasuries is another warning of potential market dislocation heading into the year-end liquidity vacuum.

As of Nov. 24, primary dealers — which are mostly the large banks — were on the whole betting against two- to three-year Treasuries rather than buying. They had net short positions of just over $9 million, near the most bearish levels since 2017, signaling a pullback by buyers that provide crucial liquidity for older Treasury issues.

The positioning in the front-end of the curve “suggest less demand from the dealer community to fund off-the-run long positions,” Barclays strategists Anshul Pradhan and Andres Mok say in a Dec. 3 note. Off-the-run Treasuries are notes and bonds created in past years and traded less frequently than the newest issues; they’re the biggest part of the market and make up most of the Federal Reserve’s daily asset purchases, which are being scaled back. 

Short positioning increased on a relative basis as a result, “which may also have crowded demand to borrow particular issues over others,” the analysts wrote. 

Those forces together could contribute to an increase in market dislocations.

 Jerome Powell’s hawkish pivot shocked financial markets. A week later, stocks are higher.
The S&P 500 staged its biggest rally since March to wipe out losses from the past week. The speculative fringe that was a smoldering wreck Friday was soaring Tuesday. An index of meme stocks rallied more than 4%, while one composed of airlines added 1.6%. A gauge of newly public companies advanced more than 4%, SPACs jumped more than 2% and even cryptocurrencies rallied, with Bitcoin powering back above $51,000.

It’s a stunning about-face for risk assets that went into a tail spin after the Federal Reserve chair suggested he favored accelerating the removal of monetary support. What follows are takes from market-watchers on why the market is looking past the Fed’s potential change in policy.

Also, the realization that Fausti was chicken-little and Omicron is not the planet killer.

Or could it be that with China easing, the US will be forced NOT to taper. Or taper only ever-so-slightly.

With the Dow up another 500+ points, it looks like no one is taking Powell and the Gang seriously about tapering. Or Fausti for that matter.

NIAID Director Anthony Fausti.