If this isn’t election interference, I don’t know what is.
The Fed today slashed interest rates by the biggest amount in 16 YEARS, a whopping 50 basis points from 5.50% to 5.00%. With the economy roaring along (thanks to Covid-related massive Federal spending), there was no good reason to slash rates. Other than to get Kamala (Hyena) Harris across the finish line.
The Fed’s bloated balance sheet remains bloast at 7.115 TRILLION.
Options imply a +/-1.1% move in S&P 500 for the 18-Sept FOMC meeting; this compares to an average of +/-1.2% move priced into SPX ahead of FOMC meetings since the beginning of 2022.
Arguably, this is an unusually important FOMC meeting due to the expected start of a cutting cycle.
On average, the S&P 500 has moved +/-1.3% during FOMC events since the beginning of 2022, coming above options implied moves.
In the July FOMC meeting the index moved +/-1.6% vs. an options implied expectations for a +/-1.1% move.
Goldman’s economists expect the September FOMC meeting to be the start of the Fed easing cycle with a 25bp rate cut followed by two consecutive 25bp rate cuts in November and December, and an eventual terminal rate of 3.25-3.5%.
They see differing asset performances around the start of the easing cycle depending on what motivated the Fed cuts.
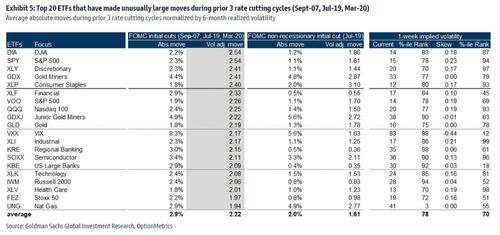
Goldman analyzed moves across stocks and ETFs during the first Fed rate cut in the prior 3 Fed easing cycles (18-Sep-2007, 31-Jul-2019 & 3-Mar-2020).
Rate cuts during the 2007 and 2020 easing cycles were associated with a recession while the 2019 cut was due to a growth scare.
In the tables below are the top 20 names that saw unusual moves during the prior 3 Fed easing cycles and for the 2019 cycle separately.
Financials and Tech were major movers during the beginning of the prior 3 Fed easing cycles while the 2019 cycle also saw unusual moves in Consumer Staples.
Kamala Harris and Tim Walz have produced a destructive proposal to solve the inflation problem: price controls. Her biggest supporters like Elizabeth Warren and Ohio’s Sherrod Brown love the idea of meddling in the private sector,
But I would be symapatheic to their arguement if consumer prices soared more than producer prices. However, the truth is that prices paid by producers (PPI) SOARED far more than prices paid by consumers (CPI).
The cause? Federal goverment spending (green line) exploded with Covid. Harris/Walz are proposing massive spending under her administration hence there will be MORE inflation under Harris/Walz. So, the have to rely on flawed gimmics like price controls. Which will lead to shortage, food lines, rastioning, etc.
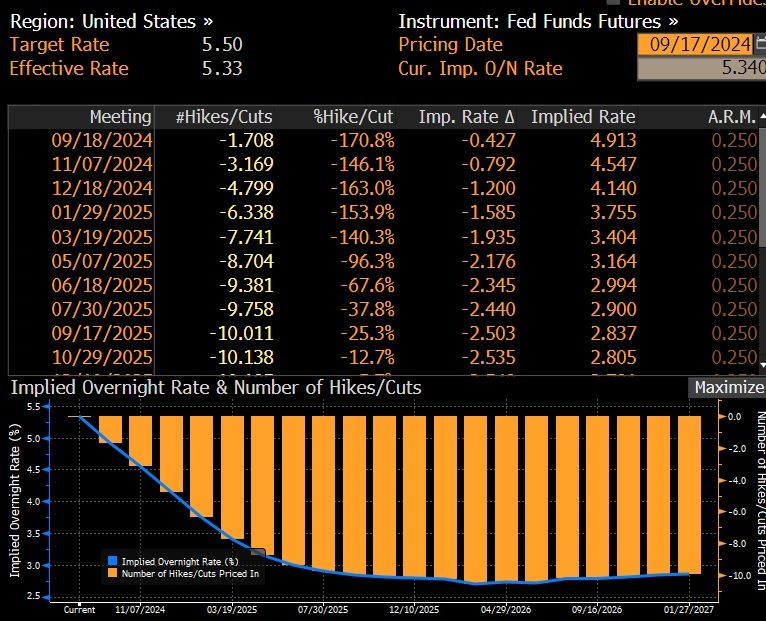
Market participants are expecting a 50 BPS cut tomorrow. From 5.50% to 4.913%.
This painting represents Washington DC where the deep state lingers in darkness.
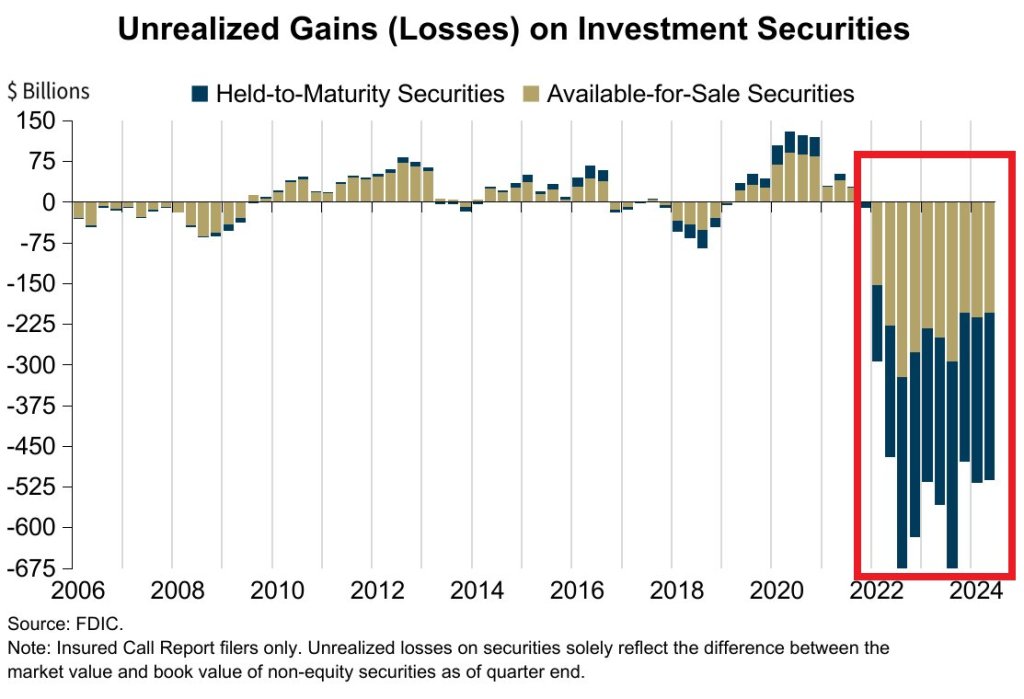
Q2 marks the 11th STRAIGHT quarter of unrealized losses on investment securities for banks, a streak never seen before. The number of banks on the FDIC Problem Bank List increased to 66 and represents 1.5% of total.
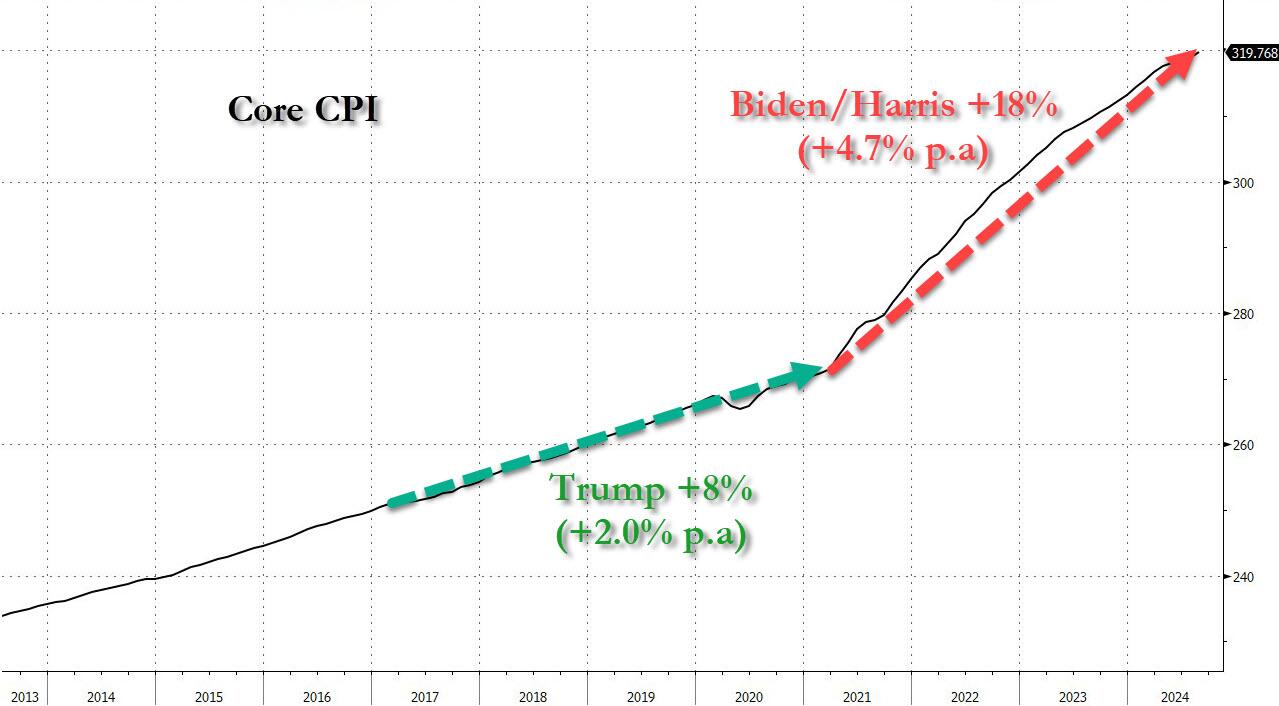
This is in addition to price Increases over last 4 years… CPI Medical Care: +7.8% CPI Apparel: +12.7% CPI Used Cars: +18.3% CPI New Cars: +20.5% CPI Food at home: +21.4% CPI Shelter: +23.4% CPI Food away from home: +25.4% CPI Electricity: +29.8% CPI Gas Utilities: +34.9% CPI Transportation: +38.8% US Home Prices: +48.0% CPI Auto Insurance: +52.4% CPI Gasoline: +53.5% CPI Fuel Oil: +54.9%
Don’t spill the wine, its too expensive under Biden/Harris/Powell.
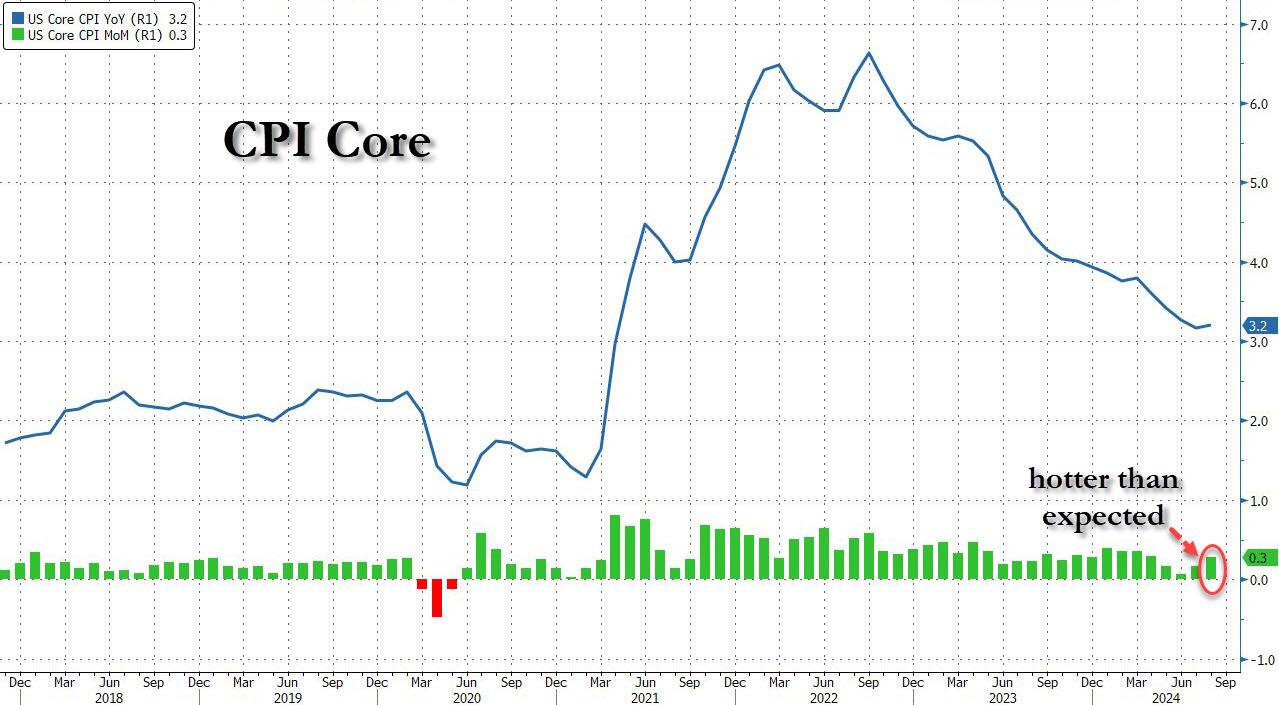
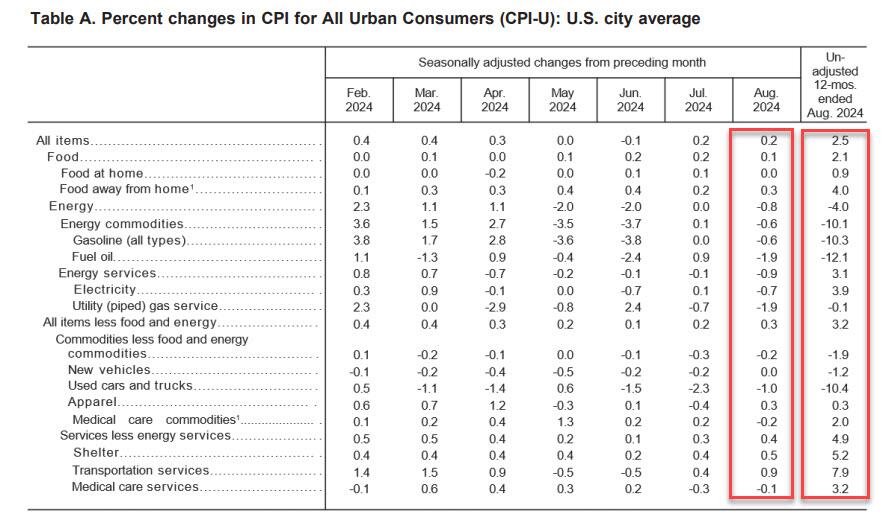
Following last month’s modest miss in CPI which sparked speculation about a 50bps cut, which was then boosted by the jobs report miss and the huge downward revision, moments ago the BLS reported that – as only a handful of Wall Street strategists warned – CPI actually came in hotter than expected at the core level, rising 0.3% MoM vs expectations of a 0.2% print, with all remaining metrics coming in line, to wit:
CPI 0.2% MoM (or 0.187% unrounded), Exp. 0.2% – in line
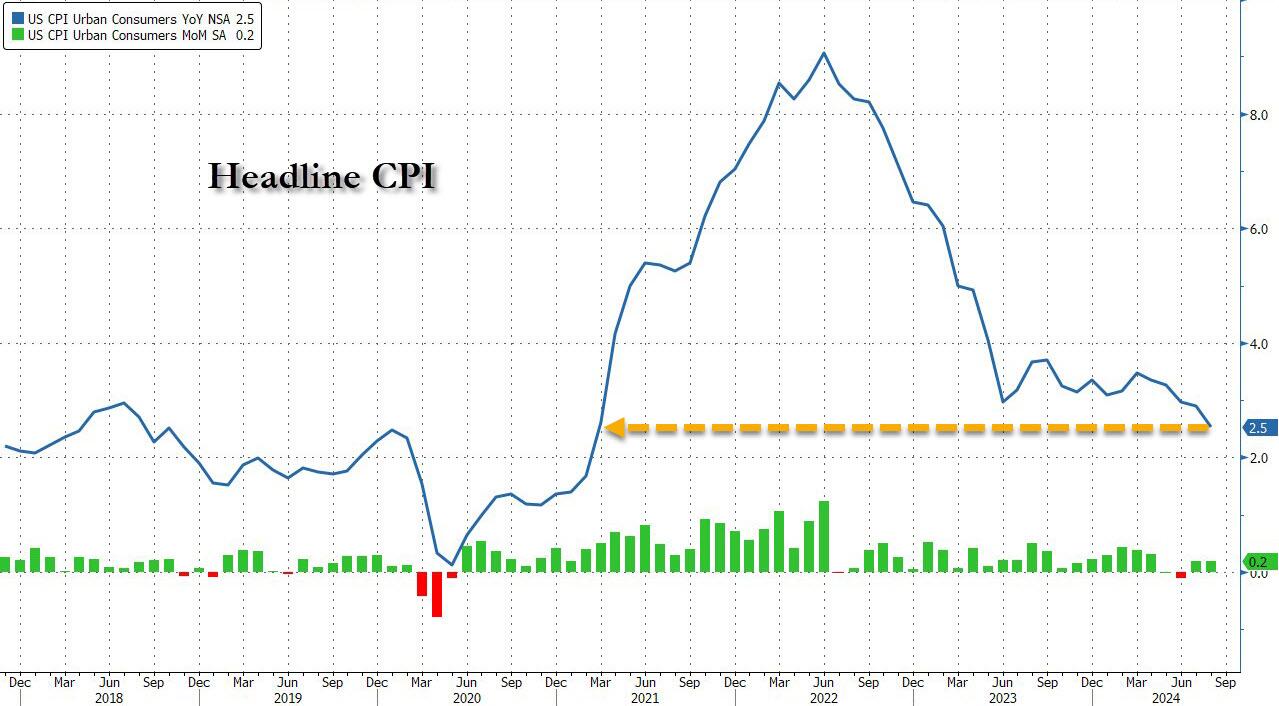
And visually, here is the headline print, where the annual CPI increase dropped to just 2.5% from 2.9%, the lowest since February 2021…
.. and the core….
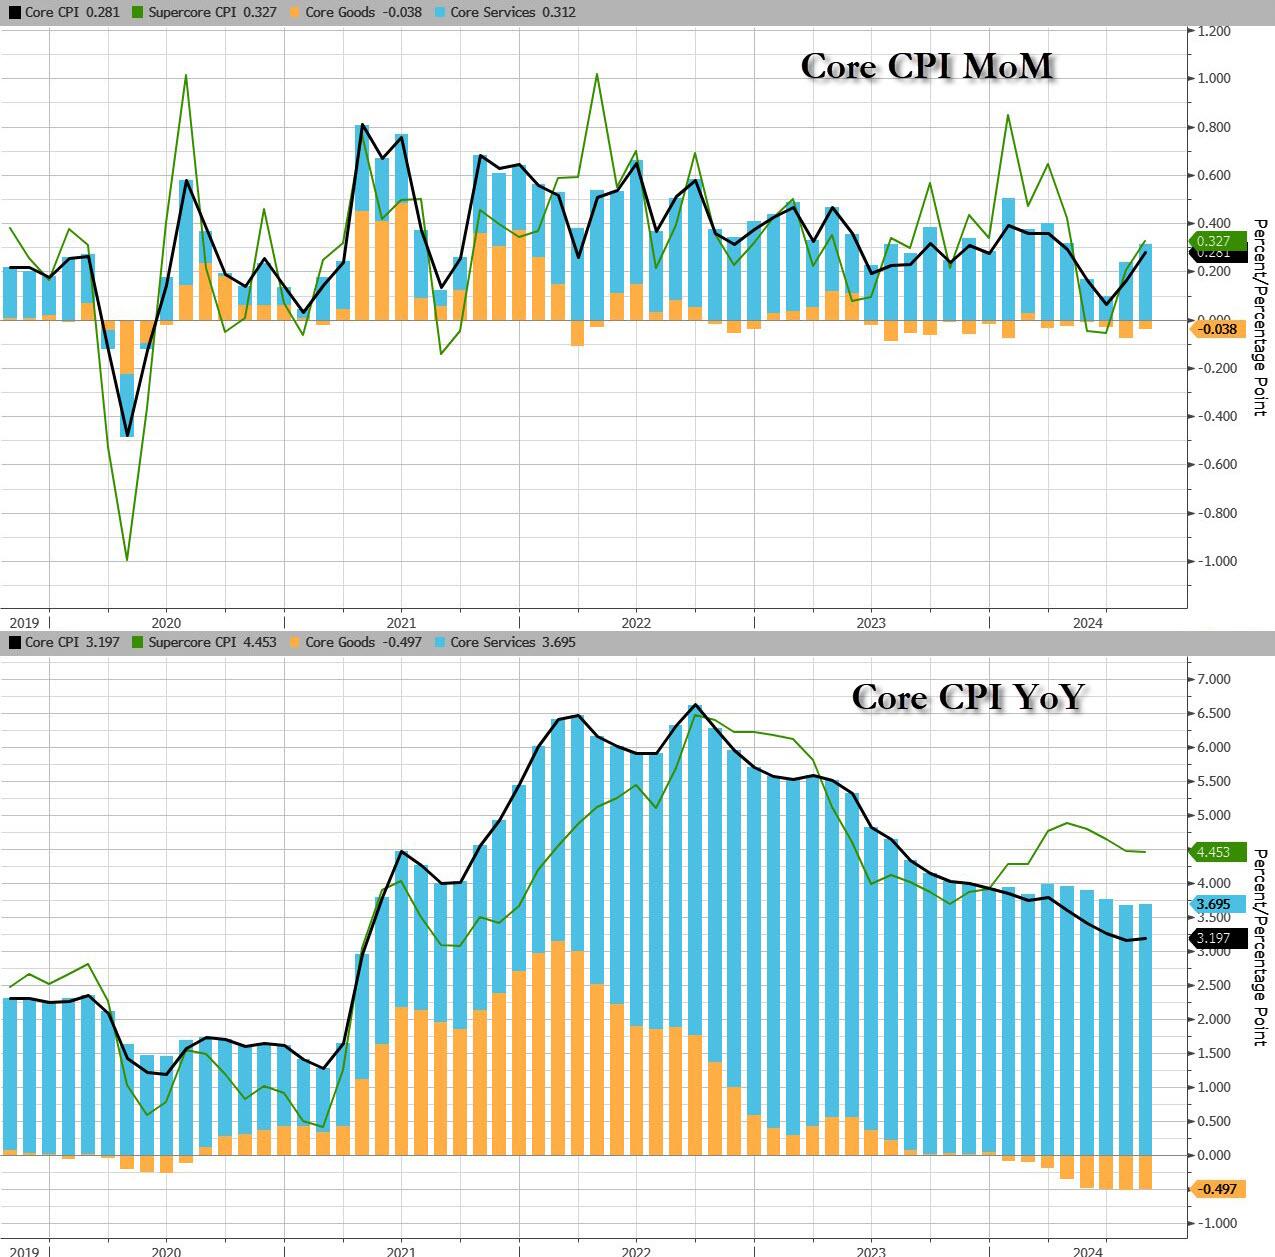
…. as goods deflation is stalling and may even print positive in the coming months, while core service inflation remains the biggest driver.
That was s the 51st straight month of MoM increases in Core CPI, and a new record high.
Under the hood, used car prices fell 1.0%, moderating from last month’s 2.3% drop, while airline fares jumped 3.9%, a big reversal to last month’s bizarre -1.2% drop. Car insurance costs jumped another 0.6%, after rising 1.2%; furniture prices dropped 0.3% reversing last month’s 0.3% rise.
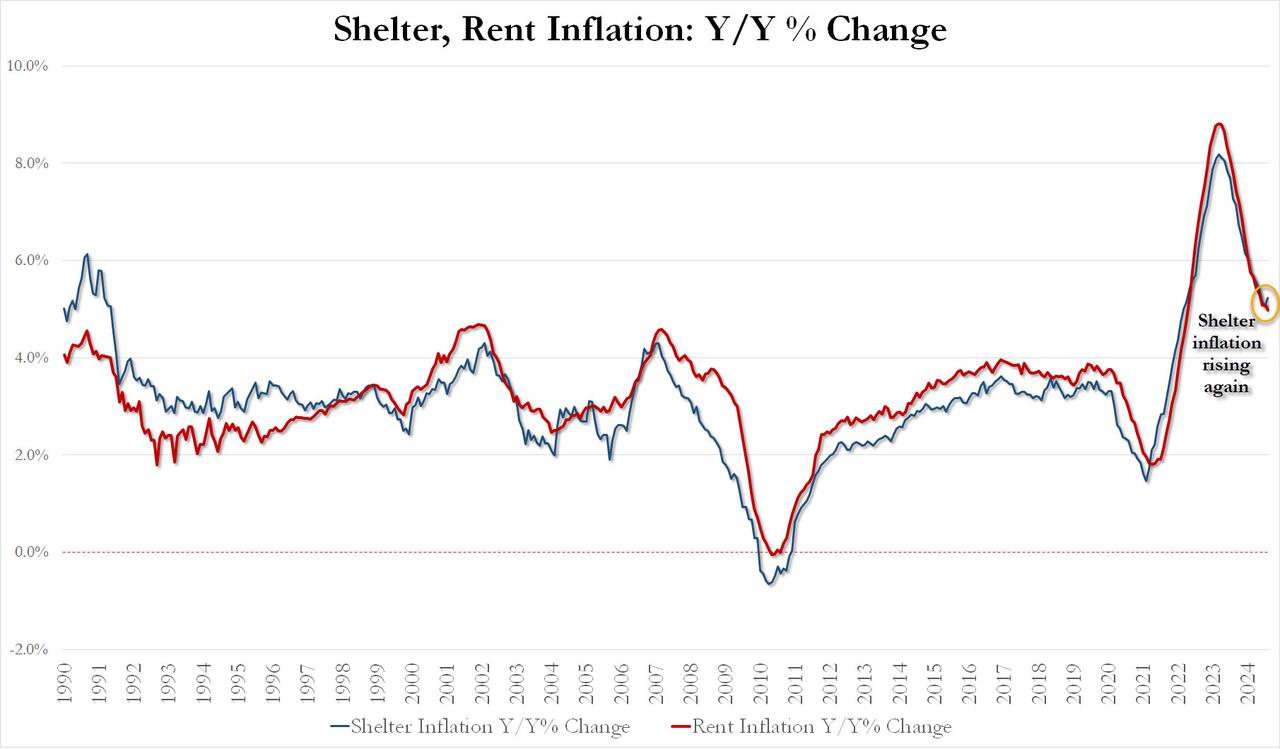
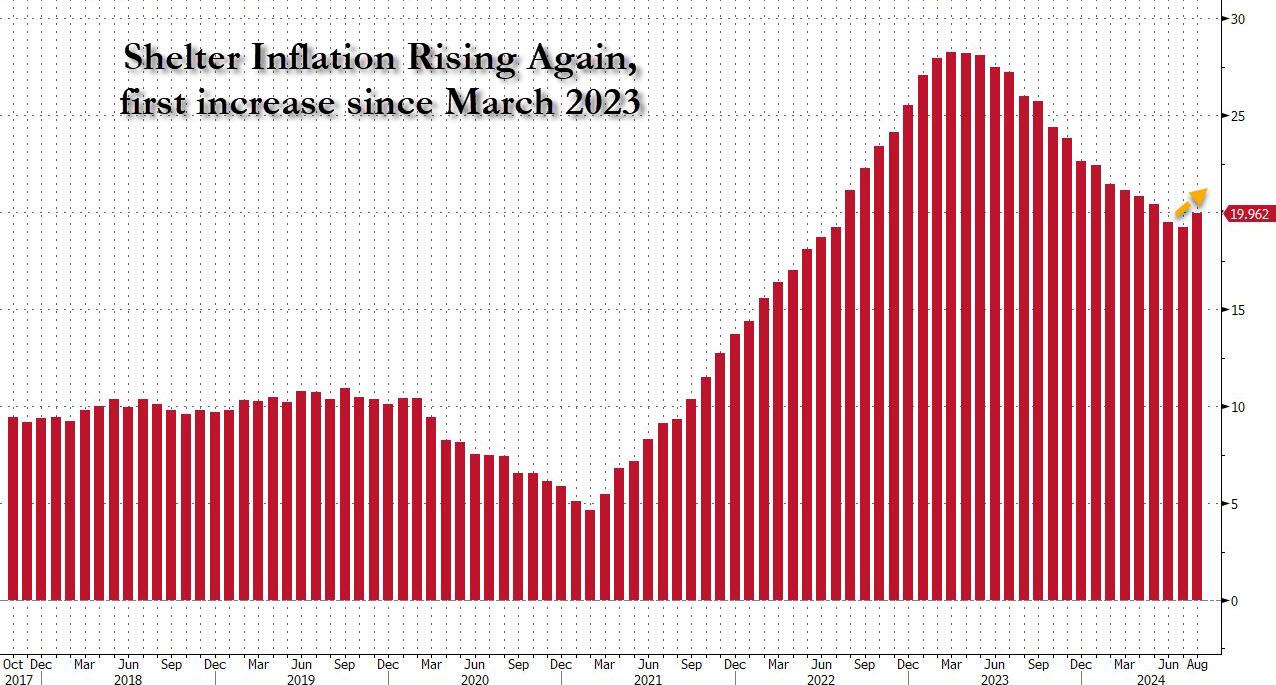
Perhaps more worrying is the fact that while rent inflation has flatlined, shelter inflation posted its first increase since early 2023!
August Shelter inflation up 0.43% MoM and up 5.23% YoY vs 5.05% in July
August Rent Inflation up 0.39% MoM and up 4.97% YoY vs 5.09% in July
And the first monthly increase since March 2023 highlighted:
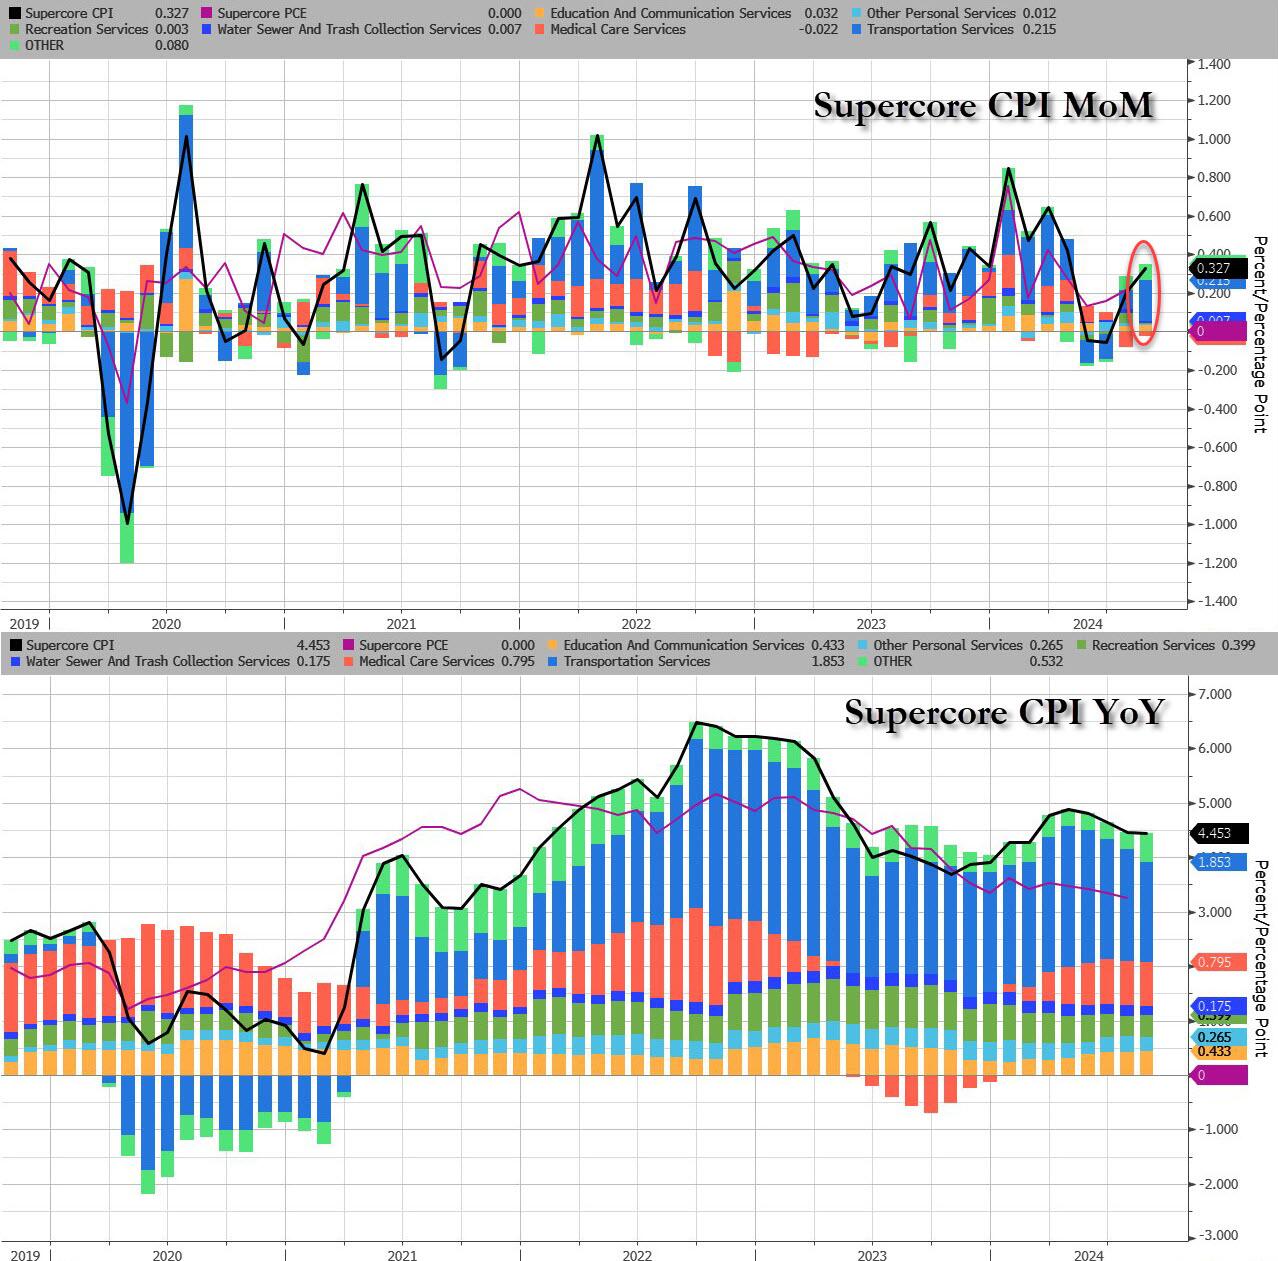
Last, but not least, and perhaps most ominous of all, is that while inflation refuses to be “killed” even as the Fed is about to start cutting rates, Supercore CPI rose 0.33% MoM, the biggest monthly increase since April, driven by continued acceleration in transportation services, which jumped the most in 5 months.
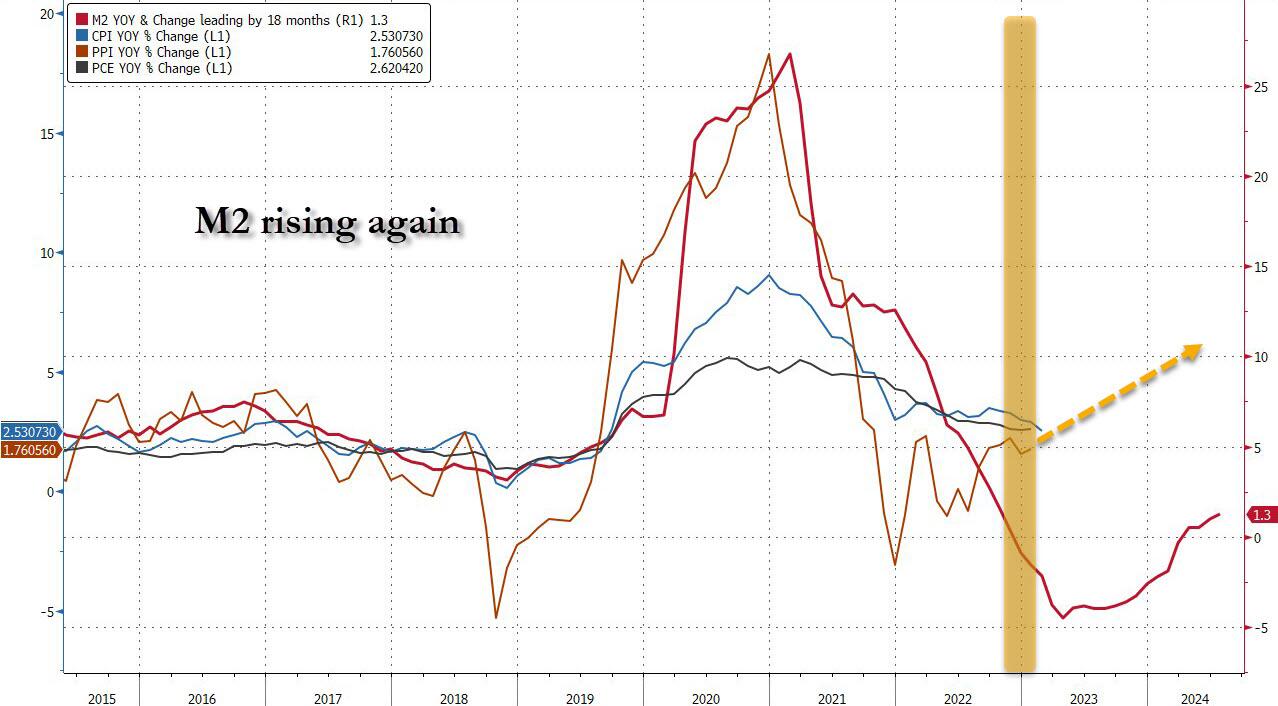
Finally, money supply growth is reaccelerating…
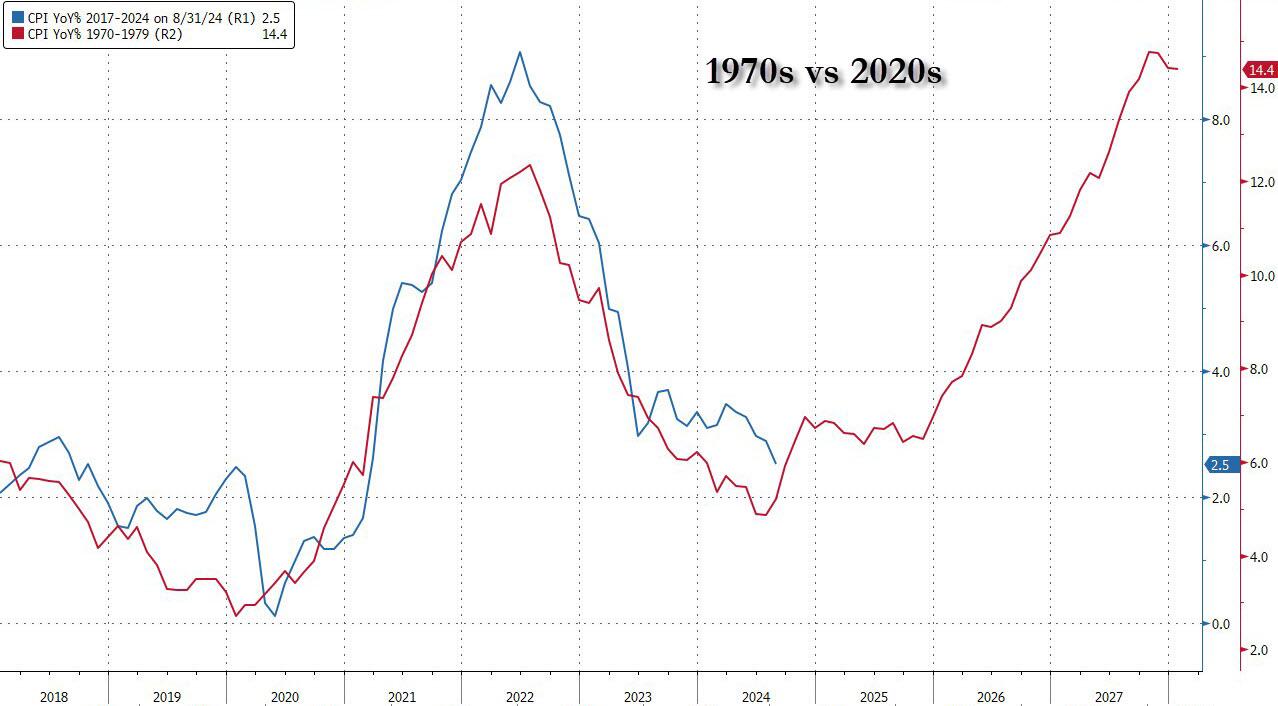
Which begs the question: how long until the Fed’s next easing cycle unleashes the Arthur Burns fed:
Putting it all together:
Underlying inflation unexpectedly picked up, as core CPI increased 0.3% from July, the most in four months, and 3.2% from a year ago
Only five of the 65 forecasts in Bloomberg’s survey called for a 0.3% increase in the core CPI. Almost everyone else was at 0.2%, and four had it at 0.1%. The five were right.
Shelter prices, the largest category within services, climbed 0.5%, the most since the start of the year and the second month of acceleration, defying widespread expectations for a downshift. Owners’ equivalent rent — a subset of shelter and the biggest individual component of the CPI — rose at a similar pace.
Airfares rose a hefty 3.9% in August after falling for the previous five months while costs for energy and used vehicles fell
Risk assets pumped and dumped and bond yields rose. S&P 500 futures dropped steeply immediately after the report came out, before paring losses. The yield on 10-year Treasuries advanced two basis points to 3.66%. The dollar wavered.
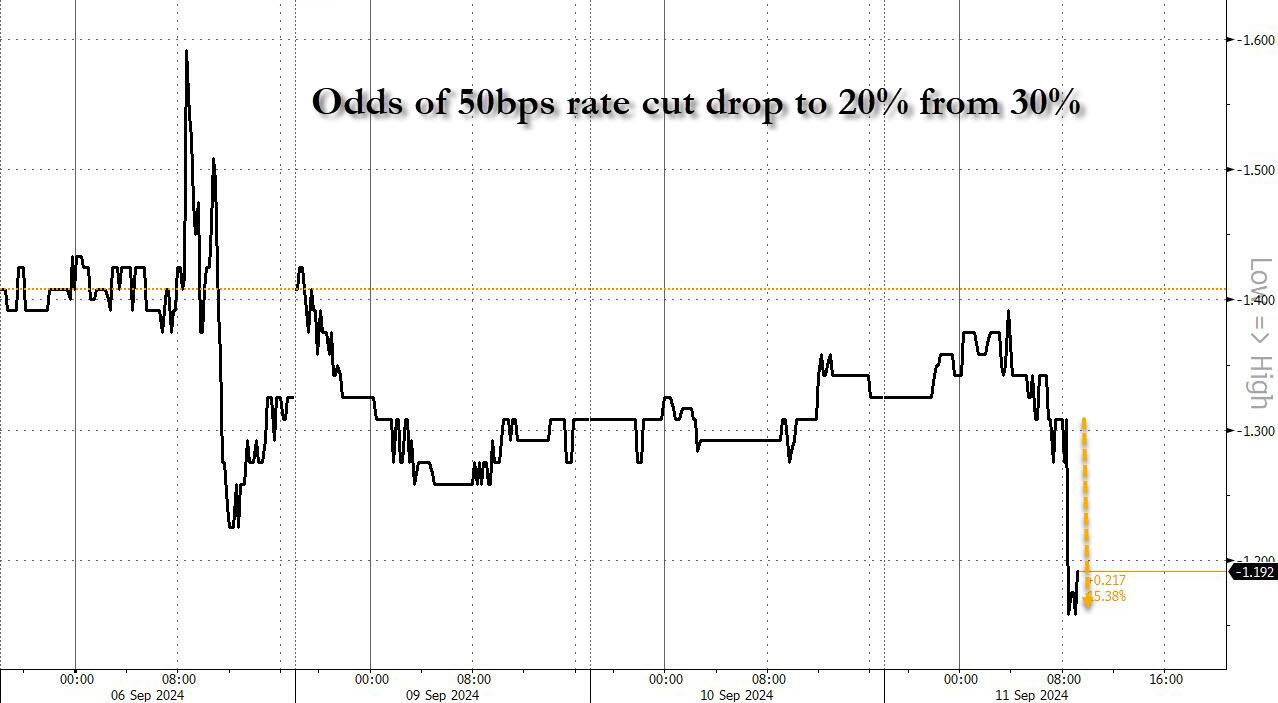
And while one can stick a fork in the market’s hopes for a 50bps rate cut (odds slumped from 30% to 20%… and from 50% last Friday)…
… the question remains: will the Fed really cut rates as shelter inflation inflects higher for the first time since 2023.
After last night’s ABC Presidential debate. Where Kamala acted like she was auditioning for part in the movie “Mean Girls” and the ABS moderators acted like pure Soviet-era Russian journalists.
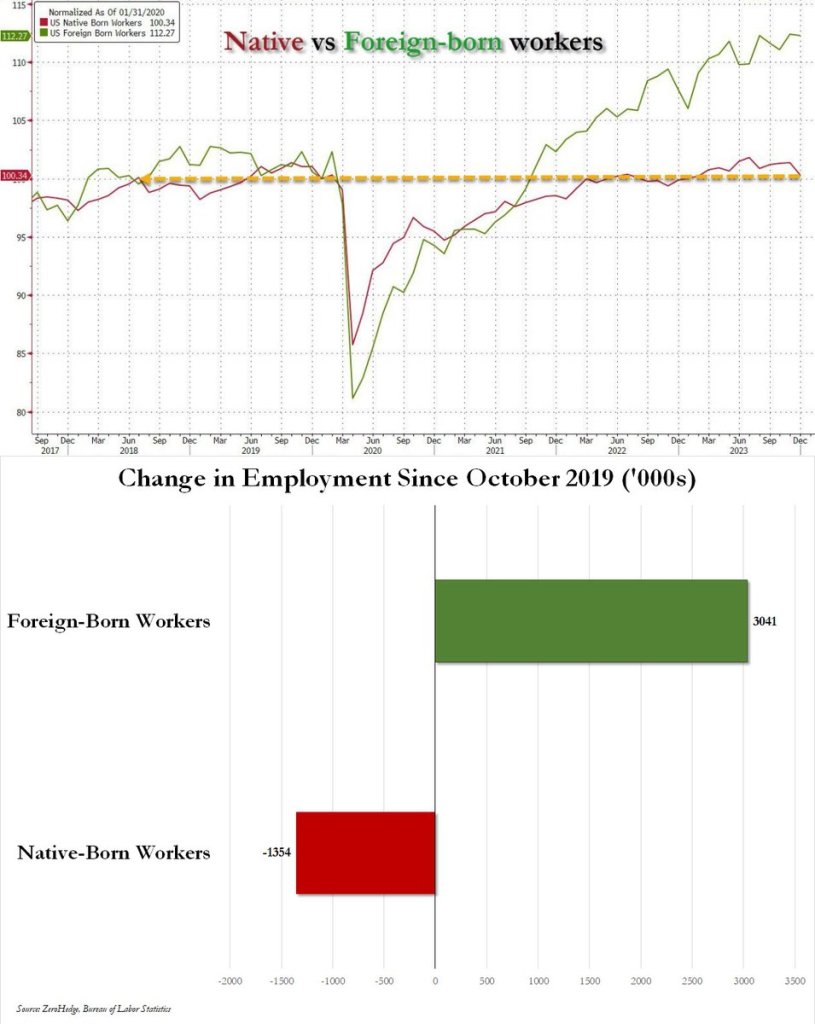
Since October 2019, native-born US workers have lost 1.4 million jobs; over the same period foreign-born workers have gained 3 million jobs.
Ay ay ay ay, ay ay ay ay!
The last three monthly jobs reports show aggregate job gains of 340K. Of that total 172K are accounted for by Health Care and Social Assistance and 60K by Government. Manufacturing jobs have shrunk by 34K; Professional and Business services, a 16k decline.
Biden/Harris have alliowed the US to be invaded. Under Harris, the new US national anthem will be Jesusita en Chihuahua.
2023 and early 2024 saw numerous months where BLS reported jobs added increasing by 200k or more. but after May 2024, jobs added have been slowing,
In August 2024, US nonfarm payrolls rose by 142K, with job gains in construction and healthcare. The unemployment rate held at 4.2%, and the labor force participation rate remained steady at 62.7%. Average hourly earnings increased by 0.4% to $35.21.
2,358 jobs were added in August. This is considerably below the average jobs added since April 2021 of 5,254 jobs added monthly.
Both previous months were revised sharply lower, so once again expect the August print to suffer the same fate. Specifically, the BLS said that the payroll print for June was revised down by 61,000, from +179,000 to +118,000, and the change for July was revised down by 25,000, from +114,000 to +89,000. With these revisions, employment in June and July combined is 86,000 lower than previously reported It also means that 4 consecutive job prints have been revised lower, and 6 of the past 7.
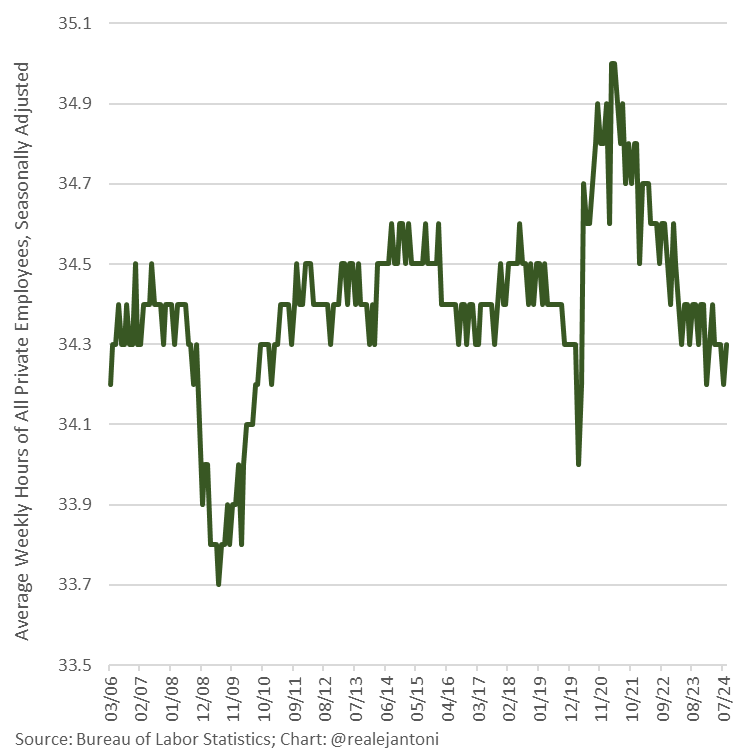
Weekly hours worked remains below pre-pandemic average; a fraction of an hour per week may not sound like much, but multiply that by over 150 million people and 52 weeks per year, and that’s a significant difference in man-hours worked and aggregate income.
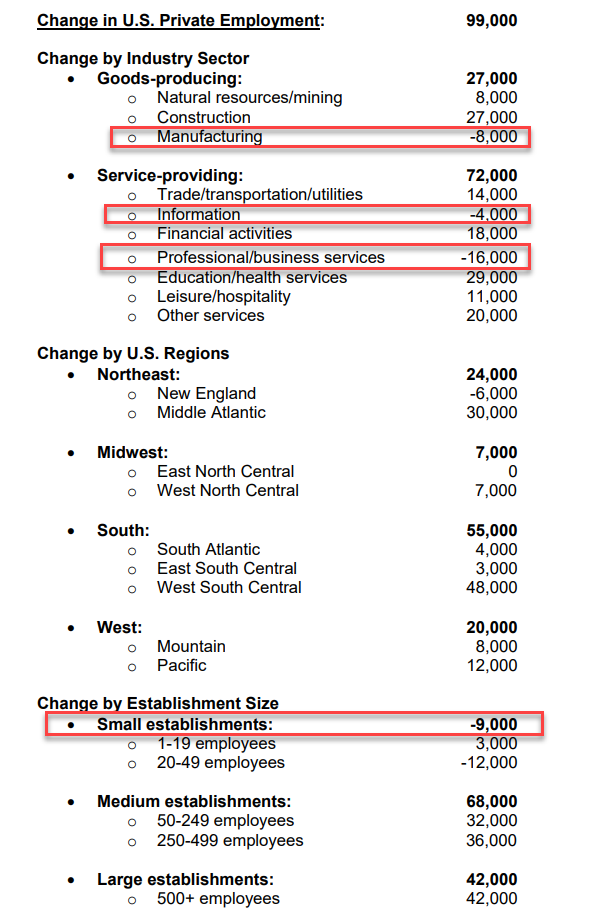
The more truthful ADP report is out and it shows a wimpy 1.3% YoY addition in jobs. So much for a dynamic, growing economy under Biden/Harris. The Covid era Federal spending has run out of steam.
Against expectations of adding 145k jobs (a slight improvement over July’s 122k), ADP’s Employment report printed a dismal +99k for August – the weakest print since January 2021 (and July’s +122k was revised down to +111k)…
Source: Bloomberg
That is also the fifth straight monthly decline in the ADP employment report’s jobs additions.
The highest-paying jobs segments including Manufacturing and Professional Services saw the largest job declines…
This was the weakest Services job growth since March 2023 as Manufacturing job growth also slowed…
“The job market’s downward drift brought us to slower-than-normal hiring after two years of outsized growth,” said Nela Richardson, chief economist, ADP.
“The next indicator to watch is wage growth, which is stabilizing after a dramatic post-pandemic slowdown.”
Source: Bloomberg
Finally, as a reminder, ADP has underestimated the official BLS data for 10 of the last 12 months…
Source: Bloomberg
So jobs growth weak (great news for the doves) but wage growth has stopped is disinflatinary trend (not a great picture).


You must be logged in to post a comment.