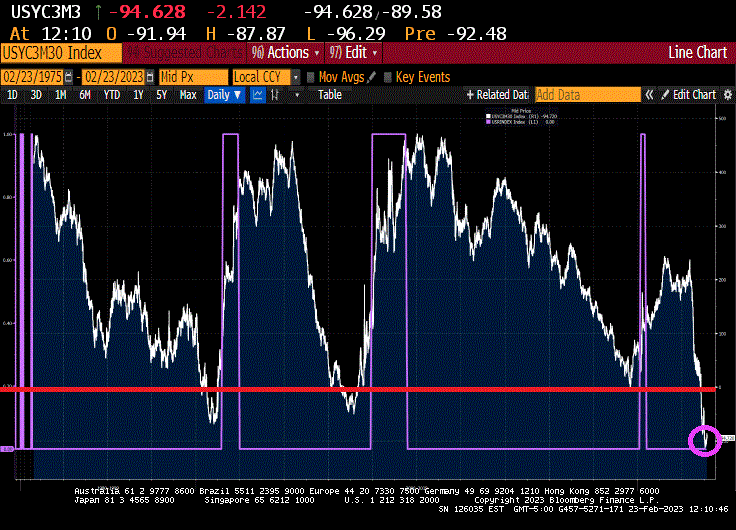
Bull steepenings in the yield curve are generally seen as a precursor to a recession, but they are often preceded by bear steepenings. The 3m30y curve is currently bear steepening, indicating a recession could begin as early as the summer. In fact, the 3m30y curve is now inverted at -94.628 basis points pointing to a recession in summer 2023.
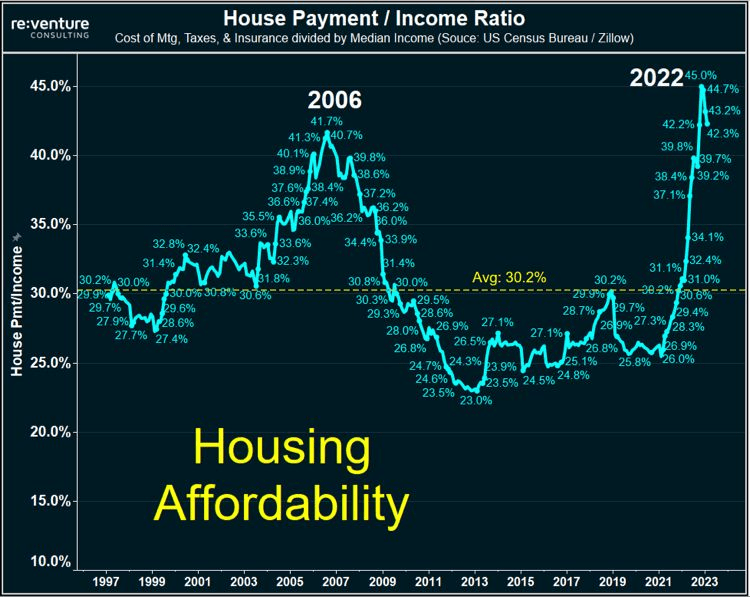
This is happening as the US house payment to income ratio near all-time highs.
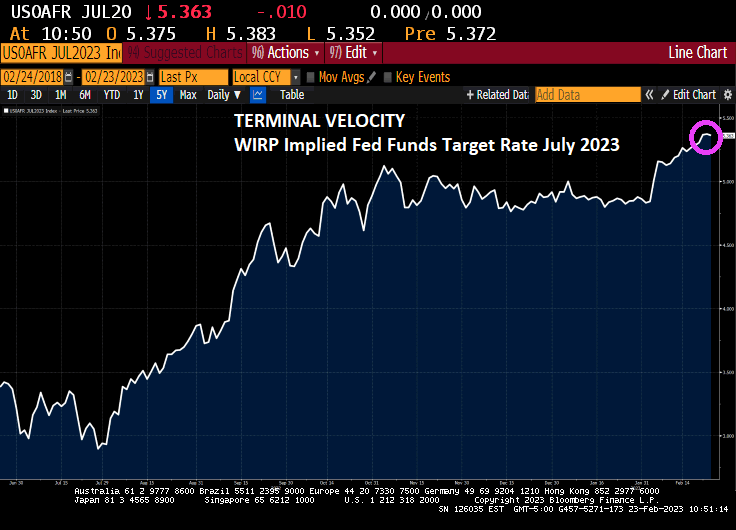
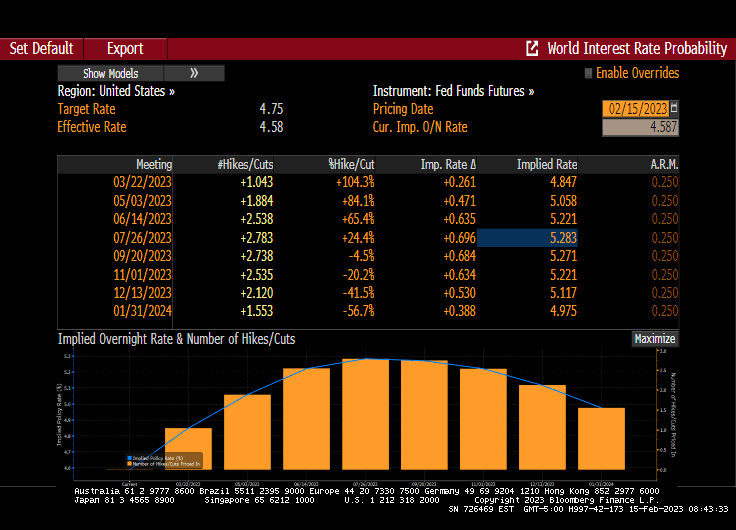
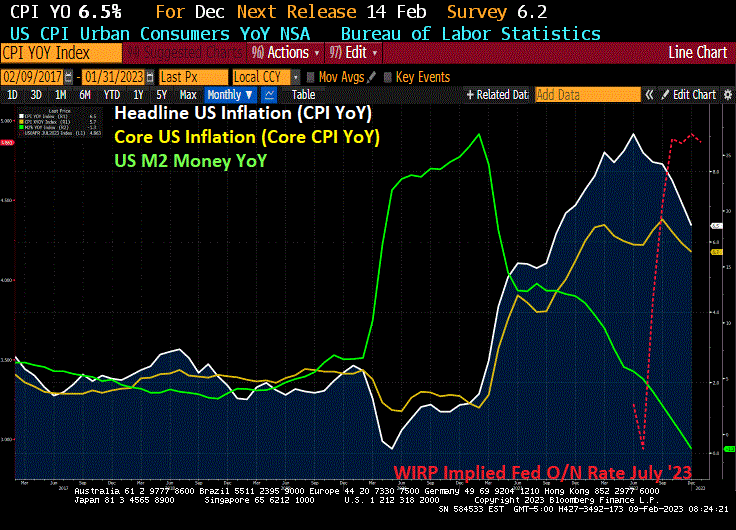
The terminal Fed Funds target rates is now 5.363% for the July FOMC (Fed Open Market Committee) meeting in 2023.
This comes as US Q4 GDP was revised lower on weaker consumer spending, revised downward to 1.4%
With the revision of Personal Consumption, real GDP was revised downward to 2.7% annualized QoQ.
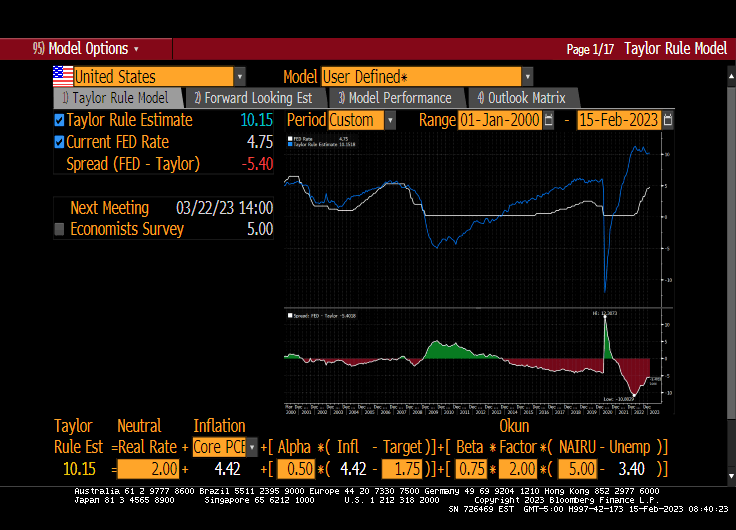
The Taylor Rule estimate for The Fed Funds Target rate is 10.15%. The Fed is only at 4.75%, so there is a long way to go! Except that The Fed doesn’t follow any useful rule like the Taylor Rule. Just the “seat of the pants” rule.
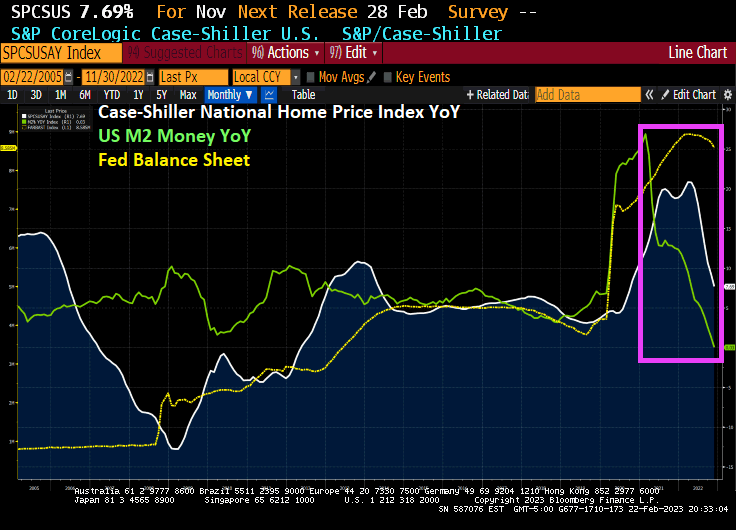
The value of the US housing market shrunk by the most since the 2008 as the pandemic boom (and M2 Money growth) fizzled out.
After peaking at $47.7 trillion in June, the total value of US homes declined by $2.3 trillion, or 4.9%, in the second half of 2022, according to real estate brokerage Redfin. That’s the largest drop in percentage terms since the 2008 housing crisis, when home values slumped by 5.8% from June to December.
Homebuyers, already facing record-high prices, took an additional hit from mortgage rates that more than doubled last year. With less competition in the market, the median US home sale price was $383,249 last month, down from a peak of $433,133 in May.
To be sure, home prices are not collapsing. In December, the total value of US houses was still 6.5% higher than it was a year earlier.
Florida Gains
How much homeowners lost depends on where they bought. The biggest declines were in pricey cities like San Francisco and New York, while buyers who moved to pandemic boomtowns are still seeing the returns on their investment, particularly in Florida.
That was especially true in Miami, where the total value of homes ballooned 20% year-over-year to $468.5 billion in December, the largest annual percentage increase among the top metro areas. While the overall US housing market is down, Miami’s market has about the same value as when it peaked at $472 billion in July. Meanwhile, homeowners in North Port-Sarasota, Florida, Knoxville, Tennessee, and Charleston, South Carolina, all saw annual gains above 17% in 2022.
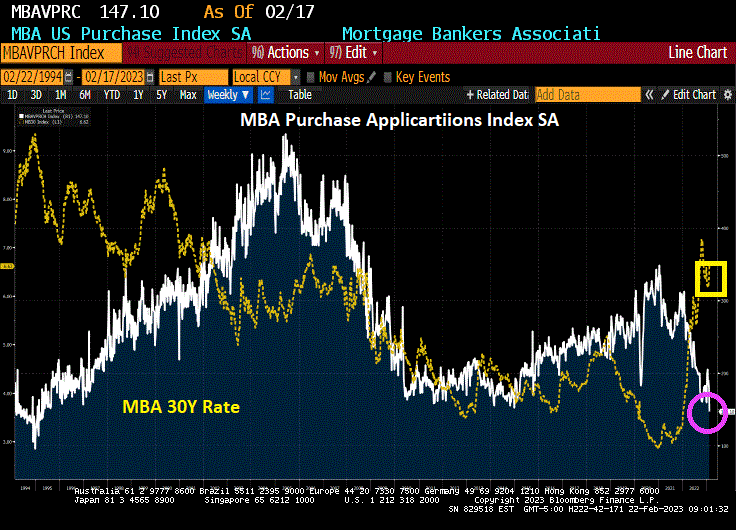
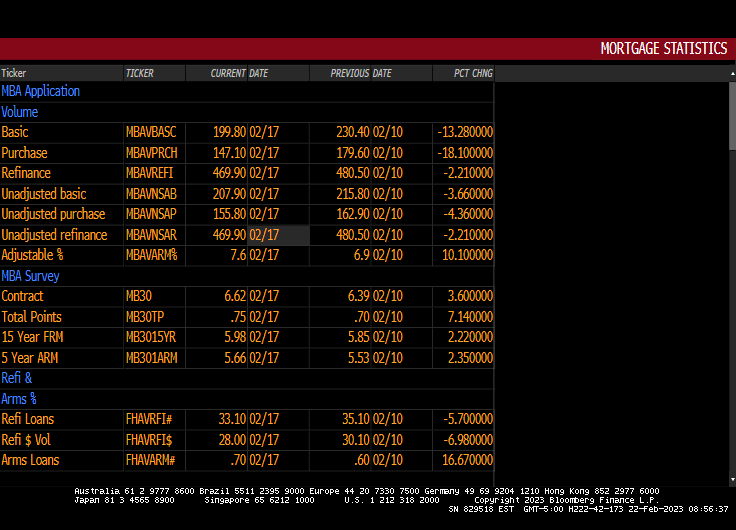
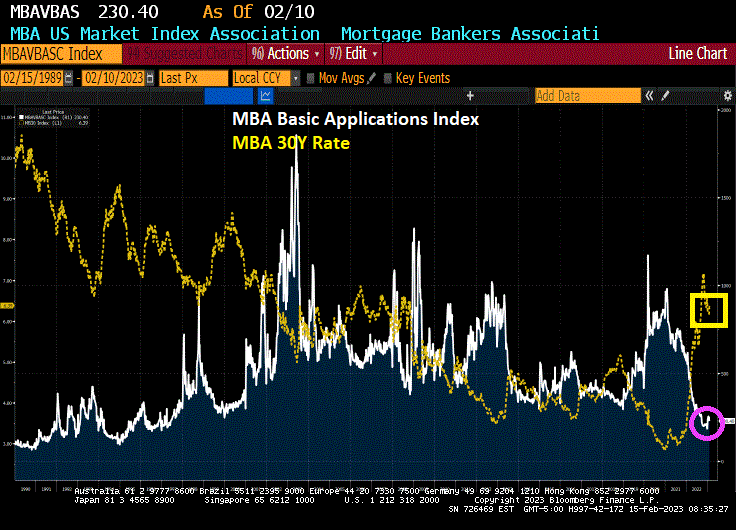
Mortgage rates increased across all loan types last week, with the 30-year fixed rate jumping 23 basis points to 6.62 percent – the highest rate since November 2022. The jump led to the purchase applications index decreasing 18 percent to its lowest level since 1995.
Mortgage applications decreased 13.3 percent from one week earlier, according to data from the Mortgage Bankers Association’s (MBA) Weekly Mortgage Applications Survey for the week ending February 17, 2023.
The Market Composite Index, a measure of mortgage loan application volume, decreased 13.3 percent on a seasonally adjusted basis from one week earlier. On an unadjusted basis, the Index decreased 4 percent compared with the previous week. The Refinance Index decreased 2 percent from the previous week and was 72 percent lower than the same week one year ago. The seasonally adjusted Purchase Index decreased 18 percent from one week earlier. The unadjusted Purchase Index decreased 4 percent compared with the previous week and was 41 percent lower than the same week one year ago.
Did Biden appoint “Pothole Pete” Buttigieg to oversee the mortgage market??
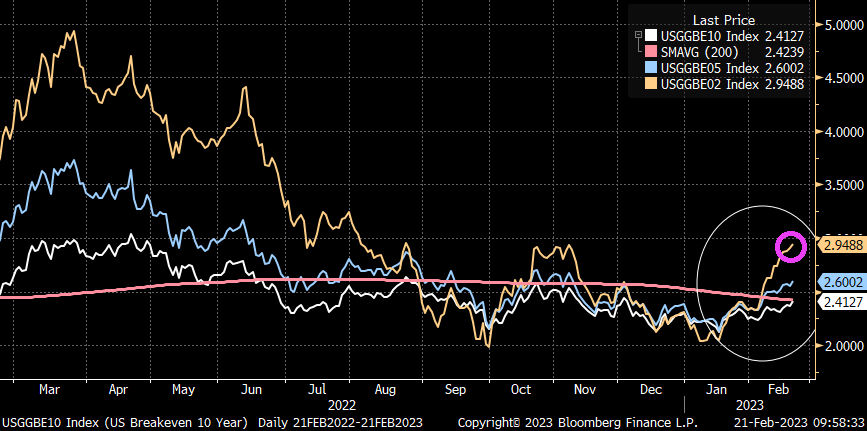
But before I go for experimental therapy for my brain tumor, I will leave you with this diddy. Inflation expectations are on the rise, not falling like Biden and Yellen keep screaming.
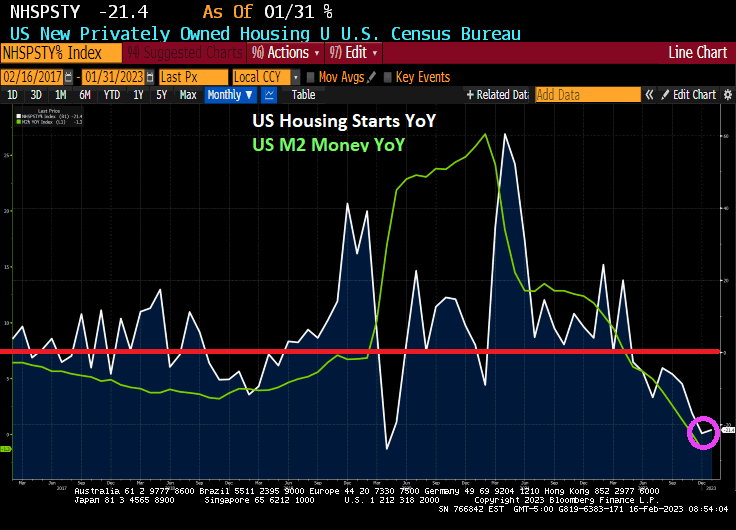
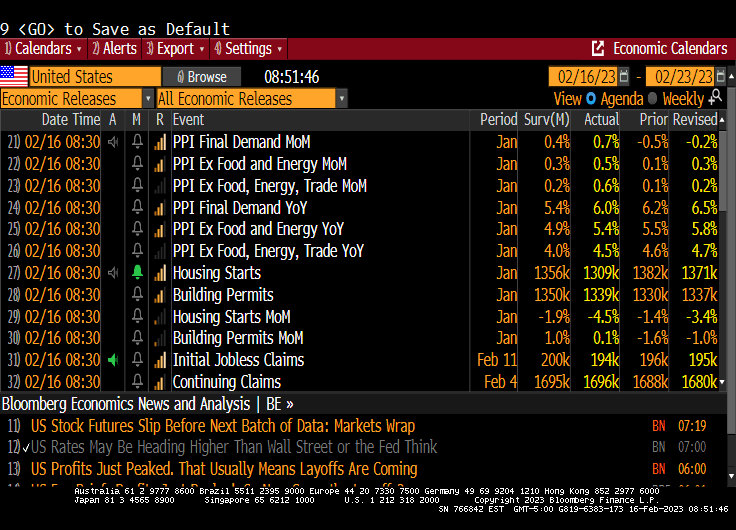
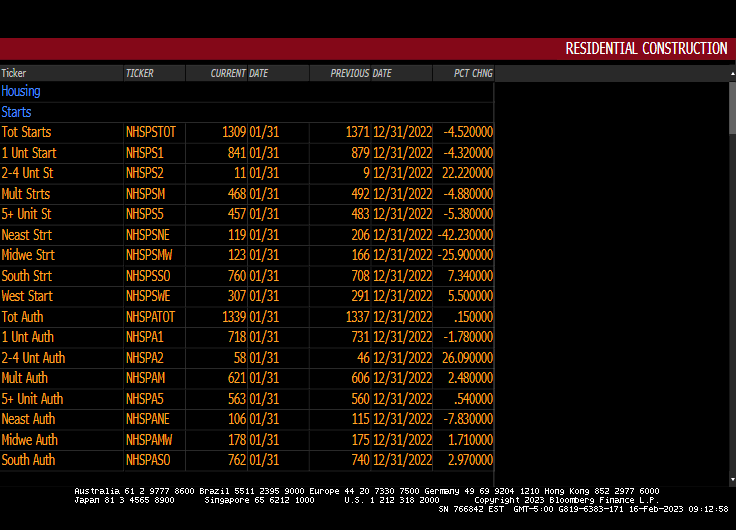
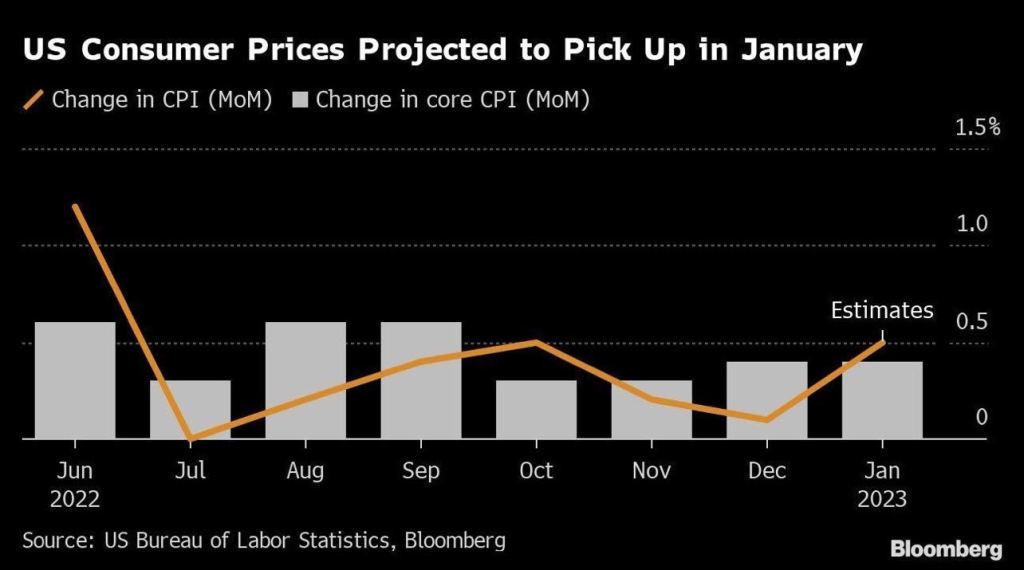
First, US housing starts are now down -21.4% year-over-year (YoY) and down -4.5% month-over-month (MoM) in January 2023 as The Fed removes its massive monetary stimulus.
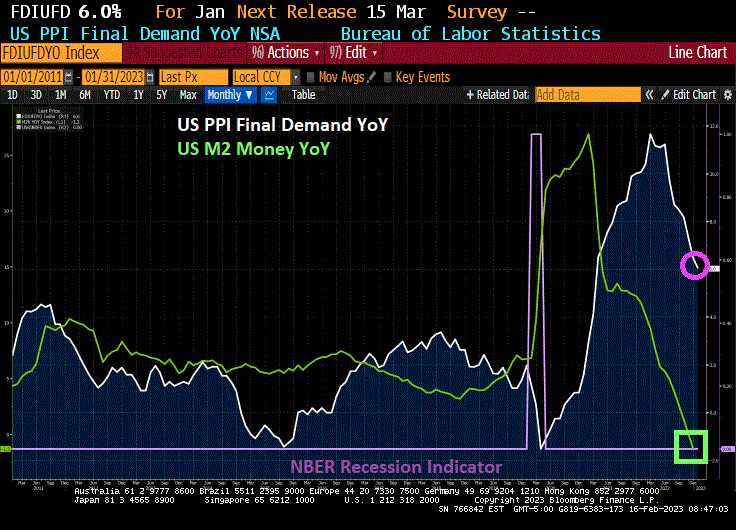
PPI Final Demand PRICES are still elevated at 6% YoY, so expect more Fed tightening.
Today’s data dump.
On a final note, I am appalled at the Biden Administration’s “response” to the East Palestine Ohio derailment. Where is Mayor Pete, the US Transportation Secretary??
US inflation is causing The Federal Reserve to raise interest rates, and mortgage applications are suffering.
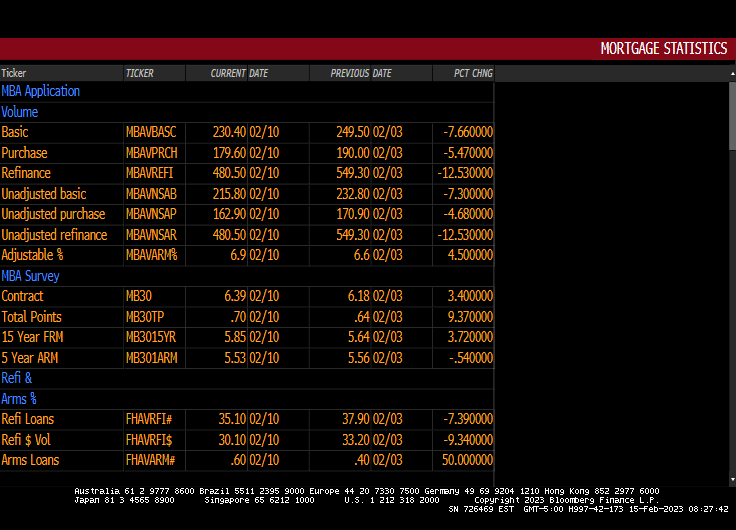
Mortgage applications decreased 7.7 percent from one week earlier, according to data from the Mortgage Bankers Association’s (MBA) Weekly Mortgage Applications Survey for the week ending February 10, 2023.
The Refinance Index decreased 13 percent from the previous week and was 76 percent lower than the same week one year ago. The seasonally adjusted Purchase Index decreased 6 percent from one week earlier. The unadjusted Purchase Index decreased 5 percent compared with the previous week and was 43 percent lower than the same week one year ago.
The MBA contract rate rose 3.4% from 6.18% to 6.39% as The Fed tightens.
And if you believe the Taylor Rule (as opposed to The Fed’s current politically-based decisions), The Fed’s target rate should be 10.15% and The Fed is less than half way there at 4.75%.
The Fed is expected (by investors in Fed Funds Futures) to rise to 5.283% by the July FOMC meeting, then decline to under 5% by January ’24.
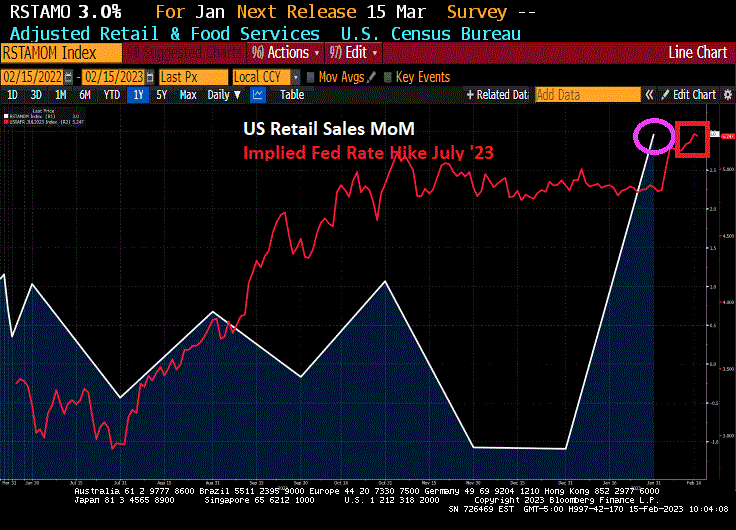
Speaking of Fed rate hikes, January’s red hot retail sales (up 3% MoM) is surely going to drive inflation UP and The Fed will keep raising rates.
While much of the US is down from 2022 peaks in home price. but it is The West where home prices are down the most (just like 2008 where the Inland Empire of California, Phoenix and Las Vegas crashed in term of home prices).
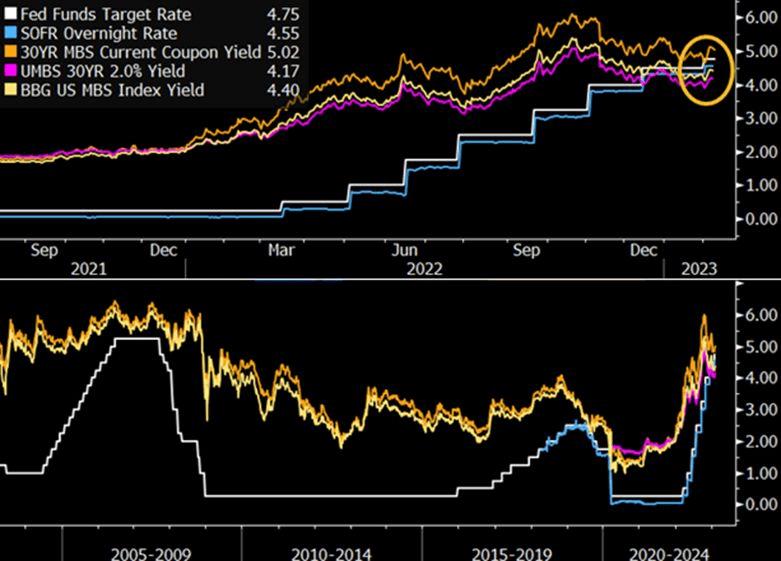
The most recent tightening by the Federal Reserve has pushed the federal funds target rate above mortgage-backed securities yields for the first time in history. Though this poses clear challenges of carry for MBS holders, selective investments in specified pool and collateralized mortgage obligations (CMOs) could provide incremental returns.
Inflation started under Biden, but the massive expansion in money supply (M2) begin with Covid in 2020.
Once this latest spending splurge kicks in, we will see rising inflation again. After all, Biden and Congress have gotten the taste for massive spending bills (like vampires) and spending likely won’t slow down.
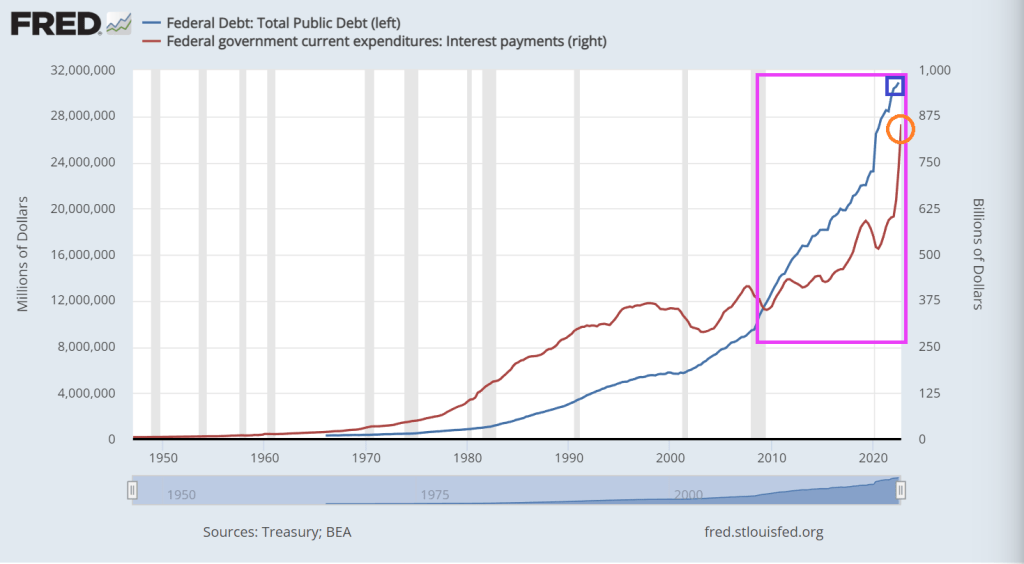
Nothing has been the same since Nancy Pelosi (CA-D) became Speaker of the House in January 2007. In fact, US public debt was at $8.68 trillion when she was handed the gavel and US public debt now sits at $31.55 trillion. That is a whopping 264% increase in the nation’s debt under free-spending SanFranNan. To Pelosi, there is no such thing as too much debt.
To be fair, Pelosi had plenty of help. We had Barack Obama and Joe Biden assume the Presidency in 2009 and in between we had RINOs (Republicans in name only) John Boenher and Paul Ryan as House speakers. In the Senate, the US has had Harry Reid (NV-D), Chuck Schumer (NY-D) and breifly Mitch McConnell (KY-R) as majority leaders. Of course, he had Donald Trump as President for 4 years then a return to the Obama-Biden Presidency with Old Joe as President for the past 2 years.
This chart show how deranged Congress and the Administration became since 2007. On October 3, 2008, President George W. Bush signed the $700 billion Emergency Economic Stabilization Act (EESA) of 2008 after Treasury Secretary Henry Paulson asked Congress to approve a bailout to buy mortgage-backed securities that were in danger of defaulting.
Since 2007, the US has expereienced a housing bubble burst and ensuing financial crisis (2008/2009), then a Covid economic shutdown in 2020 requiring (in the mind of Statists) massive Federal spending in the form of Covid Relief (aka, the American Rescue Plan) for $1.9 TRILLION, then Infrastructure Spending bill for $1 TRILLION, the Inflation Reduction Act (really a green energy spending bill dressed up as an inflation reduction measure) and the infamous pork-laden Omnibus bill. All this Federal spending has driven up M2 Money by 200% since Pelosi first became House speaker.
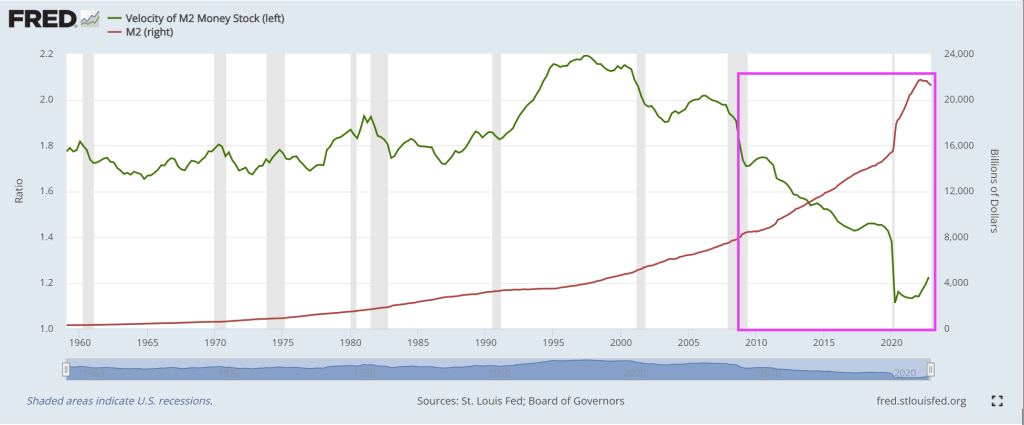
Look at the chart of M2 Money Velocity (GDP/M2 Money) since Pelosi became House Speaker. It has collapsed.
Pelosi is also notable for her “You have to pass the bill to see what’s in it” speech on the Affordable Care Act and childishly tearing up on camera a copy of Donald Trump’s State of the Union address.
Meanwhile, the US has $181.5 Trillion in UNFUNDED LIABILITIES that will require MORE debt to be issue. Social Security unfunded liability is now $22.46 trillion and Medicare unfunded liability is up to $35 trillion. But if you dare mention “reform” to these massive entitlement boondoggles, President Biden and Senate Majority Leader Chuck Schumer will say “Republicans want to take away your Social Security!” That isn’t what Rick Scott (FL-R) said.
Unfunded liabilities per citizen is now $542,457. I propose that all illegal immigrants crossing the Mexican border (or Canadian border) per forced to pay their share of unfunded liabilities as an entry fee..
While Congress debates cutting spending (Hint: Childish Biden and Schumer said no to any cuts to spending), the US Debt Star gets closer to completion.


You must be logged in to post a comment.