As The Federal Reserve battles inflation (caused by excessive monetary stimulus since 2008), Biden’s green energy policies and excess Federal government spending), we can see that the US Treasury 10yr-2yr yield curve has inverted to -54.4 basis points, the lowest since 1982 after Fed Chair Paul Volcker’s war on inflation.
The US Treasury 10yr-2yr yield curve typically inverts (or goes below zero) several months prior to a recession and is most inverted since 1982.
Fed Funds futures data points to the target rate rising to 4.613% by the May ’23 FOMC meeting … then declining.
Since this is rather miserable news for the economy, I will now play my favorite Bruce Springsteen tune, Sherry Darling.
At least the Dow Jones mini-me futures are up this morning.
The US Dollar/Euro cross currency is rising with Fed tightening.
As expected, The Federal Reserve raise their target rate by 75 basis points today. While that sounds like an inflation (blue line)-crushing rate hike, look at the slowly shrinking Fed Balance Sheet (gold line).
Of course, the risk of a recession (dark blue line) is on the increase.
Given the increasing likelihood of a recession, The FOMC’s Dots Project shows The Fed’s target rate increasing to 4.625% in 2023, then gradually declining to 2.5% in the long run.
Fed Funds Futures data points to a peak in May 2023.
As people are painfully aware, The Federal Reserve is on a mission … to hike interest rates to tame inflation back to 2%.
So, we saw a small surge in mortgage applications last week as the expectations of Fed rate hikes sinks in and households try to lock in mortgage rates.
Mortgage applications increased 3.8 percent from one week earlier, according to data from the Mortgage Bankers Association’s (MBA) Weekly Mortgage Applications Survey for the week ending September 16, 2022. Last week’s results include an adjustment for the Labor Day holiday.
The Refinance Index increased 10 percent from the previous week and was 83 percent lower than the same week one year ago. The seasonally adjusted Purchase Index increased 1 percent from one week earlier. The unadjusted Purchase Index increased 11 percent compared with the previous week and was30 percent lower than the same week one year ago.
At least the percentage of ARMs remained the same, 9.1%.
By the way, the theme song for the US version of the TV show “The Office” was written by Jay Ferguson, the primary singer for the ’60s band Spirit (that performed “I’ve Got A Line On You!”).
Today will be another Fed rate hike, expected to be a whopping 75 basis points. The S&P 500 tends to rally (green line) after the FOMC announcement. What will happen today?
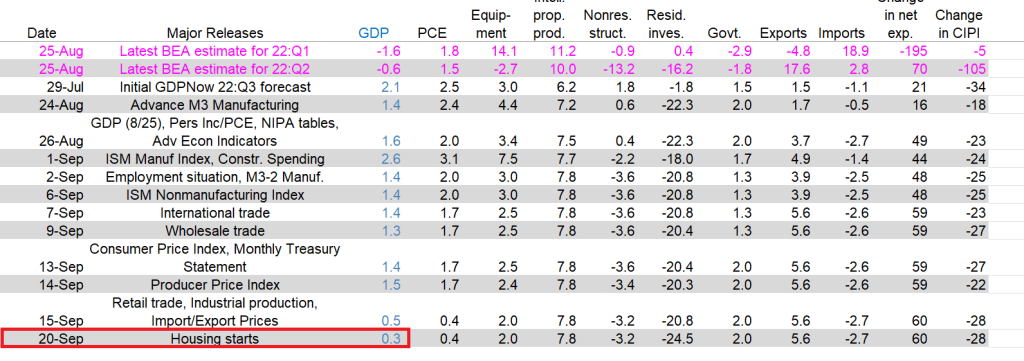
The GDPNow model estimate for real GDP growth (seasonally adjusted annual rate) in the third quarter of 2022 is 0.3 percent on September 20, down from 0.5 percent on September 15. After this morning’s housing starts report from the US Census Bureau, the nowcast of third-quarter residential investment growth decreased from -20.8 percent to -24.5 percent.
The culprit? US Housing starts!
We knew from this morning that housing starts declined -0.01% YoY as The Fed’s Stimulypto wears off.
Even Obama’s economic advisor, Larry Summers, is wondering why Biden won’t allow pipelines to be build to reduce energy prices and reduce inflation.
Having said that, US mortgage rates are now the highest since 2008 and continue to rise with the expectation of more Fed rate hikes this year. Even core inflation is on the rise motivating The Fed to do more tightening since they aren’t receiving any help from Biden on energy or Congress in terms of massive spending of our money.
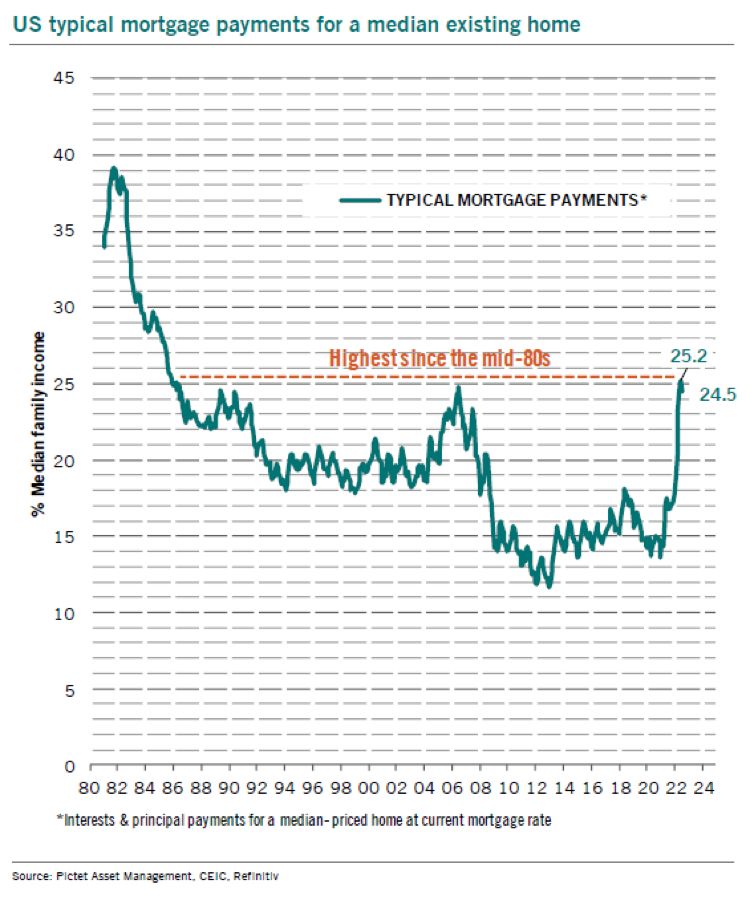
Mortgage payments for a median existing home in the US is back to the mid-1980s.
Data from Fed Funds futures implies that The Fed will raise their target rate to 4.50% by March 2023, then slowly lower rates.
Futures are down with the prospect of a 75 basis point bump in rates tomorrow. The Dow Jone Mini is down -167 points.
The National Association of Home Builders market index fell more than expected in September to 46, the lowest reading since 2012 (if I exclude the Covid economic shutdown).
Note that the NAHB market index is declining along with at the increase in the 30yr mortgage rate.
Its a beautiful morning here in Columbus Ohio! Unfortunately, things are not so beautiful for the US economy.
Let’s begin with the US Treasury 10yr-2yr yield curve slope. Historically, the yield curve inverts prior to a recession. As of this sunny morning, the US Treasury yield curve is inverted and sinking further into inversion. Notice that headline inflation (blue line) has increased declined slightly after hitting 40-year highs as The Federal Reserve begins SLOWLY trimming their balance sheet (orange line). The green line is the expectation of Fed rate hikes by the December 2022 FOMC meeting indicating further monetary tightening.
Goldman Sachs Group Inc. cut its US economic growth estimates for 2023 after recently boosting its predictions for Federal Reserve interest rate hikes.
US gross domestic product will increase 1.1% in 2023, economists including Jan Hatzius wrote in a note Friday, compared with a forecast of 1.5% previously. The projection for 2022 was left unchanged at 0%.
Goldman raised its federal funds rate forecast by 75 basis points over the last two weeks for a terminal rate forecast of 4% to 4.25% by the end of 2022.
Then we have Federal Express which plunged -43.85 points on Friday. I use this an example on how inflation begat Fed tightening that begat an economic slowdown.
The Biden Administration is cheering the “Inflation Reduction Act” and the recent decline in the rate of inflation to a gut-wrenching 8.3% YoY. Bear in mind that since Biden was sworn-in as President, WTI Crude Oil is UP 75%, gasoline prices UP 54%, food prices are UP 48% and the Strategic Petroleum Reserve is DOWN -32%.
Then we have Gold and Bitcoin relative to the INVERSE of the US Dollar since Biden was installed as President.
The Philadelphia Fed Business Outlook fell almost -10% in September as The Federal Reserve tightens monetary policy.
On a related note, the share of total net worth held by the bottom 50% in the US (red line) was always higher than the share of total net worth held by the top 1% (blue line) … until The Federal Reserve began QE in late 2008. Under Obama, the top 1% surpassed the bottom 50% in terms of share of total net worth. it equalized under Trump and before Covid. Then the massive QE (and surge in Federal spending) to battle Covid seemingly made the rich even richer and the bottom 50% even poorer. This is Biden’s America … massive Federal subsidies to the wealthy, crumbs for the bottom 50%.
US mortgage applications dropped to the lowest level since 1997. I wonder if President Biden will invite boring crooner James Taylor back to the White House to sing about the collapsing mortgage market? Perhaps he can sing “Shower The People” and change the lyrics to “Shower ON The People.”
Mortgage applications decreased 1.2 percent from one week earlier, according to data from the Mortgage Bankers Association’s (MBA) Weekly Mortgage Applications Survey for the week ending September 9, 2022. This week’s results include an adjustment for the observance of Labor Day. The Refinance Index decreased 4 percent from the previous week and was 83 percent lower than the same week one year ago. The seasonally adjusted Purchase Index increased 0.2 percent from one week earlier. The unadjusted Purchase Index decreased 12 percent compared with the previous week and was 29 percent lower than the same week one year ago.
The Bankrate 30-year mortgage rate is now at the highest level since 2008 at the advent of Fed’s QE.


You must be logged in to post a comment.