US Producer Price Index Cools To 9.8% YoY In July As M2 Money Growth Cools And Recession Probability Increases

Somehow I doubt if Biden, Harris and Jean-Pierre (Biden’s Press Secretary) will go on the talk show circuit talking about the Producer Price Index Final Demand at 9.8% YoY, meaning that inflation is still raging.

But the curious thing about the PPI Final Demand numbers. While lower than June’s reading of 11.3% YoY, it also coincides with declining gasoline prices and declining growth in M2 Money stock. Which is still growing at 5.9% YoY. The probability of recession is rising (even though technically the US is in recession after 2 consecutive quarters of negative GDP growth.

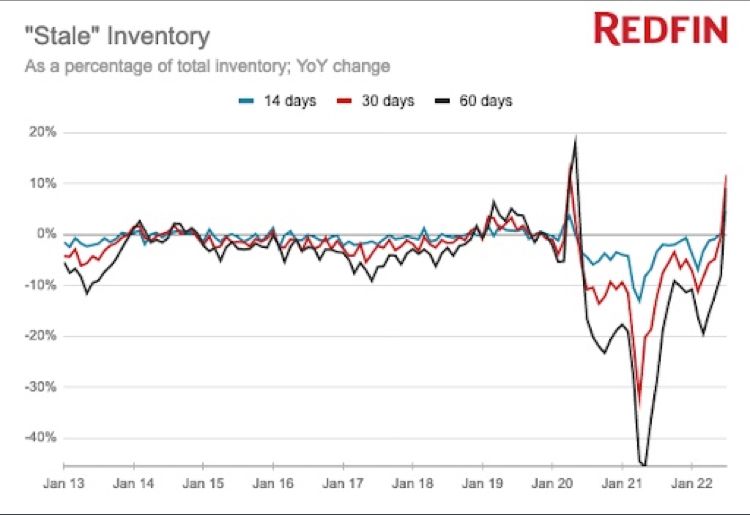
Here is the more striking chart.

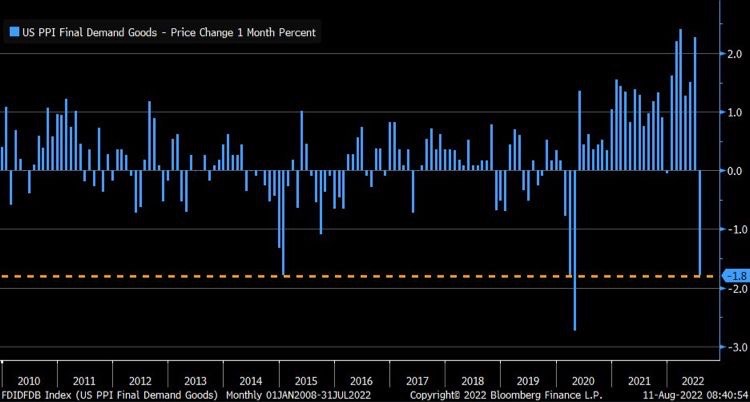
So is the US “improving” on prices because of brilliant Biden strategies (I just laughed at my own “bon mot”)? Or are prices (PPI, gasoline) slowing because of declining demand as the US slips into recession?

Lawrence Summers was once again in the news saying that the way to cool inflation is to raises taxes (and cool demand). Only a true Statist would say something like that. Larry, how about Biden and Congress stop spending so much money that is helping to fuel inflation?

One Washington DC types would rest their hopes on cooling inflation by having the US slip into recession AND raises taxes.

Biden looking for a way out.

Jurassic MBS Market! Agency MBS Prices Swoon With Implied Fed Hikes (Duration Risk Increases Too)

Agency mortgage-backed securities (MBS) prices started to degrade as The Federal Reserve started to try to combat inflation caused by Biden’s energy policies and rampant Federal spending. That is, under June when the implied Fed O/N rate (red line) cooled and the 30-year mortgage rate (blue line) has come down a little.

In terms of duration risk, the FNCL 3% MBS duration has risen with anticipated Fed tightening.

So, further Fed tightening will result in greater MBS losses AND rising duration risk.

Hold on to your butts!

Fannie Mae’s Home Purchase Sentiment Index Falls From 81.7 In March 2021 To 62.8 In July 2022 (As Fed Tightens And Home Prices Boom)

Fannie Mae’s Home Purchase Sentiment index has declined from 81.7 shortly after Biden was sworn-in as President to a meager 62.8 in July 2022.

Of course, mortgage rates have risen quite rapidly and home price growth remains elevated as The Fed still has not trimmed its balance sheet as promised.

Goin’ Down! US Treasury 2-year Yield Drops 15 Basis Points In AM (10Y-2Y Treasury Yield Curve Remains Inverted At -38.870 BPS)

Goin’ down!

Lots of volatility in markets culminating in a 15 basis point drop in the US Treasury Note yield.

Since the 10-year Treasury yield dropped only -2.7 basis points, the 10Y-2Y yield curve rose slightly to -38.87 basis points.

US July Inflation Remains Hot (CPI At 8.5% YoY) While Real Weekly Wage Growth Remains Burned (-3.6% YoY) Mortgage Refi Apps Down -82% YoY While Mortgage Purchase Apps Down -19% YoY)

The US July inflation report remains hot, hot, hot! While mortgage purchase and refinancing applications are not, not, not.

The US consumer price index rose 8.5% in July. And real average weekly growth remains burned by horrid inflation, at -3.6% YoY.

Source of inflation?

Headline inflation above estimates in 14 of last 16 months.

Data from the Mortgage Bankers Association’s (MBA) Weekly Mortgage Applications Survey for the week ending August 5, 2022 revealed that … the Refinance Index increased 4 percent from the previous week and was 82 percent lower than the same week one year ago. The seasonally adjusted Purchase Index decreased 1 percent from one week earlier. The unadjusted Purchase Index decreased 2 percent compared with the previous week and was 19 percent lower than the same week one year ago.

Mortgage applications are NOT hot, hot, hot.

US Treasury Yield Curve Descends Further Into Darkness (-48.4 BPS) As Supply Of Homes Increases 30.7% In June (Fed Is Cooling Off Housing Market)

The US Treasury 10Y-2Y yield curve is descending further into darkness (aka, inversion).

The 10Y-2Y yield curve hit the worst inversion since 2000 as the curve slope hit -47.7 basis points, inverting another -2.267 basis points today.

Yes, the 10Y-2Y Treasury yield curve is SCREAMING RECESSION.

(Bloomberg) – Prashant Gopal – The supply of homes for sale across the US grew at a record rate last month, another sign that higher mortgage costs are cooling down the housing market.

The number of active listings nationwide jumped 31% from a year earlier, a record-high increase for a third straight month, according to a report Tuesday by Realtor.com. 

And according to Redfin, stale inventory is accelerating.

The Federal Reserve is no friend of the US middle class and low wage worker.

Labor Blues! US Labor Productivity Declines -4.6% In Q2 As Unit Labor Costs Sizzles At 10.8% (Fed Balance Sheet Still Out In Force)

Labor Blues!

US labor productivity declined in Q2, down -4.6% since Q1. At the same time, unit labor costs continue to soar at a rate of 10.8%.

You can see that The Federal Reserve has begun to SLOWLY reduce it balance sheet.

Somehow, I don’t think Biden’s team will be discussing today’s news, other than report that “It’s A Beautiful Day Today.”

Pushin’ Too Hard? US Treasury Yield Curve Inverts To -45 Basis Points (Most Inverted Since 2000) Despite Senate Passing “Inflation Reduction” Boondoggle

Is The Federal Reserve pushin’ too hard on raising their target rate?

The US Treasury 10Y-2Y yield curve descended further into inversion, signaling impending recession.

The US unemployment rate (U-3) tends to be the lowest when the 10Y-2Y yield curve inverts, then explodes when recession strikes.

The spread between the Bankrate 30-year mortgage rate and the Bankrate 5/1 ARM rate widened to 139 basis points.

This is happening as The Fed is expected to keep raising their target rate (yellow line) and the US Senate passed its massive “inflation reduction” boondoggle that is expected to NOT reduce inflation, but raise taxes on the middle class and low-wage workers.

Simply Unaffordable! Gap Between Real Home Price Growth (+11.17% YoY) And Real Wage Growth (-2.15% YoY) Near Highest Since 1988 (REAL 30Y Mortgage Rate Is Now -3.23%)

The US housing market is simply unaffordable for millions of Americans. To illustrate the problem, here is a chart of the Case-Shiller National home price index less CPI YoY graphed against Average Hourly Wages less CPI YoY.

The gap between the REAL national home price index YoY and REAL US average hourly earnings YoY is near the largest since 1988. Inflation is making matters far worse since REAL average hourly earnings growth continues to decline.

The only thing positive to say is that REAL home price growth YoY is lower now than at the peak of the 2005 home price bubble that burst catastrophically.

Another “positive” is that the REAL 30-year mortgage rate has fallen to -3.23%. At the peak of the house price bubble in June 2005, the REAL 30-year mortgage rate was +2.58%. THAT is one big difference between the pre-2008 recession and today’s impending recession.

Weekend Update! US Treasury Yield Curve Inversion Worsens Screaming Impending Recession, 30Y Mortgage Rate Rises To 5.6% (5/1 ARM Rate Rises To 4.21%)

Here is your weekend update on Treasury and Mortgage markets.

The current US Treasury 10Y-2Y yield curve just slipped further into reversion at -40.299 basis points, screaming impending recession. Oddly, The Federal Reserve has been leaving its balance sheet of Agency Mortgage-backed Securities (MBS) in tact (green line).

On the mortgage front, Bankrate’s 30-year mortgage rate index rose to 5.60% while the affordability-friendly 5/1 Adjustable Rate Mortgage (ARM) rate rose to 4.21%.

Currently, a 5/1 ARM borrower can save 139 basis points over the traditional 30-year mortgage rate.

Have a wonderful weekend!