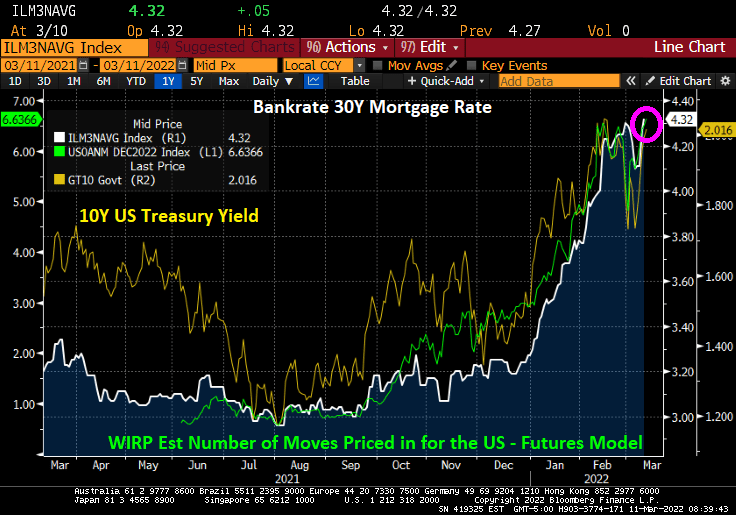
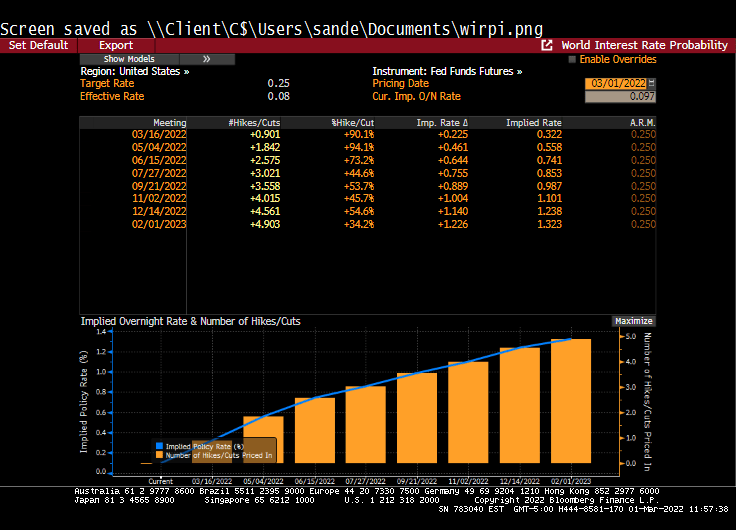
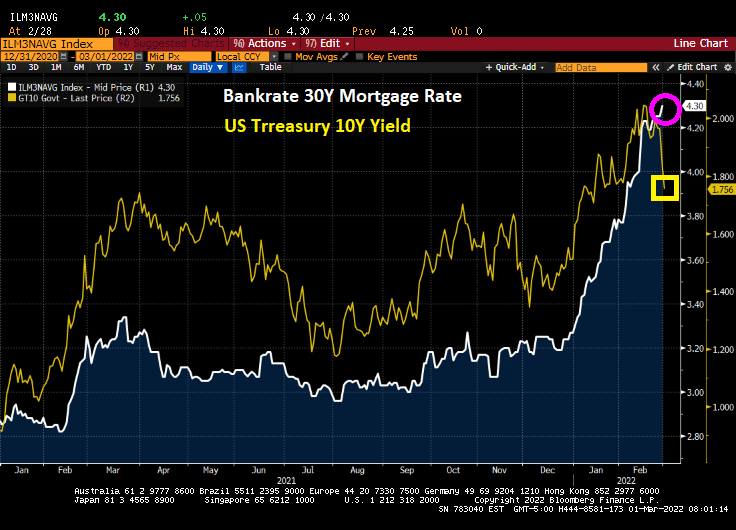
US 30-year mortgage rates rose to 4.32% (Bankrate) as the 10-year Treasury yield broke through the 2% barrier. This is happening as Fed Funds Futures are pointing toward 6+ rate increases over the coming year.
Actually, Fed Funds Futures are pricing in 7 rate increases over the coming year.
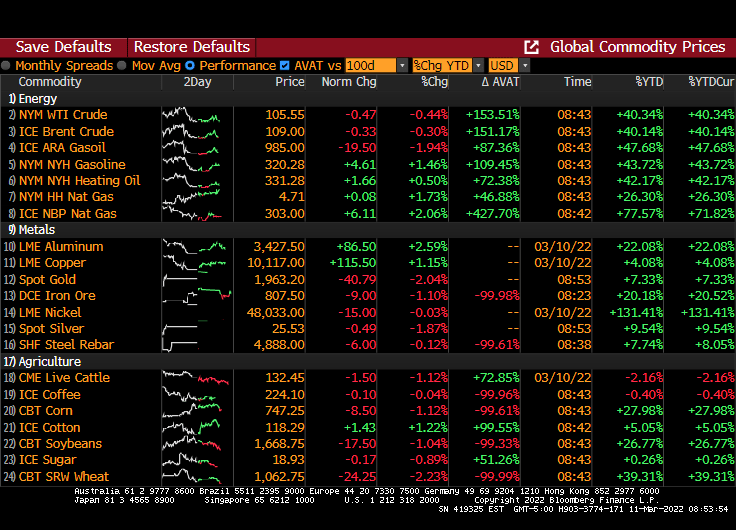
At least all is quiet on the commodities front.
So, it appears that Fed Chair Jay Powell will follow-through with numerous rate hikes over the coming year.
I guess Powell is tired of being a low-rate chump instead of a high-rate champ?
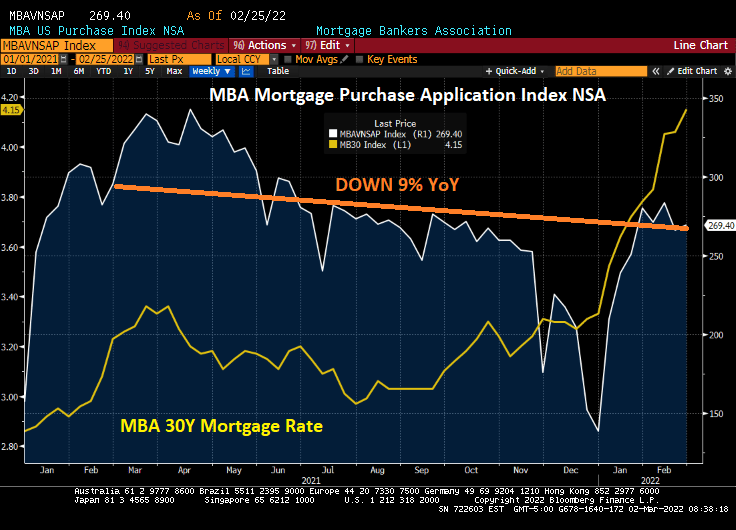
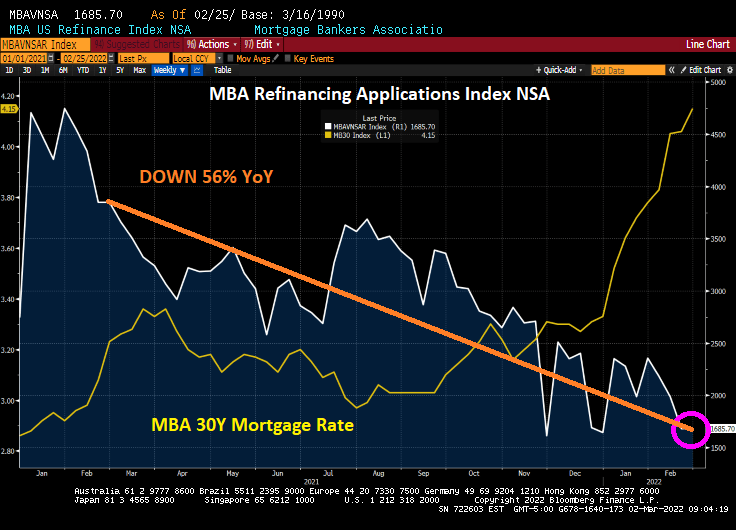
While Corelogic’s January home price index was hot, hot, hot (UP 19.1% YoY), today’s mortgage applications index for the week ending February 25, 2022 was not, not, not.
Mortgage applications decreased 0.71 percent from one week earlier, according to data from the Mortgage Bankers Association’s (MBA) Weekly Mortgage Applications Survey for the week ending February 25, 2022.
The seasonally adjusted Purchase Index decreased 1.76 percent from one week earlier. The unadjusted Purchase Index increased 1.16 percent compared with the previous week and was 9 percent lower than the same week one year ago.
The Refinance Index increased 1 percent from the previous week and was 56 percent lower than the same week one year ago.
Yes, the mortgage industry is going through some difficult times. But not as difficult as trying to understand Biden’s State of the Union address: “Putin may circle Kyiv with tanks, but he’ll never gain the hearts and souls of the Iranian people.” Huh?
And then Biden’s closing remark was “Go get ’em!” What? Go get whom? The Russians? Inflation? Trump supporters?? I feel like Biden thought the SOTU was the annual Army-Navy football game.
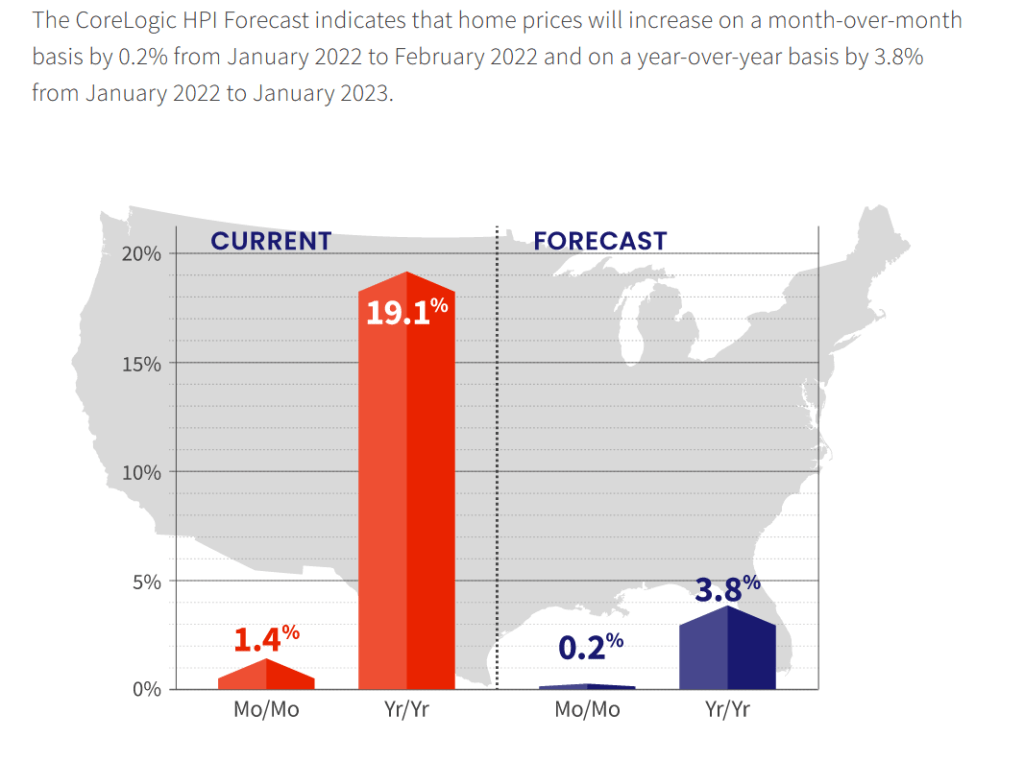
Home prices nationwide, including distressed sales, increased year over year by 19.1% in January 2022 compared with January 2021. On a month-over-month basis, home prices increased by 1.4% in January 2022 compared with December 2021 (revisions with public records data are standard, and to ensure accuracy, CoreLogic incorporates the newly released public data to provide updated results).
But Corelogic is still forecasting only 3.8% YoY growth in 2022.
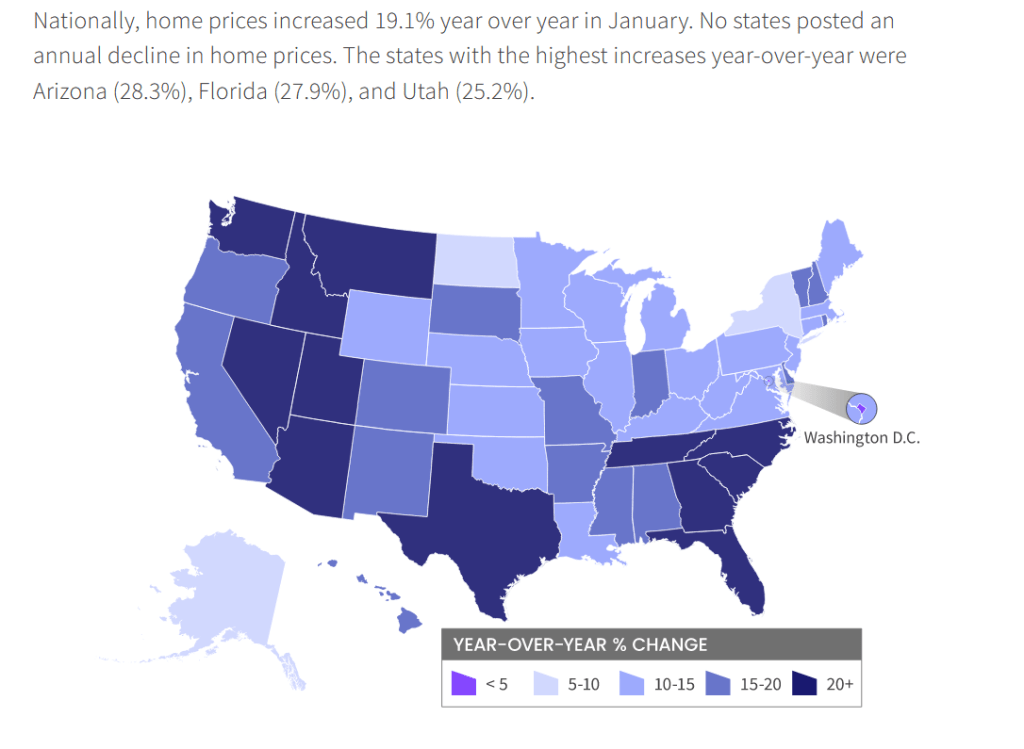
Home prices are hot, hot, hot in all states except North Dakota and New York. The fastest growing states are lower taxes, higher growth states.
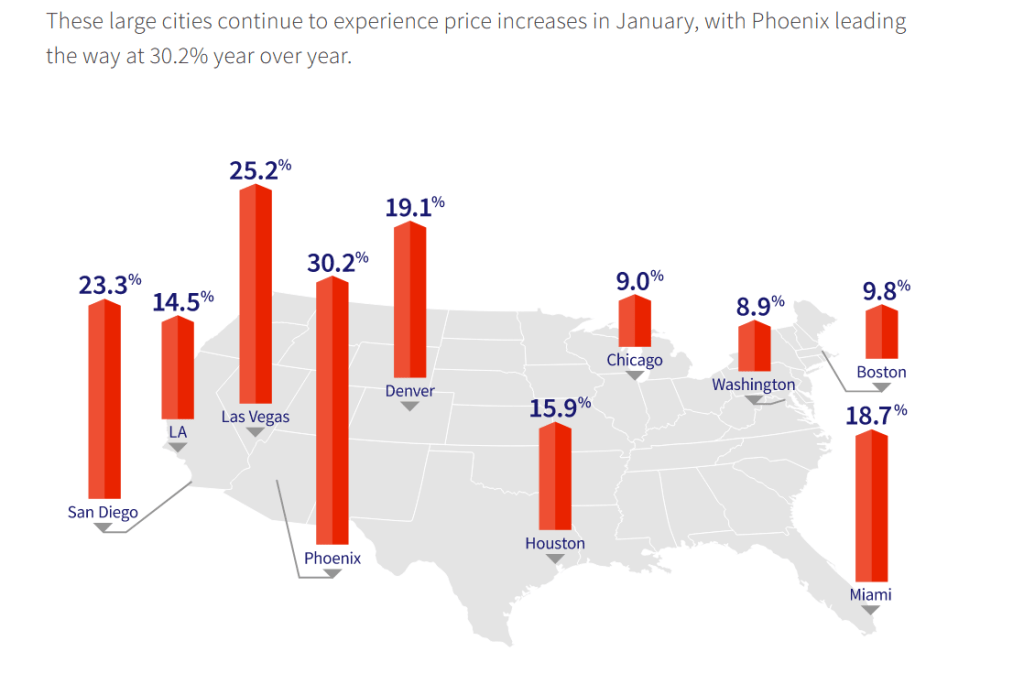
Phoenix, Las Vegas and San Diego are booming. But Chicago and Washington DC are growing at near 9% YoY.
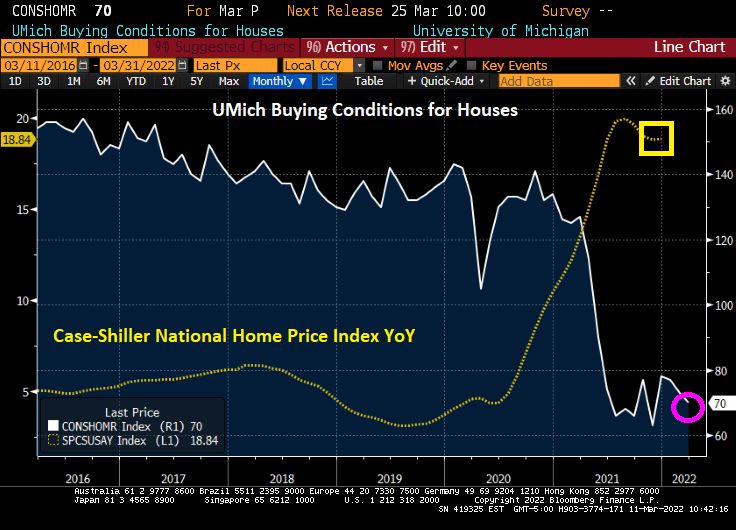
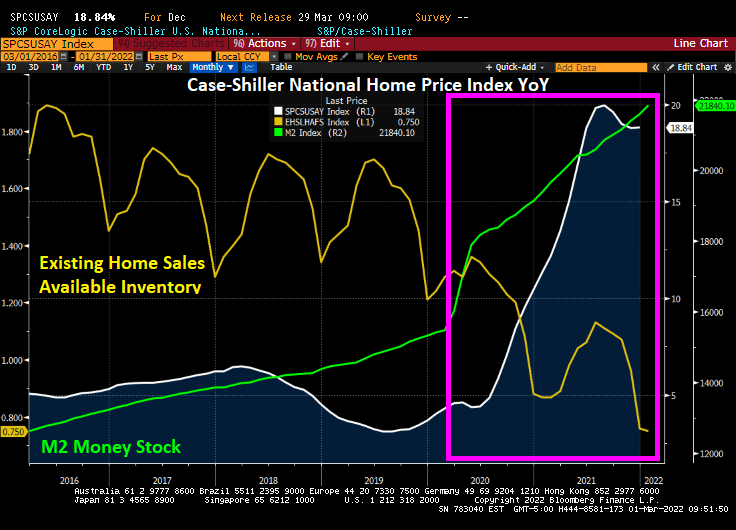
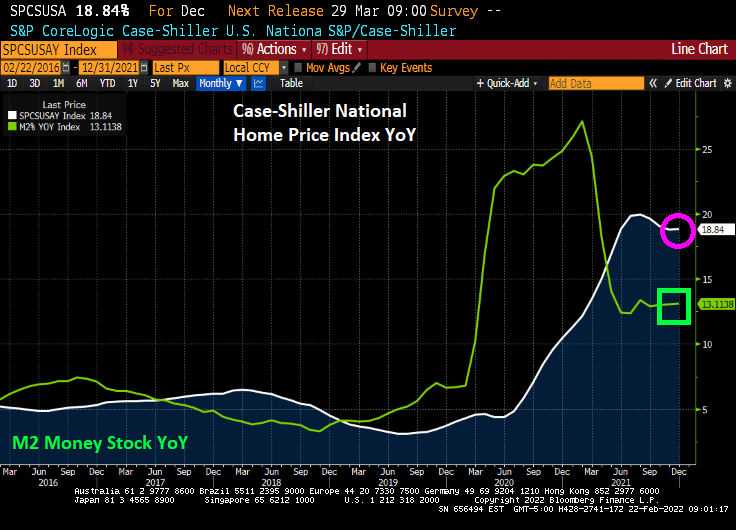
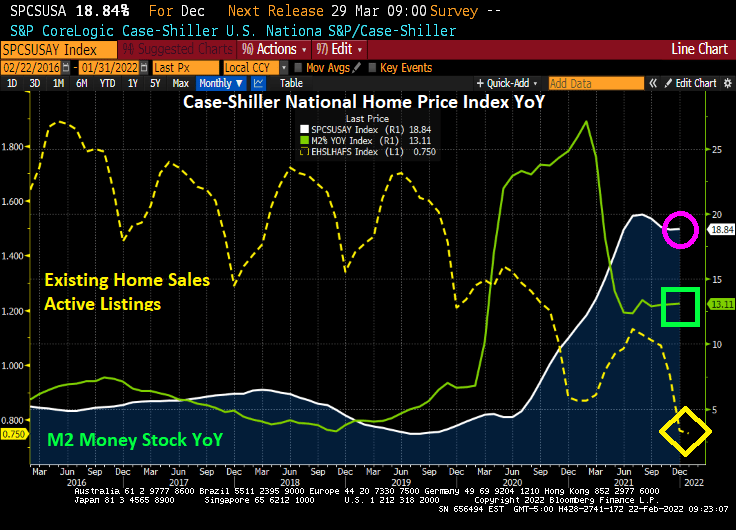
Case-Shiller’s December report show home prices growing at 18.84% YoY thanks to Fed stimulypto and historic low inventory of homes available for sale.
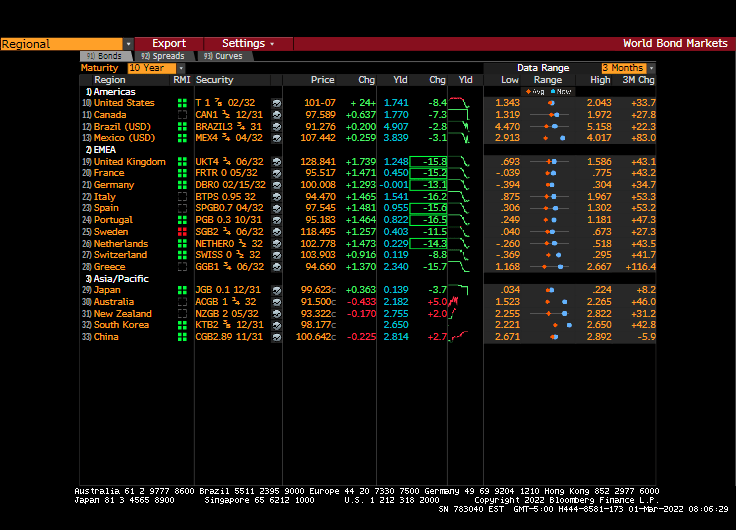
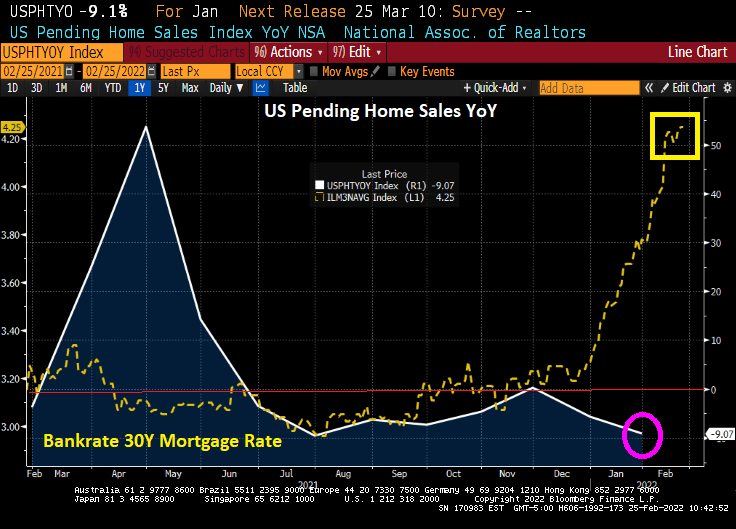
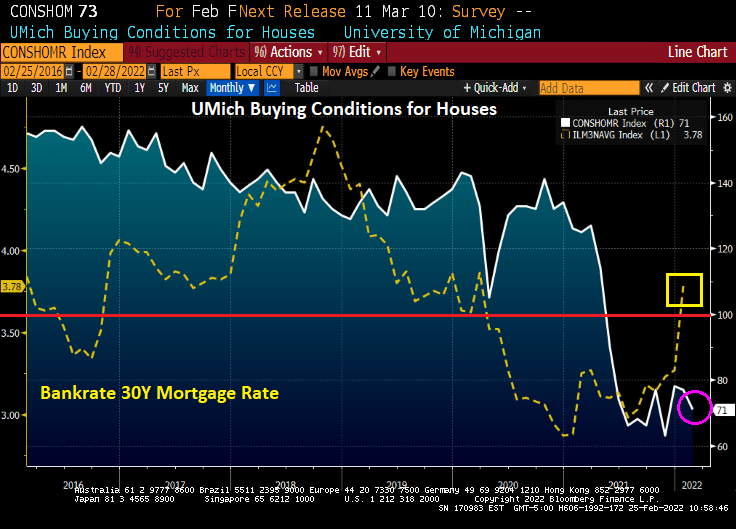
As someone who needs to move to Ohio, I would really appreciate it if mortgage rates would more closely follow the 10-year Treasury yield. But alas, Bankrate’s 30-year mortgage rate just rose to 4.30% as the US Treasury 10-year yield dropped -8.2 basis points.
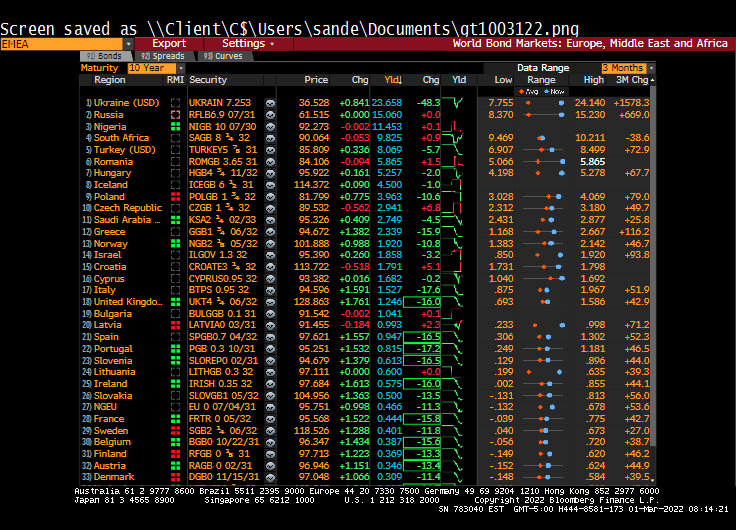
Europe. Middle East and Africa (EMEA) sovereign yields are all down over 10 basis points averaging around -15 bps.
Ukraine’s 10-year yield has plummeted by -48.3 bps this morning.
The anticipated meeting between Russia and Ukraine on Belarus soil was a failure. Likely due to Belarus showing-off their modern air force capabilities.
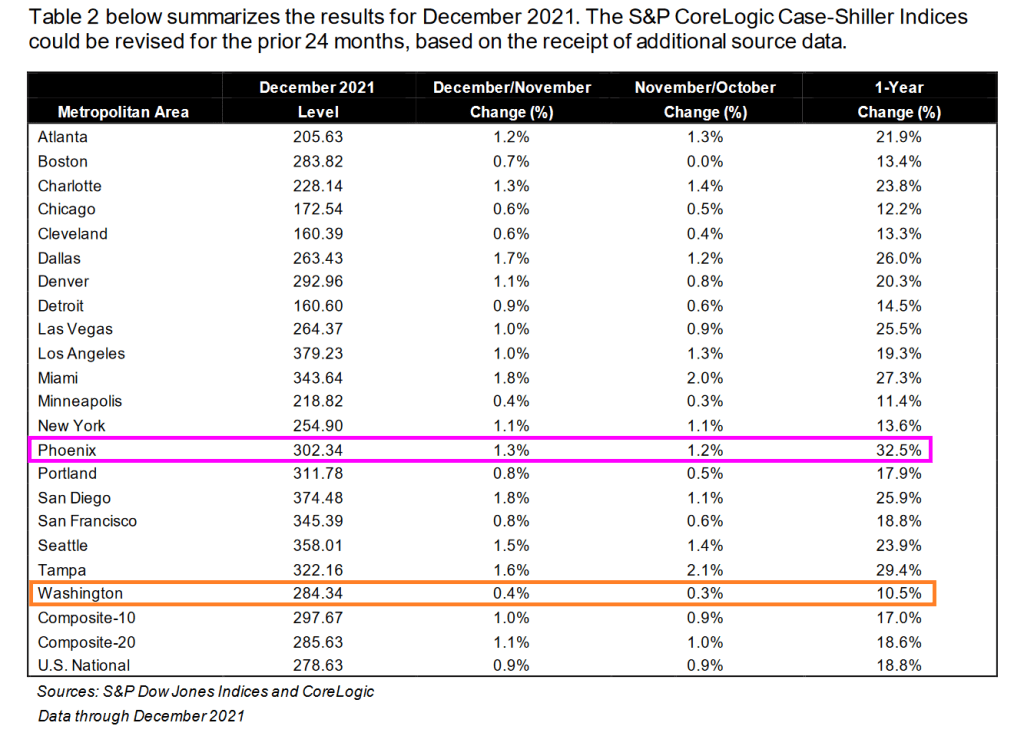
All 20 metro areas in the Case-Shiller 20 index grew at 10% or higher YoY with my former home city Phoenix leading the way at 32.5% YoY house price growth. Washington DC, aka Mordor on The Potomac, was in last place at 10.5% YoY.
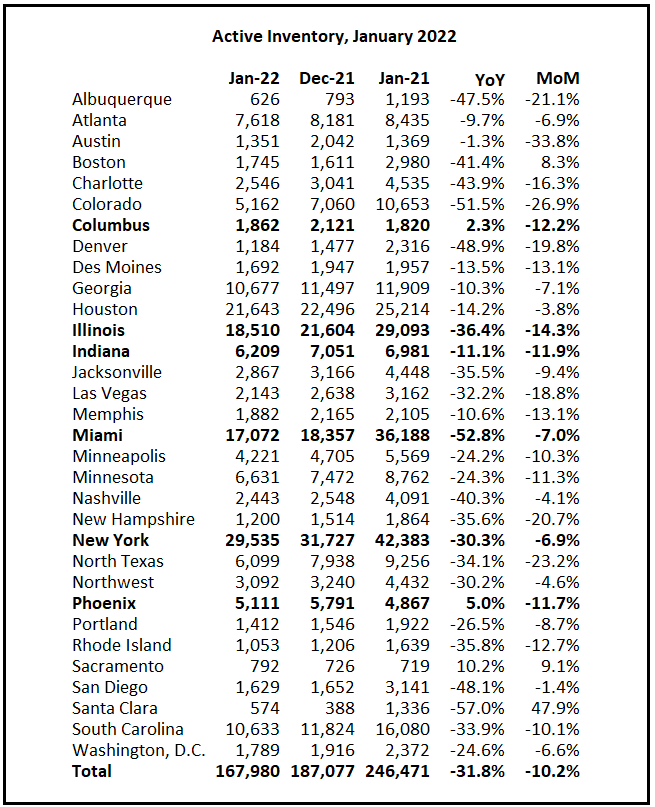
In terms of active inventory of housing, only Phoenix and Columbus Ohio are showing positive growth in active inventory YoY. But even Phoenix and Columbus saw a decline MoM (or month-over-month).
Including Existing Home Sales Active listings in the first chart, we see The Federal Reserve continuing to pump money at at 13.11% clip while active inventory is at an all-time low.
In January 2020, just prior to the COVID outbreak in the US, the Case-Shiller national home price index was growing at 4% YoY, the Zilliow rent index (all homes) was growing at 2.92% YoY and REAL average hourly earnings were growing at 0.52% YoY.
Then COVID struck and the Federal government dumped trillions of dollars of stimulus into the economy and The Federal Reserve massively expanded its balance sheet. Now the US has home prices growing at a 18.8% rate, rents (for those who can’t afford to purchase a home) growing at 14.91% and REAL hourly earnings growing at -1.80%.
The site Apartment List has an even bleaker view of rent growth, with rents in January 2022 having grown by 18% YoY.
Now that COVID is fading, we see New York City rents growing at 33.5% YoY followed by Florida and Arizona cities at 29.3% and higher rates. Irvine CA is seventh at 28%. The slowest growing city is Oakland, CA is growing at only 0.5%.
If The Fed does its expected “shock and awe” (or shock and awful), it will be more than the stock markets will crash. The housing market could crash too.
Take the current US housing situation with its limited inventory of listings combined with massive Fed stimulypto.
US 1-unit housing starts are down -4.1% in January. But heck, it is January! But on a year-over-year basis, 1-unit housing starts are down -2.4%. But what will happen if The Fed ACTUALLY withdraws its gargantuan monetary stimulus (green line)?
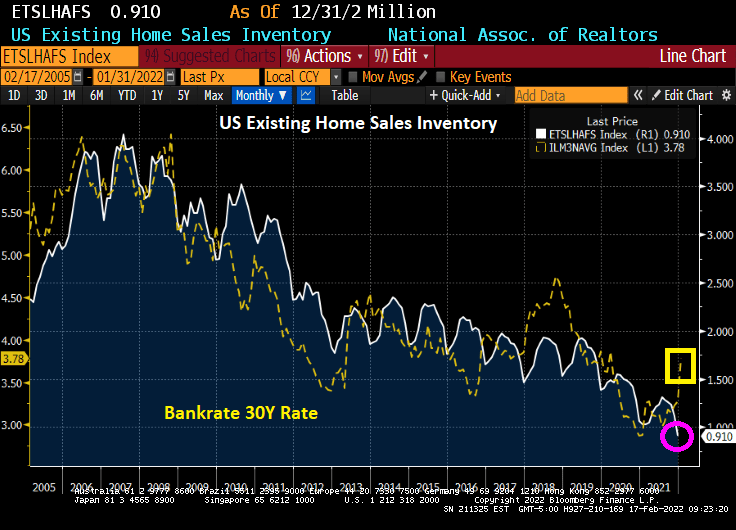
Existing home sales inventory continues to decline as Bankrate’s 30-year mortgage rate starts to climb with expectations of Fed “Shock and Awful.”
Say hello to The Federal Reserve Board of Governors!
How bad is inflation in the USA? Try 18%, based on the Flexible Consumer Price Index.
The Flexible Price Consumer Price Index (CPI) is calculated from a subset of goods and services included in the CPI that change price relatively frequently. Because flexible prices are quick to change, it assumes that when these prices are set, they incorporate less of an expectation about future inflation.
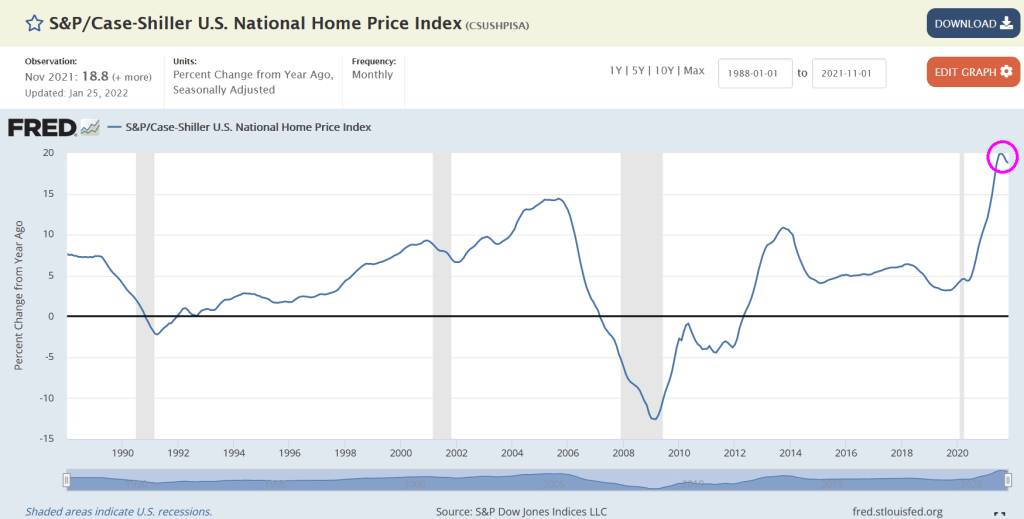
Again, remember that Federal inflation numbers woefully undercount housing and rent inflation. For example, the Case-Shiller National Home Price index (as of November 2021) was growing at 18.8%.
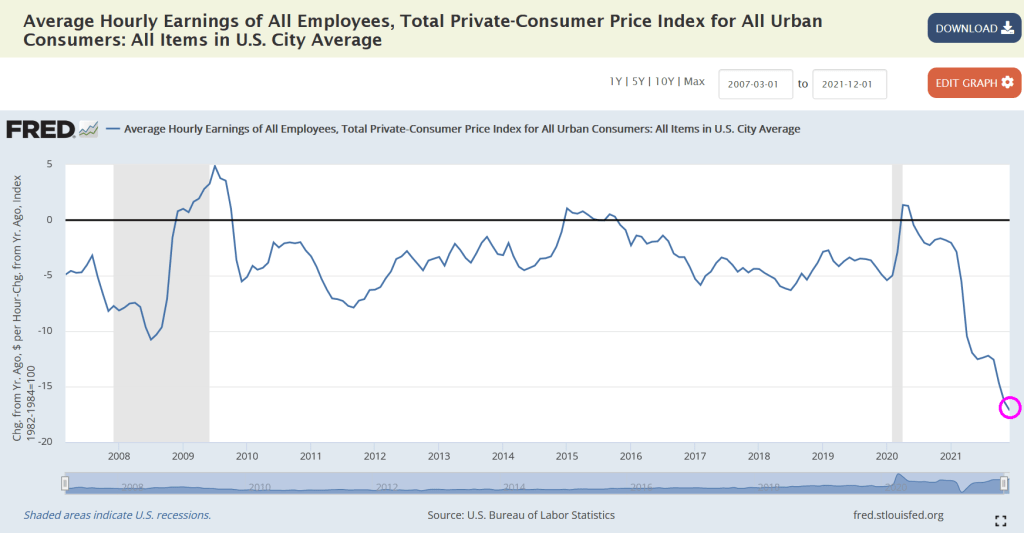
The sad part is that inflation-adjusted average hourly earnings growth of all employees is crashing thanks to inflation.














 Confounded Interest - Anthony B. Sanders
You must be logged in to post a comment.